Log entries by program:
| Program name | Lines | %Lines | Size | %Size |
|---|---|---|---|---|
| inn | 17862 | 88.7% | 1.7 MB | 84.3% |
| innd | 1265 | 6.3% | 178.8 KB | 8.8% |
| innfeed | 877 | 4.4% | 126.4 KB | 6.2% |
| nocem | 117 | 0.6% | 12.8 KB | 0.6% |
| nnrpd | 12 | 0.1% | 1.1 KB | 0.1% |
| controlchan | 1 | 0.0% | 0.1 KB | 0.0% |
| TOTAL: 6 | 20134 | 100.0% | 2.0 MB | 100.0% |
History cache:
| Reason | Count | %Count |
|---|---|---|
| Do not exist | 17196 | 97.6% |
| Negative hits | 232 | 1.3% |
| Positive hits | 171 | 1.0% |
| Cache misses | 25 | 0.1% |
| TOTAL: 4 | 17624 | 100.0% |
INND timer:
| Code region | Time | Pct | Invoked | Min(ms) | Avg(ms) | Max(ms) |
|---|---|---|---|---|---|---|
| article cancel | 00:00:00.066 | 0.0% | 234 | 0.000 | 0.282 | 2.000 |
| article cleanup | 00:00:00.077 | 0.0% | 17197 | 0.000 | 0.004 | 0.027 |
| article logging | 00:00:00.439 | 0.0% | 17681 | 0.000 | 0.025 | 0.089 |
| article parse | 00:00:00.231 | 0.0% | 19302 | 0.000 | 0.012 | 0.055 |
| article write | 00:00:04.196 | 0.0% | 17076 | 0.108 | 0.246 | 2.216 |
| artlog/artcncl | 00:00:00.005 | 0.0% | 189 | 0.000 | 0.026 | 1.000 |
| artlog/artwrite | 00:00:00.000 | 0.0% | 0 | 0.000 | 0.000 | 0.000 |
| data move | 00:00:00.009 | 0.0% | 21421 | 0.000 | 0.000 | 0.013 |
| hisgrep/artcncl | 00:00:00.005 | 0.0% | 192 | 0.000 | 0.026 | 1.000 |
| hishave/artcncl | 00:00:00.002 | 0.0% | 234 | 0.000 | 0.009 | 0.333 |
| history grep | 00:00:00.000 | 0.0% | 0 | 0.000 | 0.000 | 0.000 |
| history lookup | 00:00:00.469 | 0.0% | 17442 | 0.000 | 0.027 | 0.608 |
| history sync | 00:00:00.014 | 0.0% | 298 | 0.000 | 0.047 | 0.500 |
| history write | 00:00:02.082 | 0.0% | 17190 | 0.000 | 0.121 | 1.857 |
| hiswrite/artcncl | 00:00:00.003 | 0.0% | 42 | 0.000 | 0.071 | 0.500 |
| idle | 23:59:57.220 | 100.0% | 19976 | 2380.758 | 4325.051 | 10715.161 |
| nntp read | 00:00:00.420 | 0.0% | 19737 | 0.000 | 0.021 | 0.056 |
| overview write | 00:00:02.791 | 0.0% | 17076 | 0.031 | 0.163 | 1.488 |
| perl filter | 00:00:09.741 | 0.0% | 17190 | 0.415 | 0.567 | 0.973 |
| python filter | 00:00:00.000 | 0.0% | 0 | 0.000 | 0.000 | 0.000 |
| site send | 00:00:00.246 | 0.0% | 17187 | 0.000 | 0.014 | 0.085 |
| TOTAL: 24:00:20.221 | 24:00:18.016 | 100.0% | - | - | - | - |
INNfeed timer:
| Code region | Time | Pct | Invoked | Min(ms) | Avg(ms) | Max(ms) |
|---|---|---|---|---|---|---|
| article new | 00:00:00.024 | 0.0% | 17060 | 0.000 | 0.001 | 0.020 |
| article prepare | 00:00:00.005 | 0.0% | 136404 | 0.000 | 0.000 | 0.001 |
| article read | 00:00:00.590 | 0.0% | 17059 | 0.000 | 0.035 | 0.619 |
| backlog stats | 00:00:00.032 | 0.0% | 76312 | 0.000 | 0.000 | 0.004 |
| callbacks | 00:00:00.000 | 0.0% | 0 | 0.000 | 0.000 | 0.000 |
| data read | 00:00:00.256 | 0.0% | 53146 | 0.000 | 0.005 | 0.018 |
| data write | 00:00:00.560 | 0.0% | 36128 | 0.000 | 0.016 | 0.034 |
| idle | 23:58:10.992 | 100.0% | 76312 | 589.995 | 1130.766 | 3440.381 |
| status file | 00:00:00.163 | 0.0% | 210 | 0.000 | 0.776 | 13.250 |
| TOTAL: 23:58:13.488 | 23:58:12.622 | 100.0% | - | - | - | - |
nnrpd timer:
| Code region | Time | Pct | Invoked | Min(ms) | Avg(ms) | Max(ms) |
|---|---|---|---|---|---|---|
| idle | 00:00:00.192 | 26.6% | 4 | 11.000 | 48.000 | 85.000 |
| newnews | 00:00:00.000 | 0.0% | 0 | 0.000 | 0.000 | 0.000 |
| nntpwrite | 00:00:00.000 | 0.0% | 14 | 0.000 | 0.000 | 0.000 |
| TOTAL: 00:00:00.723 | 00:00:00.192 | 26.6% | - | - | - | - |
Control commands to INND:
| Command | Number |
|---|---|
| L | 1 |
| flush | 3 |
| flushlogs | 2 |
| go | 2 |
| logmode | 2 |
| mode | 149 |
| name | 2 |
| pause | 2 |
| paused | 2 |
| reload | 2 |
| reserve | 2 |
| TOTAL: 11 | 169 |
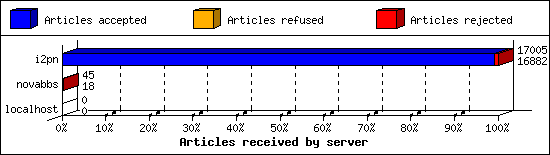
Incoming Feeds (INN):
| Server | Connects | Offered | Taken | Refused | Reject | %Accpt | Elapsed | |
|---|---|---|---|---|---|---|---|---|
| 1 | i2pn | 5 | 17005 | 16882 | 5 | 118 | 99% | 24:03:32 |
| 2 | novabbs | 18 | 45 | 18 | 25 | 2 | 40% | 03:43:51 |
| 3 | localhost | 31 | 0 | 0 | 0 | 0 | 0% | 00:00:00 |
| TOTAL: 3 | 54 | 17050 | 16900 | 30 | 120 | 99% | 27:47:23 | |
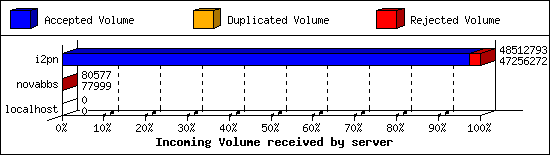
Incoming Volume (INN):
| Server | AcceptVol | DupVol | RejVol | TotalVol | %Acc | Vol/Art | |
|---|---|---|---|---|---|---|---|
| 1 | i2pn | 45.1 MB | 10.0 KB | 1.2 MB | 46.3 MB | 97% | 2.8 KB |
| 2 | novabbs | 76.2 KB | 0.0 KB | 2.5 KB | 78.7 KB | 96% | 3.9 KB |
| 3 | localhost | 0.0 KB | 0.0 KB | 0.0 KB | 0.0 KB | 0% | 0 |
| TOTAL: 3 | 45.1 MB | 10.0 KB | 1.2 MB | 46.3 MB | 97% | 2.8 KB | |
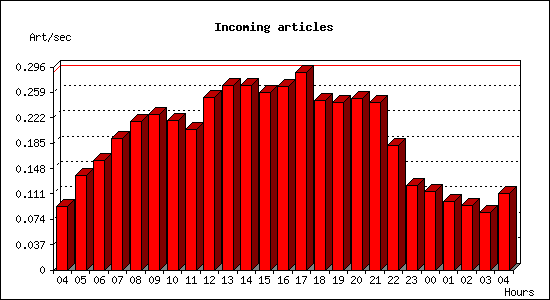
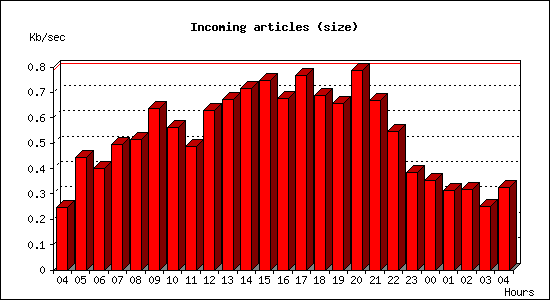
Incoming articles:
| Date | Articles | %Arts | Art/sec | Size | %Size | KB/sec |
|---|---|---|---|---|---|---|
| May 8 04:15:01 - 04:59:59 | 250 | 1.5% | 0.09 | 669.8 KB | 1.4% | 0.25 |
| May 8 05:00:00 - 05:59:59 | 494 | 2.9% | 0.14 | 1.6 MB | 3.4% | 0.44 |
| May 8 06:00:00 - 06:59:59 | 577 | 3.4% | 0.16 | 1.4 MB | 3.1% | 0.40 |
| May 8 07:00:00 - 07:59:59 | 690 | 4.0% | 0.19 | 1.7 MB | 3.8% | 0.49 |
| May 8 08:00:00 - 08:59:59 | 781 | 4.6% | 0.22 | 1.8 MB | 4.0% | 0.51 |
| May 8 09:00:00 - 09:59:59 | 814 | 4.8% | 0.23 | 2.2 MB | 4.9% | 0.64 |
| May 8 10:00:00 - 10:59:59 | 787 | 4.6% | 0.22 | 2.0 MB | 4.3% | 0.56 |
| May 8 11:00:00 - 11:59:59 | 739 | 4.3% | 0.21 | 1.7 MB | 3.8% | 0.49 |
| May 8 12:00:00 - 12:59:59 | 907 | 5.3% | 0.25 | 2.2 MB | 4.8% | 0.63 |
| May 8 13:00:00 - 13:59:59 | 971 | 5.7% | 0.27 | 2.4 MB | 5.2% | 0.67 |
| May 8 14:00:00 - 14:59:59 | 968 | 5.7% | 0.27 | 2.5 MB | 5.5% | 0.71 |
| May 8 15:00:00 - 15:59:59 | 930 | 5.4% | 0.26 | 2.6 MB | 5.7% | 0.75 |
| May 8 16:00:00 - 16:59:59 | 962 | 5.6% | 0.27 | 2.4 MB | 5.2% | 0.68 |
| May 8 17:00:00 - 17:59:59 | 1039 | 6.1% | 0.29 | 2.7 MB | 5.9% | 0.77 |
| May 8 18:00:00 - 18:59:59 | 888 | 5.2% | 0.25 | 2.4 MB | 5.3% | 0.69 |
| May 8 19:00:00 - 19:59:59 | 880 | 5.2% | 0.24 | 2.3 MB | 5.1% | 0.66 |
| May 8 20:00:00 - 20:59:59 | 898 | 5.3% | 0.25 | 2.8 MB | 6.1% | 0.79 |
| May 8 21:00:00 - 21:59:59 | 881 | 5.2% | 0.24 | 2.3 MB | 5.1% | 0.67 |
| May 8 22:00:00 - 22:59:59 | 656 | 3.8% | 0.18 | 1.9 MB | 4.2% | 0.55 |
| May 8 23:00:00 - 23:59:59 | 444 | 2.6% | 0.12 | 1.3 MB | 3.0% | 0.38 |
| May 9 00:00:00 - 00:59:59 | 414 | 2.4% | 0.12 | 1.2 MB | 2.7% | 0.35 |
| May 9 01:00:00 - 01:59:59 | 359 | 2.1% | 0.10 | 1.1 MB | 2.4% | 0.31 |
| May 9 02:00:00 - 02:59:59 | 339 | 2.0% | 0.09 | 1.1 MB | 2.4% | 0.32 |
| May 9 03:00:00 - 03:59:59 | 301 | 1.8% | 0.08 | 899.0 KB | 1.9% | 0.25 |
| May 9 04:00:00 - 04:15:01 | 101 | 0.6% | 0.11 | 293.3 KB | 0.6% | 0.33 |
| TOTAL: 24:00:00 | 17070 | 100.0% | 0.20 | 45.6 MB | 100.0% | 0.54 |
Sites sending bad articles:
| Server | Total | Group | Dist | Duplic | Unapp | TooOld | Site | Line | Other | |
|---|---|---|---|---|---|---|---|---|---|---|
| 1 | i2pn | 602 | 0 | 0 | 7 | 0 | 0 | 0 | 0 | 595 |
| 2 | novabbs | 2 | 2 | 0 | 0 | 0 | 0 | 0 | 0 | 0 |
| TOTAL: 2 | 604 | 2 | 0 | 7 | 0 | 0 | 0 | 0 | 595 | |
Unwanted newsgroups [Top 20]:
| Newsgroup | Count |
|---|---|
| rocksolid.ru.talk | 2 |
| TOTAL: 1 | 2 |
INND Perl filter [Top 20]:
| Reason | Count |
|---|---|
| Scoring filter (s5) | 72 |
| Scoring filter (s6) | 35 |
| Scoring filter (n4) | 4 |
| TOTAL: 3 | 111 |
NoCeM on Spool:
| Id | Good | Bad | Unique | Total |
|---|---|---|---|---|
| bleachbot@httrack.com | 98 | 0 | 103 | 103 |
| TOTAL: 1 | 98 | 13 | 103 | 103 |
Miscellaneous innd statistics [Top 10]:
| Event | Server | Number |
|---|---|---|
| Including strange strings | ||
| i2pn | 484 | |
| TOTAL: 1 | 484 | |
| TOTAL: 1 | 484 | |
Outgoing Feeds (innfeed) by Articles:
| Server | Offered | Taken | Refused | Reject | Miss | Spool | %Took | Elapsed | |
|---|---|---|---|---|---|---|---|---|---|
| 1 | novabbs | 17054 | 17014 | 1 | 37 | 0 | 0 | 99% | 23:59:57 |
| 2 | rocksolidbbs | 17082 | 16041 | 4 | 1025 | 0 | 0 | 93% | 23:59:57 |
| 3 | i2pn | 28 | 4 | 14 | 0 | 0 | 0 | 14% | 01:20:06 |
| TOTAL: 3 | 34164 | 33059 | 19 | 1062 | 0 | 0 | 96% | 49:20:00 | |

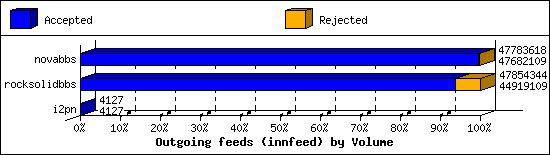
Outgoing Feeds (innfeed) by Volume:
| Server | AcceptVol | RejectVol | TotalVol | Volume/sec | Vol/Art | Elapsed | |
|---|---|---|---|---|---|---|---|
| 1 | novabbs | 45.5 MB | 99.1 KB | 45.6 MB | 0.5 KB/s | 2.7 KB | 23:59:57 |
| 2 | rocksolidbbs | 42.8 MB | 2.8 MB | 45.6 MB | 0.5 KB/s | 2.7 KB | 23:59:57 |
| 3 | i2pn | 4.0 KB | 0.0 KB | 4.0 KB | 0.0 KB/s | 1.0 KB | 01:20:06 |
| TOTAL: 3 | 88.3 MB | 2.9 MB | 91.2 MB | 0.5 KB/s | 2.7 KB | 49:20:00 | |
NNRP readership statistics:
| System | Conn | Arts | Size | Groups | Post | Rej | Elapsed | |
|---|---|---|---|---|---|---|---|---|
| 1 | worker-18.sfj.corp.censys.io | 1 | 0 | 0.0 KB | 0 | 0 | 0 | 00:00:00 |
| 2 | scan-141.security.ipip.net | 1 | 0 | 0.0 KB | 0 | 0 | 0 | 00:00:00 |
| TOTAL: 2 | 2 | 0 | 0.0 KB | 0 | 0 | 0 | 00:00:00 | |
NNRP readership statistics (by domain):
| System | Conn | Arts | Size | Groups | Post | Rej | Elapsed | |
|---|---|---|---|---|---|---|---|---|
| 1 | *.sfj.corp.censys.io | 1 | 0 | 0.0 KB | 0 | 0 | 0 | 00:00:00 |
| 2 | *.security.ipip.net | 1 | 0 | 0.0 KB | 0 | 0 | 0 | 00:00:00 |
| TOTAL: 2 | 2 | 0 | 0.0 KB | 0 | 0 | 0 | 00:00:00 | |
NNRP total resource statistics [Top 20]:
| System | User(ms) | System(ms) | Idle(ms) | Elapsed |
|---|---|---|---|---|
| scan-141.security.ipip.net | 0.044 | 0.000 | 0.000 | 00:00:00 |
| worker-18.sfj.corp.censys.io | 0.048 | 0.000 | 0.000 | 00:00:00 |
| TOTAL: 2 | 0.092 | 0.000 | 0.000 | 00:00:00 |
NNRP unrecognized commands (by host):
| System | Conn |
|---|---|
| scan-141.security.ipip.net | 4 |
| TOTAL: 1 | 4 |
NNRP unrecognized commands (by command):
| Command | Count |
|---|---|
| Connection: close | 1 |
| User-Agent: HTTP Banner Detection (https... | 1 |
| GET / HTTP/1.1 | 1 |
| Host: 157.230.63.40:119 | 1 |
| TOTAL: 4 | 4 |
NNRP client timeouts [Top 20]:
| System | Conn | Peer |
|---|---|---|
| worker-18.sfj.corp.censys.io | 1 | 1 |
| TOTAL: 1 | 1 | 1 |
