Log entries by program:
| Program name | Lines | %Lines | Size | %Size |
|---|---|---|---|---|
| inn | 17046 | 88.0% | 1.6 MB | 83.4% |
| innd | 1310 | 6.8% | 186.3 KB | 9.5% |
| innfeed | 923 | 4.8% | 131.3 KB | 6.7% |
| nocem | 69 | 0.4% | 7.2 KB | 0.4% |
| nnrpd | 11 | 0.1% | 1.2 KB | 0.1% |
| controlchan | 1 | 0.0% | 0.0 KB | 0.0% |
| TOTAL: 6 | 19360 | 100.0% | 1.9 MB | 100.0% |
History cache:
| Reason | Count | %Count |
|---|---|---|
| Do not exist | 16392 | 98.0% |
| Negative hits | 180 | 1.1% |
| Positive hits | 135 | 0.8% |
| Cache misses | 13 | 0.1% |
| TOTAL: 4 | 16720 | 100.0% |
INND timer:
| Code region | Time | Pct | Invoked | Min(ms) | Avg(ms) | Max(ms) |
|---|---|---|---|---|---|---|
| article cancel | 00:00:00.054 | 0.0% | 148 | 0.000 | 0.365 | 6.250 |
| article cleanup | 00:00:00.067 | 0.0% | 16431 | 0.000 | 0.004 | 0.034 |
| article logging | 00:00:00.494 | 0.0% | 16921 | 0.000 | 0.029 | 0.106 |
| article parse | 00:00:00.275 | 0.0% | 18818 | 0.000 | 0.015 | 0.043 |
| article write | 00:00:04.945 | 0.0% | 16287 | 0.113 | 0.304 | 1.221 |
| artlog/artcncl | 00:00:00.002 | 0.0% | 117 | 0.000 | 0.017 | 0.500 |
| artlog/artwrite | 00:00:00.000 | 0.0% | 0 | 0.000 | 0.000 | 0.000 |
| data move | 00:00:00.008 | 0.0% | 21153 | 0.000 | 0.000 | 0.014 |
| hisgrep/artcncl | 00:00:00.001 | 0.0% | 137 | 0.000 | 0.007 | 0.333 |
| hishave/artcncl | 00:00:00.000 | 0.0% | 148 | 0.000 | 0.000 | 0.000 |
| history grep | 00:00:00.000 | 0.0% | 0 | 0.000 | 0.000 | 0.000 |
| history lookup | 00:00:00.076 | 0.0% | 16628 | 0.000 | 0.005 | 0.048 |
| history sync | 00:00:00.012 | 0.0% | 314 | 0.000 | 0.038 | 1.000 |
| history write | 00:00:01.218 | 0.0% | 16417 | 0.000 | 0.074 | 0.762 |
| hiswrite/artcncl | 00:00:00.001 | 0.0% | 11 | 0.000 | 0.091 | 0.500 |
| idle | 23:59:58.325 | 100.0% | 19412 | 1979.983 | 4450.769 | 12504.500 |
| nntp read | 00:00:00.487 | 0.0% | 19156 | 0.000 | 0.025 | 0.078 |
| overview write | 00:00:02.507 | 0.0% | 16287 | 0.026 | 0.154 | 1.912 |
| perl filter | 00:00:09.789 | 0.0% | 16417 | 0.435 | 0.596 | 0.960 |
| python filter | 00:00:00.000 | 0.0% | 0 | 0.000 | 0.000 | 0.000 |
| site send | 00:00:00.561 | 0.0% | 16349 | 0.000 | 0.034 | 0.130 |
| TOTAL: 24:00:21.468 | 24:00:18.822 | 100.0% | - | - | - | - |
INNfeed timer:
| Code region | Time | Pct | Invoked | Min(ms) | Avg(ms) | Max(ms) |
|---|---|---|---|---|---|---|
| article new | 00:00:00.027 | 0.0% | 16279 | 0.000 | 0.002 | 0.018 |
| article prepare | 00:00:00.014 | 0.0% | 130148 | 0.000 | 0.000 | 0.003 |
| article read | 00:00:00.597 | 0.0% | 16278 | 0.000 | 0.037 | 0.342 |
| backlog stats | 00:00:00.029 | 0.0% | 73489 | 0.000 | 0.000 | 0.005 |
| callbacks | 00:00:00.000 | 0.0% | 0 | 0.000 | 0.000 | 0.000 |
| data read | 00:00:00.285 | 0.0% | 50949 | 0.000 | 0.006 | 0.024 |
| data write | 00:00:00.597 | 0.0% | 34682 | 0.000 | 0.017 | 0.062 |
| idle | 23:58:28.462 | 100.0% | 73489 | 569.406 | 1174.441 | 3264.734 |
| status file | 00:00:00.074 | 0.0% | 222 | 0.000 | 0.333 | 1.000 |
| TOTAL: 23:58:31.070 | 23:58:30.085 | 100.0% | - | - | - | - |
nnrpd timer:
| Code region | Time | Pct | Invoked | Min(ms) | Avg(ms) | Max(ms) |
|---|---|---|---|---|---|---|
| idle | 00:00:09.971 | 94.5% | 3 | 79.500 | 3323.667 | 9812.000 |
| newnews | 00:00:00.000 | 0.0% | 0 | 0.000 | 0.000 | 0.000 |
| nntpwrite | 00:00:00.000 | 0.0% | 13 | 0.000 | 0.000 | 0.000 |
| TOTAL: 00:00:10.553 | 00:00:09.971 | 94.5% | - | - | - | - |
Control commands to INND:
| Command | Number |
|---|---|
| L | 1 |
| flush | 3 |
| flushlogs | 2 |
| go | 2 |
| logmode | 2 |
| mode | 149 |
| name | 2 |
| pause | 2 |
| paused | 2 |
| reload | 2 |
| reserve | 2 |
| TOTAL: 11 | 169 |
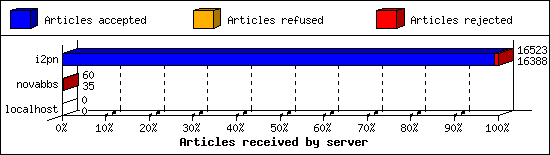
Incoming Feeds (INN):
| Server | Connects | Offered | Taken | Refused | Reject | %Accpt | Elapsed | |
|---|---|---|---|---|---|---|---|---|
| 1 | i2pn | 5 | 16523 | 16388 | 1 | 134 | 99% | 24:47:10 |
| 2 | novabbs | 23 | 60 | 35 | 18 | 7 | 58% | 04:57:40 |
| 3 | localhost | 32 | 0 | 0 | 0 | 0 | 0% | 00:00:00 |
| TOTAL: 3 | 60 | 16583 | 16423 | 19 | 141 | 99% | 29:44:50 | |
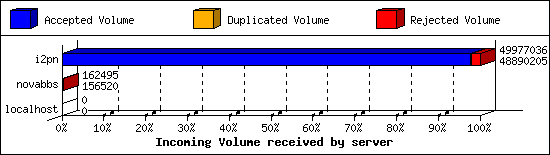
Incoming Volume (INN):
| Server | AcceptVol | DupVol | RejVol | TotalVol | %Acc | Vol/Art | |
|---|---|---|---|---|---|---|---|
| 1 | i2pn | 46.6 MB | 40.5 KB | 1020.9 KB | 47.7 MB | 97% | 3.0 KB |
| 2 | novabbs | 152.9 KB | 0.0 KB | 5.8 KB | 158.7 KB | 96% | 3.8 KB |
| 3 | localhost | 0.0 KB | 0.0 KB | 0.0 KB | 0.0 KB | 0% | 0 |
| TOTAL: 3 | 46.8 MB | 40.5 KB | 1.0 MB | 47.8 MB | 97% | 3.0 KB | |
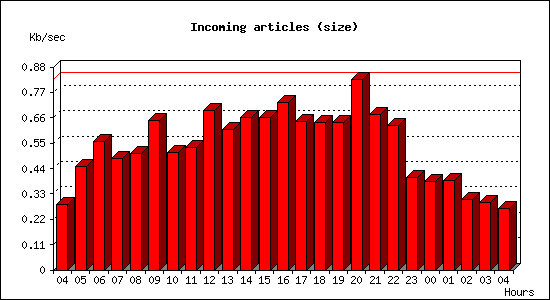
Incoming articles:
| Date | Articles | %Arts | Art/sec | Size | %Size | KB/sec |
|---|---|---|---|---|---|---|
| May 10 04:15:01 - 04:59:59 | 274 | 1.7% | 0.10 | 764.5 KB | 1.6% | 0.28 |
| May 10 05:00:00 - 05:59:59 | 501 | 3.1% | 0.14 | 1.6 MB | 3.4% | 0.45 |
| May 10 06:00:00 - 06:59:59 | 591 | 3.6% | 0.16 | 2.0 MB | 4.2% | 0.56 |
| May 10 07:00:00 - 07:59:59 | 709 | 4.4% | 0.20 | 1.7 MB | 3.7% | 0.48 |
| May 10 08:00:00 - 08:59:59 | 730 | 4.5% | 0.20 | 1.8 MB | 3.9% | 0.51 |
| May 10 09:00:00 - 09:59:59 | 841 | 5.2% | 0.23 | 2.3 MB | 5.0% | 0.65 |
| May 10 10:00:00 - 10:59:59 | 730 | 4.5% | 0.20 | 1.8 MB | 3.9% | 0.51 |
| May 10 11:00:00 - 11:59:59 | 743 | 4.6% | 0.21 | 1.9 MB | 4.1% | 0.53 |
| May 10 12:00:00 - 12:59:59 | 830 | 5.1% | 0.23 | 2.4 MB | 5.3% | 0.69 |
| May 10 13:00:00 - 13:59:59 | 819 | 5.0% | 0.23 | 2.1 MB | 4.6% | 0.61 |
| May 10 14:00:00 - 14:59:59 | 843 | 5.2% | 0.23 | 2.3 MB | 5.0% | 0.66 |
| May 10 15:00:00 - 15:59:59 | 923 | 5.7% | 0.26 | 2.3 MB | 5.0% | 0.66 |
| May 10 16:00:00 - 16:59:59 | 948 | 5.8% | 0.26 | 2.6 MB | 5.5% | 0.73 |
| May 10 17:00:00 - 17:59:59 | 889 | 5.5% | 0.25 | 2.3 MB | 4.9% | 0.65 |
| May 10 18:00:00 - 18:59:59 | 831 | 5.1% | 0.23 | 2.3 MB | 4.9% | 0.64 |
| May 10 19:00:00 - 19:59:59 | 747 | 4.6% | 0.21 | 2.3 MB | 4.9% | 0.64 |
| May 10 20:00:00 - 20:59:59 | 832 | 5.1% | 0.23 | 2.9 MB | 6.3% | 0.83 |
| May 10 21:00:00 - 21:59:59 | 800 | 4.9% | 0.22 | 2.4 MB | 5.1% | 0.68 |
| May 10 22:00:00 - 22:59:59 | 652 | 4.0% | 0.18 | 2.2 MB | 4.8% | 0.62 |
| May 10 23:00:00 - 23:59:59 | 453 | 2.8% | 0.13 | 1.4 MB | 3.1% | 0.40 |
| May 11 00:00:00 - 00:59:59 | 447 | 2.7% | 0.12 | 1.4 MB | 2.9% | 0.38 |
| May 11 01:00:00 - 01:59:59 | 408 | 2.5% | 0.11 | 1.4 MB | 2.9% | 0.39 |
| May 11 02:00:00 - 02:59:59 | 358 | 2.2% | 0.10 | 1.1 MB | 2.3% | 0.30 |
| May 11 03:00:00 - 03:59:59 | 313 | 1.9% | 0.09 | 1.0 MB | 2.2% | 0.29 |
| May 11 04:00:00 - 04:15:01 | 81 | 0.5% | 0.09 | 239.2 KB | 0.5% | 0.27 |
| TOTAL: 24:00:00 | 16293 | 100.0% | 0.19 | 46.2 MB | 100.0% | 0.55 |

Sites sending bad articles:
| Server | Total | Group | Dist | Duplic | Unapp | TooOld | Site | Line | Other | |
|---|---|---|---|---|---|---|---|---|---|---|
| 1 | i2pn | 626 | 2 | 0 | 14 | 0 | 0 | 0 | 0 | 610 |
| 2 | novabbs | 10 | 10 | 0 | 0 | 0 | 0 | 0 | 0 | 0 |
| TOTAL: 2 | 636 | 12 | 0 | 14 | 0 | 0 | 0 | 0 | 610 | |
Unwanted newsgroups [Top 20]:
| Newsgroup | Count |
|---|---|
| rocksolid.ru.talk | 7 |
| rocksolid.shared.test2 | 3 |
| hk.politics | 1 |
| alt.fr.outil.thunderbird | 1 |
| TOTAL: 4 | 12 |
INND Perl filter [Top 20]:
| Reason | Count |
|---|---|
| Scoring filter (s5) | 94 |
| Scoring filter (s6) | 24 |
| TOTAL: 2 | 118 |
NoCeM on Spool:
| Id | Good | Bad | Unique | Total |
|---|---|---|---|---|
| bleachbot@httrack.com | 44 | 0 | 44 | 44 |
| TOTAL: 1 | 44 | 18 | 44 | 44 |
Miscellaneous innd statistics [Top 10]:
| Event | Server | Number |
|---|---|---|
| Including strange strings | ||
| i2pn | 492 | |
| TOTAL: 1 | 492 | |
| TOTAL: 1 | 492 | |
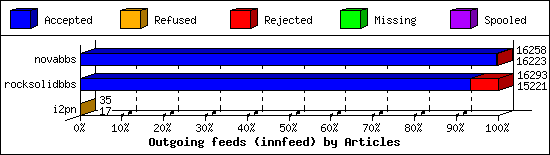
Outgoing Feeds (innfeed) by Articles:
| Server | Offered | Taken | Refused | Reject | Miss | Spool | %Took | Elapsed | |
|---|---|---|---|---|---|---|---|---|---|
| 1 | novabbs | 16261 | 16223 | 2 | 33 | 0 | 0 | 99% | 23:59:58 |
| 2 | rocksolidbbs | 16302 | 15221 | 1 | 1071 | 0 | 0 | 93% | 23:59:58 |
| 3 | i2pn | 48 | 17 | 18 | 0 | 0 | 0 | 35% | 03:18:49 |
| TOTAL: 3 | 32611 | 31461 | 21 | 1104 | 0 | 0 | 96% | 51:18:45 | |
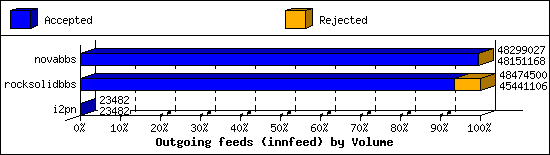
Outgoing Feeds (innfeed) by Volume:
| Server | AcceptVol | RejectVol | TotalVol | Volume/sec | Vol/Art | Elapsed | |
|---|---|---|---|---|---|---|---|
| 1 | novabbs | 45.9 MB | 144.4 KB | 46.1 MB | 0.5 KB/s | 2.9 KB | 23:59:58 |
| 2 | rocksolidbbs | 43.3 MB | 2.9 MB | 46.2 MB | 0.5 KB/s | 2.9 KB | 23:59:58 |
| 3 | i2pn | 22.9 KB | 0.0 KB | 22.9 KB | 0.0 KB/s | 1.3 KB | 03:18:49 |
| TOTAL: 3 | 89.3 MB | 3.0 MB | 92.3 MB | 0.5 KB/s | 2.9 KB | 51:18:45 | |
NNRP readership statistics:
| System | Conn | Arts | Size | Groups | Post | Rej | Elapsed | |
|---|---|---|---|---|---|---|---|---|
| 1 | scan-141.security.ipip.net | 1 | 0 | 0.0 KB | 0 | 0 | 0 | 00:00:00 |
| 2 | 107.170.234.219 | 1 | 0 | 0.0 KB | 0 | 0 | 0 | 00:00:09 |
| TOTAL: 2 | 2 | 0 | 0.0 KB | 0 | 0 | 0 | 00:00:10 | |
NNRP readership statistics (by domain):
| System | Conn | Arts | Size | Groups | Post | Rej | Elapsed | |
|---|---|---|---|---|---|---|---|---|
| 1 | unresolved | 1 | 0 | 0.0 KB | 0 | 0 | 0 | 00:00:09 |
| 2 | *.security.ipip.net | 1 | 0 | 0.0 KB | 0 | 0 | 0 | 00:00:00 |
| TOTAL: 2 | 2 | 0 | 0.0 KB | 0 | 0 | 0 | 00:00:10 | |
NNRP total resource statistics [Top 20]:
| System | User(ms) | System(ms) | Idle(ms) | Elapsed |
|---|---|---|---|---|
| 107.170.234.219 | 0.044 | 0.004 | 0.000 | 00:00:09 |
| scan-141.security.ipip.net | 0.048 | 0.000 | 0.000 | 00:00:00 |
| TOTAL: 2 | 0.092 | 0.004 | 0.000 | 00:00:10 |
NNRP unrecognized commands (by host):
| System | Conn |
|---|---|
| scan-141.security.ipip.net | 4 |
| TOTAL: 1 | 4 |
NNRP unrecognized commands (by command):
| Command | Count |
|---|---|
| Connection: close | 1 |
| Host: 157.230.63.40:119 | 1 |
| User-Agent: HTTP Banner Detection (https... | 1 |
| GET / HTTP/1.1 | 1 |
| TOTAL: 4 | 4 |
