Log entries by program:
| Program name | Lines | %Lines | Size | %Size |
|---|---|---|---|---|
| inn | 15393 | 86.8% | 1.5 MB | 82.4% |
| innd | 1312 | 7.4% | 189.0 KB | 10.4% |
| innfeed | 932 | 5.3% | 119.8 KB | 6.6% |
| nocem | 88 | 0.5% | 9.5 KB | 0.5% |
| nnrpd | 4 | 0.0% | 0.4 KB | 0.0% |
| controlchan | 1 | 0.0% | 0.1 KB | 0.0% |
| TOTAL: 6 | 17730 | 100.0% | 1.8 MB | 100.0% |
History cache:
| Reason | Count | %Count |
|---|---|---|
| Do not exist | 14777 | 80.5% |
| Positive hits | 2752 | 15.0% |
| Cache misses | 470 | 2.6% |
| Negative hits | 351 | 1.9% |
| TOTAL: 4 | 18350 | 100.0% |
INND timer:
| Code region | Time | Pct | Invoked | Min(ms) | Avg(ms) | Max(ms) |
|---|---|---|---|---|---|---|
| article cancel | 00:00:00.041 | 0.0% | 188 | 0.000 | 0.218 | 2.000 |
| article cleanup | 00:00:00.068 | 0.0% | 14805 | 0.000 | 0.005 | 0.027 |
| article logging | 00:00:00.447 | 0.0% | 15242 | 0.000 | 0.029 | 0.117 |
| article parse | 00:00:00.226 | 0.0% | 16786 | 0.000 | 0.013 | 0.054 |
| article write | 00:00:08.230 | 0.0% | 14652 | 0.226 | 0.562 | 4.074 |
| artlog/artcncl | 00:00:00.002 | 0.0% | 156 | 0.000 | 0.013 | 1.000 |
| artlog/artwrite | 00:00:00.000 | 0.0% | 0 | 0.000 | 0.000 | 0.000 |
| data move | 00:00:00.010 | 0.0% | 21893 | 0.000 | 0.000 | 0.014 |
| hisgrep/artcncl | 00:00:00.004 | 0.0% | 179 | 0.000 | 0.022 | 1.000 |
| hishave/artcncl | 00:00:00.001 | 0.0% | 188 | 0.000 | 0.005 | 0.250 |
| history grep | 00:00:00.000 | 0.0% | 0 | 0.000 | 0.000 | 0.000 |
| history lookup | 00:00:03.178 | 0.0% | 18213 | 0.000 | 0.174 | 1.142 |
| history sync | 00:00:00.011 | 0.0% | 310 | 0.000 | 0.035 | 0.500 |
| history write | 00:00:03.726 | 0.0% | 14805 | 0.000 | 0.252 | 1.537 |
| hiswrite/artcncl | 00:00:00.001 | 0.0% | 9 | 0.000 | 0.111 | 0.500 |
| idle | 23:59:52.492 | 100.0% | 20574 | 249.503 | 4199.110 | 12247.102 |
| nntp read | 00:00:00.503 | 0.0% | 20327 | 0.000 | 0.025 | 0.085 |
| overview write | 00:00:02.891 | 0.0% | 14652 | 0.016 | 0.197 | 1.193 |
| perl filter | 00:00:08.975 | 0.0% | 14805 | 0.437 | 0.606 | 0.981 |
| python filter | 00:00:00.000 | 0.0% | 0 | 0.000 | 0.000 | 0.000 |
| site send | 00:00:00.432 | 0.0% | 14731 | 0.000 | 0.029 | 0.142 |
| TOTAL: 24:00:24.011 | 24:00:21.238 | 100.0% | - | - | - | - |
INNfeed timer:
| Code region | Time | Pct | Invoked | Min(ms) | Avg(ms) | Max(ms) |
|---|---|---|---|---|---|---|
| article new | 00:00:00.039 | 0.0% | 41213 | 0.000 | 0.001 | 0.027 |
| article prepare | 00:00:00.008 | 0.0% | 104854 | 0.000 | 0.000 | 0.003 |
| article read | 00:00:00.643 | 0.0% | 15212 | 0.000 | 0.042 | 0.611 |
| backlog stats | 00:00:00.025 | 0.0% | 86653 | 0.000 | 0.000 | 0.005 |
| callbacks | 00:00:00.000 | 0.0% | 1 | 0.000 | 0.000 | 0.000 |
| data read | 00:00:00.326 | 0.0% | 55353 | 0.000 | 0.006 | 0.033 |
| data write | 00:00:00.661 | 0.0% | 39461 | 0.000 | 0.017 | 0.077 |
| idle | 23:58:37.613 | 100.0% | 86653 | 113.367 | 996.130 | 3759.769 |
| status file | 00:00:00.138 | 0.0% | 281 | 0.000 | 0.491 | 5.000 |
| TOTAL: 23:58:40.576 | 23:58:39.453 | 100.0% | - | - | - | - |
nnrpd timer:
| Code region | Time | Pct | Invoked | Min(ms) | Avg(ms) | Max(ms) |
|---|---|---|---|---|---|---|
| idle | 00:00:00.582 | 44.0% | 2 | 291.000 | 291.000 | 291.000 |
| newnews | 00:00:00.000 | 0.0% | 0 | 0.000 | 0.000 | 0.000 |
| nntpwrite | 00:00:00.000 | 0.0% | 33 | 0.000 | 0.000 | 0.000 |
| TOTAL: 00:00:01.322 | 00:00:00.582 | 44.0% | - | - | - | - |
Control commands to INND:
| Command | Number |
|---|---|
| L | 1 |
| flush | 3 |
| flushlogs | 2 |
| go | 2 |
| logmode | 2 |
| mode | 149 |
| name | 2 |
| pause | 2 |
| paused | 2 |
| reload | 2 |
| reserve | 2 |
| TOTAL: 11 | 169 |
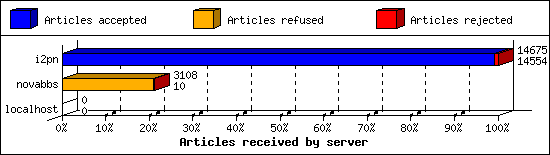
Incoming Feeds (INN):
| Server | Connects | Offered | Taken | Refused | Reject | %Accpt | Elapsed | |
|---|---|---|---|---|---|---|---|---|
| 1 | i2pn | 7 | 14675 | 14554 | 0 | 121 | 99% | 24:25:29 |
| 2 | novabbs | 17 | 3108 | 10 | 3063 | 35 | 0% | 05:22:53 |
| 3 | localhost | 34 | 0 | 0 | 0 | 0 | 0% | 00:00:00 |
| TOTAL: 3 | 58 | 17783 | 14564 | 3063 | 156 | 81% | 29:48:22 | |
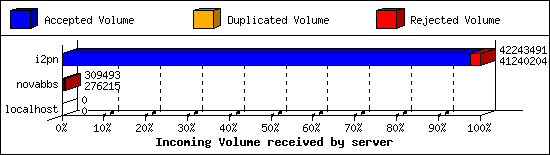
Incoming Volume (INN):
| Server | AcceptVol | DupVol | RejVol | TotalVol | %Acc | Vol/Art | |
|---|---|---|---|---|---|---|---|
| 1 | i2pn | 39.3 MB | 0.0 KB | 979.8 KB | 40.3 MB | 97% | 2.8 KB |
| 2 | novabbs | 269.7 KB | 0.0 KB | 32.5 KB | 302.2 KB | 89% | 6.7 KB |
| 3 | localhost | 0.0 KB | 0.0 KB | 0.0 KB | 0.0 KB | 0% | 0 |
| TOTAL: 3 | 39.6 MB | 0.0 KB | 1012.3 KB | 40.6 MB | 97% | 2.8 KB | |
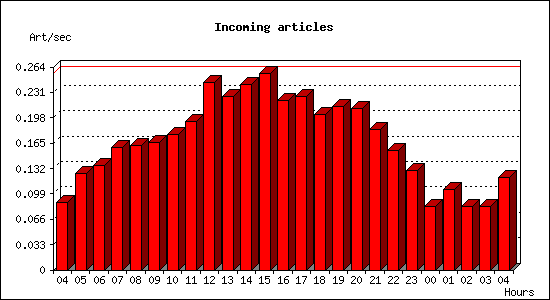
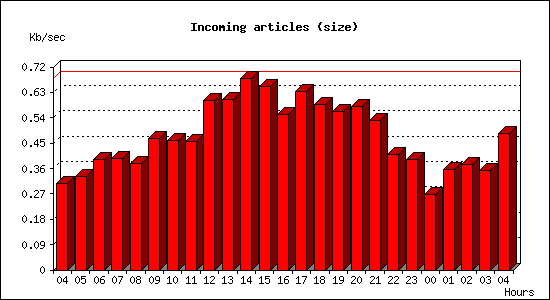
Incoming articles:
| Date | Articles | %Arts | Art/sec | Size | %Size | KB/sec |
|---|---|---|---|---|---|---|
| May 11 04:15:01 - 04:59:59 | 238 | 1.6% | 0.09 | 832.3 KB | 2.0% | 0.31 |
| May 11 05:00:00 - 05:59:59 | 451 | 3.1% | 0.13 | 1.2 MB | 2.9% | 0.33 |
| May 11 06:00:00 - 06:59:59 | 489 | 3.3% | 0.14 | 1.4 MB | 3.5% | 0.39 |
| May 11 07:00:00 - 07:59:59 | 574 | 3.9% | 0.16 | 1.4 MB | 3.5% | 0.39 |
| May 11 08:00:00 - 08:59:59 | 583 | 4.0% | 0.16 | 1.3 MB | 3.3% | 0.38 |
| May 11 09:00:00 - 09:59:59 | 597 | 4.1% | 0.17 | 1.6 MB | 4.1% | 0.47 |
| May 11 10:00:00 - 10:59:59 | 635 | 4.3% | 0.18 | 1.6 MB | 4.0% | 0.46 |
| May 11 11:00:00 - 11:59:59 | 693 | 4.7% | 0.19 | 1.6 MB | 4.0% | 0.46 |
| May 11 12:00:00 - 12:59:59 | 876 | 6.0% | 0.24 | 2.1 MB | 5.3% | 0.60 |
| May 11 13:00:00 - 13:59:59 | 810 | 5.5% | 0.23 | 2.1 MB | 5.3% | 0.60 |
| May 11 14:00:00 - 14:59:59 | 869 | 5.9% | 0.24 | 2.4 MB | 6.0% | 0.68 |
| May 11 15:00:00 - 15:59:59 | 922 | 6.3% | 0.26 | 2.3 MB | 5.7% | 0.65 |
| May 11 16:00:00 - 16:59:59 | 792 | 5.4% | 0.22 | 1.9 MB | 4.9% | 0.55 |
| May 11 17:00:00 - 17:59:59 | 813 | 5.5% | 0.23 | 2.2 MB | 5.6% | 0.63 |
| May 11 18:00:00 - 18:59:59 | 730 | 5.0% | 0.20 | 2.1 MB | 5.2% | 0.59 |
| May 11 19:00:00 - 19:59:59 | 767 | 5.2% | 0.21 | 2.0 MB | 4.9% | 0.56 |
| May 11 20:00:00 - 20:59:59 | 755 | 5.2% | 0.21 | 2.0 MB | 5.1% | 0.58 |
| May 11 21:00:00 - 21:59:59 | 656 | 4.5% | 0.18 | 1.9 MB | 4.7% | 0.53 |
| May 11 22:00:00 - 22:59:59 | 558 | 3.8% | 0.15 | 1.4 MB | 3.6% | 0.41 |
| May 11 23:00:00 - 23:59:59 | 465 | 3.2% | 0.13 | 1.4 MB | 3.4% | 0.39 |
| May 12 00:00:00 - 00:59:59 | 299 | 2.0% | 0.08 | 958.9 KB | 2.3% | 0.27 |
| May 12 01:00:00 - 01:59:59 | 376 | 2.6% | 0.10 | 1.2 MB | 3.1% | 0.36 |
| May 12 02:00:00 - 02:59:59 | 298 | 2.0% | 0.08 | 1.3 MB | 3.3% | 0.38 |
| May 12 03:00:00 - 03:59:59 | 296 | 2.0% | 0.08 | 1.2 MB | 3.1% | 0.35 |
| May 12 04:00:00 - 04:15:01 | 108 | 0.7% | 0.12 | 434.8 KB | 1.1% | 0.48 |
| TOTAL: 24:00:00 | 14650 | 100.0% | 0.17 | 39.9 MB | 100.0% | 0.47 |
Sites sending bad articles:
| Server | Total | Group | Dist | Duplic | Unapp | TooOld | Site | Line | Other | |
|---|---|---|---|---|---|---|---|---|---|---|
| 1 | i2pn | 556 | 1 | 0 | 0 | 0 | 0 | 0 | 0 | 555 |
| 2 | novabbs | 32 | 32 | 0 | 0 | 0 | 0 | 0 | 0 | 0 |
| TOTAL: 2 | 588 | 33 | 0 | 0 | 0 | 0 | 0 | 0 | 555 | |
Unwanted newsgroups [Top 20]:
| Newsgroup | Count |
|---|---|
| rocksolid.shared.test2 | 32 |
| hk.politics | 1 |
| TOTAL: 2 | 33 |
INND Perl filter [Top 20]:
| Reason | Count |
|---|---|
| Scoring filter (s5) | 100 |
| Scoring filter (s6) | 15 |
| Scoring filter (n4) | 4 |
| Scoring filter (s1) | 1 |
| TOTAL: 4 | 120 |
NoCeM on Spool:
| Id | Good | Bad | Unique | Total |
|---|---|---|---|---|
| bleachbot@httrack.com | 67 | 0 | 72 | 72 |
| TOTAL: 1 | 67 | 12 | 72 | 72 |
Miscellaneous innd statistics [Top 10]:
| Event | Server | Number |
|---|---|---|
| Including strange strings | ||
| i2pn | 435 | |
| TOTAL: 1 | 435 | |
| TOTAL: 1 | 435 | |
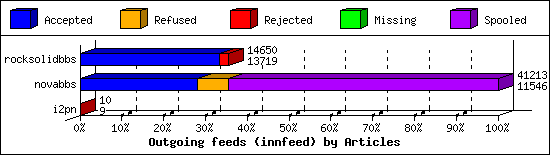
Outgoing Feeds (innfeed) by Articles:
| Server | Offered | Taken | Refused | Reject | Miss | Spool | %Took | Elapsed | |
|---|---|---|---|---|---|---|---|---|---|
| 1 | rocksolidbbs | 14663 | 13719 | 8 | 923 | 0 | 0 | 93% | 23:59:43 |
| 2 | novabbs | 44868 | 11546 | 3058 | 31 | 5 | 26573 | 25% | 23:59:57 |
| 3 | i2pn | 10 | 9 | 0 | 1 | 0 | 0 | 90% | 01:06:53 |
| TOTAL: 3 | 59541 | 25274 | 3066 | 955 | 5 | 26573 | 42% | 49:06:33 | |
Outgoing Feeds (innfeed) by Volume:
| Server | AcceptVol | RejectVol | TotalVol | Volume/sec | Vol/Art | Elapsed | |
|---|---|---|---|---|---|---|---|
| 1 | rocksolidbbs | 37.3 MB | 2.5 MB | 39.7 MB | 0.5 KB/s | 2.8 KB | 23:59:43 |
| 2 | novabbs | 30.9 MB | 87.4 KB | 31.0 MB | 0.4 KB/s | 2.7 KB | 23:59:57 |
| 3 | i2pn | 16.6 KB | 253.2 KB | 269.8 KB | 0.1 KB/s | 27.0 KB | 01:06:53 |
| TOTAL: 3 | 68.2 MB | 2.8 MB | 70.9 MB | 0.4 KB/s | 2.8 KB | 49:06:33 | |

NNRP readership statistics:
| System | Conn | Arts | Size | Groups | Post | Rej | Elapsed | |
|---|---|---|---|---|---|---|---|---|
| 1 | 125.64.94.211 | 1 | 0 | 0.0 KB | 0 | 0 | 0 | 00:00:01 |
| TOTAL: 1 | 1 | 0 | 0.0 KB | 0 | 0 | 0 | 00:00:01 | |
NNRP readership statistics (by domain):
| System | Conn | Arts | Size | Groups | Post | Rej | Elapsed | |
|---|---|---|---|---|---|---|---|---|
| 1 | unresolved | 1 | 0 | 0.0 KB | 0 | 0 | 0 | 00:00:01 |
| TOTAL: 1 | 1 | 0 | 0.0 KB | 0 | 0 | 0 | 00:00:01 | |
NNRP total resource statistics [Top 20]:
| System | User(ms) | System(ms) | Idle(ms) | Elapsed |
|---|---|---|---|---|
| 125.64.94.211 | 0.040 | 0.008 | 0.000 | 00:00:01 |
| TOTAL: 1 | 0.040 | 0.008 | 0.000 | 00:00:01 |
