Log entries by program:
| Program name | Lines | %Lines | Size | %Size |
|---|---|---|---|---|
| inn | 17504 | 87.6% | 1.6 MB | 83.2% |
| innd | 1430 | 7.2% | 215.1 KB | 10.6% |
| innfeed | 899 | 4.5% | 106.8 KB | 5.3% |
| nocem | 115 | 0.6% | 14.9 KB | 0.7% |
| nnrpd | 23 | 0.1% | 2.7 KB | 0.1% |
| controlchan | 1 | 0.0% | 0.1 KB | 0.0% |
| TOTAL: 6 | 19972 | 100.0% | 2.0 MB | 100.0% |
History cache:
| Reason | Count | %Count |
|---|---|---|
| Do not exist | 16906 | 96.5% |
| Negative hits | 424 | 2.4% |
| Positive hits | 181 | 1.0% |
| Cache misses | 16 | 0.1% |
| TOTAL: 4 | 17527 | 100.0% |
INND timer:
| Code region | Time | Pct | Invoked | Min(ms) | Avg(ms) | Max(ms) |
|---|---|---|---|---|---|---|
| article cancel | 00:00:00.035 | 0.0% | 206 | 0.000 | 0.170 | 2.000 |
| article cleanup | 00:00:00.077 | 0.0% | 16934 | 0.000 | 0.005 | 0.027 |
| article logging | 00:00:00.549 | 0.0% | 17353 | 0.000 | 0.032 | 0.079 |
| article parse | 00:00:00.206 | 0.0% | 19194 | 0.000 | 0.011 | 0.034 |
| article write | 00:00:03.870 | 0.0% | 16724 | 0.070 | 0.231 | 1.250 |
| artlog/artcncl | 00:00:00.002 | 0.0% | 144 | 0.000 | 0.014 | 0.500 |
| artlog/artwrite | 00:00:00.000 | 0.0% | 0 | 0.000 | 0.000 | 0.000 |
| data move | 00:00:00.009 | 0.0% | 21771 | 0.000 | 0.000 | 0.011 |
| hisgrep/artcncl | 00:00:00.002 | 0.0% | 191 | 0.000 | 0.010 | 0.286 |
| hishave/artcncl | 00:00:00.001 | 0.0% | 206 | 0.000 | 0.005 | 1.000 |
| history grep | 00:00:00.000 | 0.0% | 0 | 0.000 | 0.000 | 0.000 |
| history lookup | 00:00:00.089 | 0.0% | 17386 | 0.000 | 0.005 | 0.040 |
| history sync | 00:00:00.016 | 0.0% | 303 | 0.000 | 0.053 | 1.000 |
| history write | 00:00:01.460 | 0.0% | 16931 | 0.000 | 0.086 | 3.448 |
| hiswrite/artcncl | 00:00:00.001 | 0.0% | 15 | 0.000 | 0.067 | 1.000 |
| idle | 24:00:00.257 | 100.0% | 20059 | 2255.143 | 4307.306 | 11322.623 |
| nntp read | 00:00:00.529 | 0.0% | 19812 | 0.000 | 0.027 | 0.073 |
| overview write | 00:00:02.931 | 0.0% | 16724 | 0.019 | 0.175 | 2.488 |
| perl filter | 00:00:10.599 | 0.0% | 16931 | 0.455 | 0.626 | 0.915 |
| python filter | 00:00:00.000 | 0.0% | 0 | 0.000 | 0.000 | 0.000 |
| site send | 00:00:00.630 | 0.0% | 16830 | 0.000 | 0.037 | 0.150 |
| TOTAL: 24:00:24.217 | 24:00:21.263 | 100.0% | - | - | - | - |
INNfeed timer:
| Code region | Time | Pct | Invoked | Min(ms) | Avg(ms) | Max(ms) |
|---|---|---|---|---|---|---|
| article new | 00:00:00.033 | 0.0% | 16726 | 0.000 | 0.002 | 0.023 |
| article prepare | 00:00:00.005 | 0.0% | 133748 | 0.000 | 0.000 | 0.002 |
| article read | 00:00:00.745 | 0.0% | 16725 | 0.000 | 0.045 | 0.478 |
| backlog stats | 00:00:00.025 | 0.0% | 73368 | 0.000 | 0.000 | 0.003 |
| callbacks | 00:00:00.000 | 0.0% | 0 | 0.000 | 0.000 | 0.000 |
| data read | 00:00:00.344 | 0.0% | 51390 | 0.000 | 0.007 | 0.020 |
| data write | 00:00:00.684 | 0.0% | 34706 | 0.000 | 0.020 | 0.071 |
| idle | 23:59:23.058 | 100.0% | 73368 | 621.507 | 1177.122 | 3492.741 |
| status file | 00:00:00.075 | 0.0% | 224 | 0.000 | 0.335 | 2.000 |
| TOTAL: 23:59:25.988 | 23:59:24.969 | 100.0% | - | - | - | - |
nnrpd timer:
| Code region | Time | Pct | Invoked | Min(ms) | Avg(ms) | Max(ms) |
|---|---|---|---|---|---|---|
| idle | 00:00:09.818 | 41.6% | 3 | 77.500 | 3272.667 | 9663.000 |
| newnews | 00:00:00.000 | 0.0% | 0 | 0.000 | 0.000 | 0.000 |
| nntpwrite | 00:00:00.000 | 0.0% | 17 | 0.000 | 0.000 | 0.000 |
| TOTAL: 00:00:23.627 | 00:00:09.818 | 41.6% | - | - | - | - |
Control commands to INND:
| Command | Number |
|---|---|
| L | 1 |
| flush | 3 |
| flushlogs | 2 |
| go | 2 |
| logmode | 2 |
| mode | 149 |
| name | 2 |
| pause | 2 |
| paused | 2 |
| reload | 2 |
| reserve | 2 |
| TOTAL: 11 | 169 |
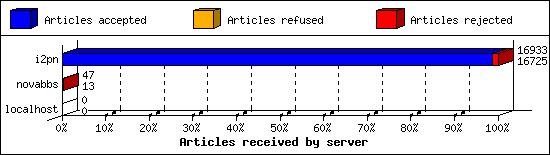
Incoming Feeds (INN):
| Server | Connects | Offered | Taken | Refused | Reject | %Accpt | Elapsed | |
|---|---|---|---|---|---|---|---|---|
| 1 | i2pn | 9 | 16933 | 16725 | 2 | 206 | 98% | 24:48:45 |
| 2 | novabbs | 17 | 47 | 13 | 32 | 2 | 27% | 04:33:27 |
| 3 | localhost | 34 | 0 | 0 | 0 | 0 | 0% | 00:00:00 |
| TOTAL: 3 | 60 | 16980 | 16738 | 34 | 208 | 98% | 29:22:12 | |
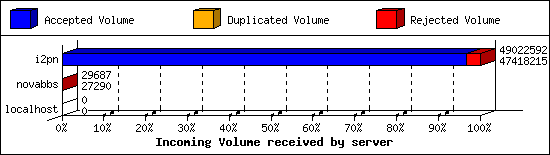
Incoming Volume (INN):
| Server | AcceptVol | DupVol | RejVol | TotalVol | %Acc | Vol/Art | |
|---|---|---|---|---|---|---|---|
| 1 | i2pn | 45.2 MB | 9.6 KB | 1.5 MB | 46.8 MB | 96% | 2.8 KB |
| 2 | novabbs | 26.7 KB | 0.0 KB | 2.3 KB | 29.0 KB | 91% | 1.9 KB |
| 3 | localhost | 0.0 KB | 0.0 KB | 0.0 KB | 0.0 KB | 0% | 0 |
| TOTAL: 3 | 45.2 MB | 9.6 KB | 1.5 MB | 46.8 MB | 96% | 2.8 KB | |
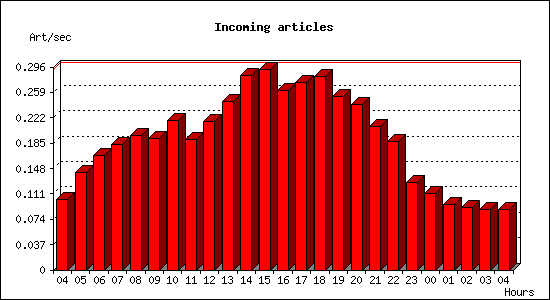
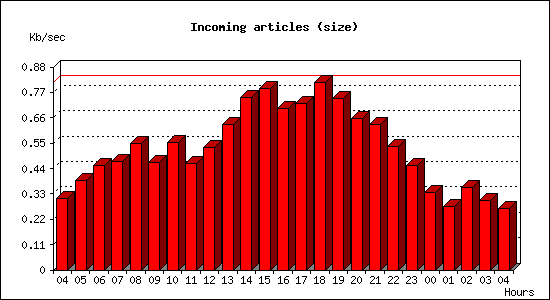
Incoming articles:
| Date | Articles | %Arts | Art/sec | Size | %Size | KB/sec |
|---|---|---|---|---|---|---|
| May 13 04:15:01 - 04:59:59 | 277 | 1.7% | 0.10 | 839.4 KB | 1.8% | 0.31 |
| May 13 05:00:00 - 05:59:59 | 514 | 3.1% | 0.14 | 1.4 MB | 3.0% | 0.39 |
| May 13 06:00:00 - 06:59:59 | 601 | 3.6% | 0.17 | 1.6 MB | 3.5% | 0.45 |
| May 13 07:00:00 - 07:59:59 | 661 | 4.0% | 0.18 | 1.7 MB | 3.6% | 0.47 |
| May 13 08:00:00 - 08:59:59 | 704 | 4.2% | 0.20 | 1.9 MB | 4.3% | 0.55 |
| May 13 09:00:00 - 09:59:59 | 691 | 4.1% | 0.19 | 1.6 MB | 3.6% | 0.47 |
| May 13 10:00:00 - 10:59:59 | 784 | 4.7% | 0.22 | 1.9 MB | 4.3% | 0.55 |
| May 13 11:00:00 - 11:59:59 | 686 | 4.1% | 0.19 | 1.6 MB | 3.6% | 0.46 |
| May 13 12:00:00 - 12:59:59 | 777 | 4.6% | 0.22 | 1.9 MB | 4.1% | 0.53 |
| May 13 13:00:00 - 13:59:59 | 886 | 5.3% | 0.25 | 2.2 MB | 4.9% | 0.63 |
| May 13 14:00:00 - 14:59:59 | 1021 | 6.1% | 0.28 | 2.6 MB | 5.8% | 0.75 |
| May 13 15:00:00 - 15:59:59 | 1054 | 6.3% | 0.29 | 2.8 MB | 6.1% | 0.78 |
| May 13 16:00:00 - 16:59:59 | 941 | 5.6% | 0.26 | 2.5 MB | 5.5% | 0.70 |
| May 13 17:00:00 - 17:59:59 | 986 | 5.9% | 0.27 | 2.5 MB | 5.6% | 0.72 |
| May 13 18:00:00 - 18:59:59 | 1016 | 6.1% | 0.28 | 2.9 MB | 6.3% | 0.81 |
| May 13 19:00:00 - 19:59:59 | 909 | 5.4% | 0.25 | 2.6 MB | 5.8% | 0.74 |
| May 13 20:00:00 - 20:59:59 | 867 | 5.2% | 0.24 | 2.3 MB | 5.1% | 0.66 |
| May 13 21:00:00 - 21:59:59 | 752 | 4.5% | 0.21 | 2.2 MB | 4.9% | 0.63 |
| May 13 22:00:00 - 22:59:59 | 674 | 4.0% | 0.19 | 1.9 MB | 4.2% | 0.53 |
| May 13 23:00:00 - 23:59:59 | 461 | 2.8% | 0.13 | 1.6 MB | 3.5% | 0.45 |
| May 14 00:00:00 - 00:59:59 | 404 | 2.4% | 0.11 | 1.2 MB | 2.6% | 0.34 |
| May 14 01:00:00 - 01:59:59 | 342 | 2.0% | 0.10 | 995.2 KB | 2.1% | 0.28 |
| May 14 02:00:00 - 02:59:59 | 329 | 2.0% | 0.09 | 1.3 MB | 2.8% | 0.36 |
| May 14 03:00:00 - 03:59:59 | 316 | 1.9% | 0.09 | 1.1 MB | 2.3% | 0.30 |
| May 14 04:00:00 - 04:15:01 | 79 | 0.5% | 0.09 | 240.8 KB | 0.5% | 0.27 |
| TOTAL: 24:00:00 | 16732 | 100.0% | 0.19 | 45.2 MB | 100.0% | 0.54 |
Sites sending bad articles:
| Server | Total | Group | Dist | Duplic | Unapp | TooOld | Site | Line | Other | |
|---|---|---|---|---|---|---|---|---|---|---|
| 1 | i2pn | 625 | 2 | 0 | 3 | 0 | 0 | 0 | 0 | 620 |
| 2 | novabbs | 2 | 2 | 0 | 0 | 0 | 0 | 0 | 0 | 0 |
| TOTAL: 2 | 627 | 4 | 0 | 3 | 0 | 0 | 0 | 0 | 620 | |
Unwanted newsgroups [Top 20]:
| Newsgroup | Count |
|---|---|
| rocksolid.shared.test2 | 2 |
| alt.pl.nieruchomosci.gielda | 1 |
| 24hoursupport.helpdesk | 1 |
| TOTAL: 3 | 4 |
INND Perl filter [Top 20]:
| Reason | Count |
|---|---|
| Scoring filter (s5) | 144 |
| Scoring filter (s6) | 52 |
| Scoring filter (n4) | 4 |
| Scoring filter (s1) | 1 |
| TOTAL: 4 | 201 |
NoCeM on Spool:
| Id | Good | Bad | Unique | Total |
|---|---|---|---|---|
| bleachbot@httrack.com | 74 | 0 | 80 | 80 |
| TOTAL: 1 | 74 | 32 | 80 | 80 |
Miscellaneous innd statistics [Top 10]:
| Event | Server | Number |
|---|---|---|
| Including strange strings | ||
| i2pn | 419 | |
| TOTAL: 1 | 419 | |
| TOTAL: 1 | 419 | |
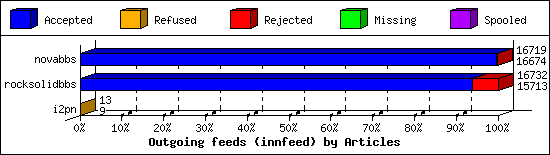
Outgoing Feeds (innfeed) by Articles:
| Server | Offered | Taken | Refused | Reject | Miss | Spool | %Took | Elapsed | |
|---|---|---|---|---|---|---|---|---|---|
| 1 | novabbs | 16728 | 16674 | 6 | 39 | 0 | 0 | 99% | 23:59:58 |
| 2 | rocksolidbbs | 16738 | 15713 | 5 | 1014 | 0 | 0 | 93% | 23:59:58 |
| 3 | i2pn | 16 | 9 | 4 | 0 | 0 | 0 | 56% | 01:37:01 |
| TOTAL: 3 | 33482 | 32396 | 15 | 1053 | 0 | 0 | 96% | 49:36:57 | |
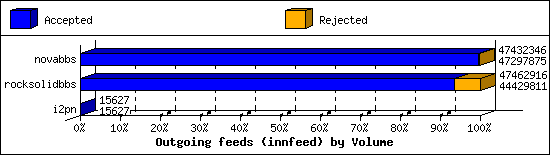
Outgoing Feeds (innfeed) by Volume:
| Server | AcceptVol | RejectVol | TotalVol | Volume/sec | Vol/Art | Elapsed | |
|---|---|---|---|---|---|---|---|
| 1 | novabbs | 45.1 MB | 131.3 KB | 45.2 MB | 0.5 KB/s | 2.8 KB | 23:59:58 |
| 2 | rocksolidbbs | 42.4 MB | 2.9 MB | 45.3 MB | 0.5 KB/s | 2.8 KB | 23:59:58 |
| 3 | i2pn | 15.3 KB | 0.0 KB | 15.3 KB | 0.0 KB/s | 1.7 KB | 01:37:01 |
| TOTAL: 3 | 87.5 MB | 3.0 MB | 90.5 MB | 0.5 KB/s | 2.8 KB | 49:36:57 | |
NNRP readership statistics:
| System | Conn | Arts | Size | Groups | Post | Rej | Elapsed | |
|---|---|---|---|---|---|---|---|---|
| 1 | 60.191.0.243 | 1 | 0 | 0.0 KB | 0 | 0 | 0 | 00:00:00 |
| 2 | scan-141.security.ipip.net | 1 | 0 | 0.0 KB | 0 | 0 | 0 | 00:00:02 |
| 3 | 162.243.139.8 | 1 | 0 | 0.0 KB | 0 | 0 | 0 | 00:00:09 |
| 4 | 185.100.87.248 | 1 | 0 | 0.0 KB | 0 | 0 | 0 | 00:00:00 |
| TOTAL: 4 | 4 | 0 | 0.0 KB | 0 | 0 | 0 | 00:00:23 | |
NNRP readership statistics (by domain):
| System | Conn | Arts | Size | Groups | Post | Rej | Elapsed | |
|---|---|---|---|---|---|---|---|---|
| 1 | *.security.ipip.net | 1 | 0 | 0.0 KB | 0 | 0 | 0 | 00:00:02 |
| 2 | unresolved | 3 | 0 | 0.0 KB | 0 | 0 | 0 | 00:00:10 |
| TOTAL: 2 | 4 | 0 | 0.0 KB | 0 | 0 | 0 | 00:00:23 | |
NNRP total resource statistics [Top 20]:
| System | User(ms) | System(ms) | Idle(ms) | Elapsed |
|---|---|---|---|---|
| ? | 0.080 | 0.028 | 0.000 | 00:00:11 |
| 162.243.139.8 | 0.044 | 0.000 | 0.000 | 00:00:09 |
| scan-141.security.ipip.net | 0.052 | 0.016 | 0.000 | 00:00:02 |
| 185.100.87.248 | 0.056 | 0.000 | 0.000 | 00:00:00 |
| TOTAL: 4 | 0.232 | 0.044 | 0.000 | 00:00:23 |
NNRP unrecognized commands (by host):
| System | Conn |
|---|---|
| scan-141.security.ipip.net | 4 |
| 60.191.0.243 | 1 |
| TOTAL: 2 | 5 |
NNRP unrecognized commands (by command):
| Command | Count |
|---|---|
| GET / HTTP/1.1 | 1 |
| GET / HTTP/1.0 | 1 |
| Connection: close | 1 |
| User-Agent: HTTP Banner Detection (https... | 1 |
| Host: 157.230.63.40:119 | 1 |
| TOTAL: 5 | 5 |
