Log entries by program:
| Program name | Lines | %Lines | Size | %Size |
|---|---|---|---|---|
| inn | 17479 | 63.5% | 1.6 MB | 57.6% |
| innfeed | 8441 | 30.7% | 1010.5 KB | 34.6% |
| innd | 1452 | 5.3% | 210.3 KB | 7.2% |
| nocem | 123 | 0.4% | 14.5 KB | 0.5% |
| nnrpd | 10 | 0.0% | 1.0 KB | 0.0% |
| controlchan | 1 | 0.0% | 0.0 KB | 0.0% |
| TOTAL: 6 | 27506 | 100.0% | 2.9 MB | 100.0% |
History cache:
| Reason | Count | %Count |
|---|---|---|
| Do not exist | 16958 | 96.9% |
| Negative hits | 329 | 1.9% |
| Positive hits | 200 | 1.1% |
| Cache misses | 16 | 0.1% |
| TOTAL: 4 | 17503 | 100.0% |
INND timer:
| Code region | Time | Pct | Invoked | Min(ms) | Avg(ms) | Max(ms) |
|---|---|---|---|---|---|---|
| article cancel | 00:00:00.037 | 0.0% | 214 | 0.000 | 0.173 | 1.429 |
| article cleanup | 00:00:00.081 | 0.0% | 16978 | 0.000 | 0.005 | 0.030 |
| article logging | 00:00:00.512 | 0.0% | 17338 | 0.000 | 0.030 | 0.077 |
| article parse | 00:00:00.251 | 0.0% | 19173 | 0.000 | 0.013 | 0.049 |
| article write | 00:00:04.151 | 0.0% | 16777 | 0.078 | 0.247 | 1.115 |
| artlog/artcncl | 00:00:00.002 | 0.0% | 140 | 0.000 | 0.014 | 0.500 |
| artlog/artwrite | 00:00:00.000 | 0.0% | 0 | 0.000 | 0.000 | 0.000 |
| data move | 00:00:00.009 | 0.0% | 21597 | 0.000 | 0.000 | 0.010 |
| hisgrep/artcncl | 00:00:00.002 | 0.0% | 197 | 0.000 | 0.010 | 0.333 |
| hishave/artcncl | 00:00:00.000 | 0.0% | 214 | 0.000 | 0.000 | 0.000 |
| history grep | 00:00:00.000 | 0.0% | 0 | 0.000 | 0.000 | 0.000 |
| history lookup | 00:00:00.077 | 0.0% | 17349 | 0.000 | 0.004 | 0.034 |
| history sync | 00:00:00.027 | 0.0% | 316 | 0.000 | 0.085 | 1.000 |
| history write | 00:00:01.220 | 0.0% | 16978 | 0.000 | 0.072 | 0.711 |
| hiswrite/artcncl | 00:00:00.000 | 0.0% | 17 | 0.000 | 0.000 | 0.000 |
| idle | 24:00:00.052 | 100.0% | 20038 | 2289.748 | 4311.810 | 11113.296 |
| nntp read | 00:00:00.538 | 0.0% | 19776 | 0.000 | 0.027 | 0.072 |
| overview write | 00:00:03.011 | 0.0% | 16777 | 0.022 | 0.179 | 2.449 |
| perl filter | 00:00:10.775 | 0.0% | 16978 | 0.464 | 0.635 | 1.258 |
| python filter | 00:00:00.000 | 0.0% | 0 | 0.000 | 0.000 | 0.000 |
| site send | 00:00:00.593 | 0.0% | 16893 | 0.000 | 0.035 | 0.113 |
| TOTAL: 24:00:24.311 | 24:00:21.338 | 100.0% | - | - | - | - |
INNfeed timer:
| Code region | Time | Pct | Invoked | Min(ms) | Avg(ms) | Max(ms) |
|---|---|---|---|---|---|---|
| article new | 00:00:00.054 | 0.0% | 51964 | 0.000 | 0.001 | 0.018 |
| article prepare | 00:00:00.013 | 0.0% | 130738 | 0.000 | 0.000 | 0.003 |
| article read | 00:00:00.798 | 0.0% | 18651 | 0.000 | 0.043 | 1.000 |
| backlog stats | 00:00:00.037 | 0.0% | 108675 | 0.000 | 0.000 | 0.007 |
| callbacks | 00:00:00.000 | 0.0% | 5 | 0.000 | 0.000 | 0.000 |
| data read | 00:00:00.418 | 0.0% | 68954 | 0.000 | 0.006 | 0.020 |
| data write | 00:00:00.889 | 0.0% | 51062 | 0.000 | 0.017 | 0.045 |
| idle | 23:58:47.993 | 100.0% | 108675 | 101.495 | 794.368 | 2728.781 |
| prepart/cb | 00:00:00.000 | 0.0% | 8 | 0.000 | 0.000 | 0.000 |
| readart/cb | 00:00:00.000 | 0.0% | 2 | 0.000 | 0.000 | 0.000 |
| status file | 00:00:01.691 | 0.0% | 3551 | 0.000 | 0.476 | 9.000 |
| TOTAL: 23:58:53.739 | 23:58:51.893 | 100.0% | - | - | - | - |
nnrpd timer:
| Code region | Time | Pct | Invoked | Min(ms) | Avg(ms) | Max(ms) |
|---|---|---|---|---|---|---|
| idle | 00:30:00.237 | 100.0% | 4 | 82.500 | 450059.250 | 900036.000 |
| newnews | 00:00:00.000 | 0.0% | 0 | 0.000 | 0.000 | 0.000 |
| nntpwrite | 00:00:00.001 | 0.0% | 16 | 0.000 | 0.062 | 0.200 |
| TOTAL: 00:30:00.721 | 00:30:00.238 | 100.0% | - | - | - | - |
Control commands to INND:
| Command | Number |
|---|---|
| L | 1 |
| flush | 3 |
| flushlogs | 2 |
| go | 2 |
| logmode | 2 |
| mode | 149 |
| name | 2 |
| pause | 2 |
| paused | 2 |
| reload | 2 |
| reserve | 2 |
| TOTAL: 11 | 169 |
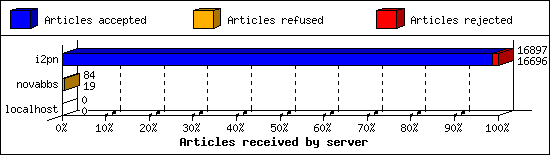
Incoming Feeds (INN):
| Server | Connects | Offered | Taken | Refused | Reject | %Accpt | Elapsed | |
|---|---|---|---|---|---|---|---|---|
| 1 | i2pn | 5 | 16897 | 16696 | 0 | 201 | 98% | 24:14:59 |
| 2 | novabbs | 30 | 84 | 19 | 65 | 0 | 22% | 06:18:18 |
| 3 | localhost | 32 | 0 | 0 | 0 | 0 | 0% | 00:00:00 |
| TOTAL: 3 | 67 | 16981 | 16715 | 65 | 201 | 98% | 30:33:17 | |
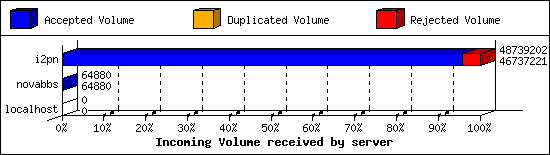
Incoming Volume (INN):
| Server | AcceptVol | DupVol | RejVol | TotalVol | %Acc | Vol/Art | |
|---|---|---|---|---|---|---|---|
| 1 | i2pn | 44.6 MB | 0.0 KB | 1.9 MB | 46.5 MB | 95% | 2.8 KB |
| 2 | novabbs | 63.4 KB | 0.0 KB | 0.0 KB | 63.4 KB | 100% | 3.3 KB |
| 3 | localhost | 0.0 KB | 0.0 KB | 0.0 KB | 0.0 KB | 0% | 0 |
| TOTAL: 3 | 44.6 MB | 0.0 KB | 1.9 MB | 46.5 MB | 95% | 2.8 KB | |
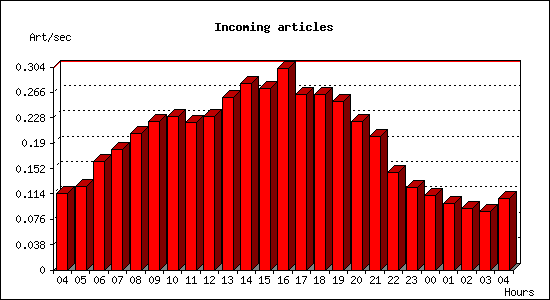
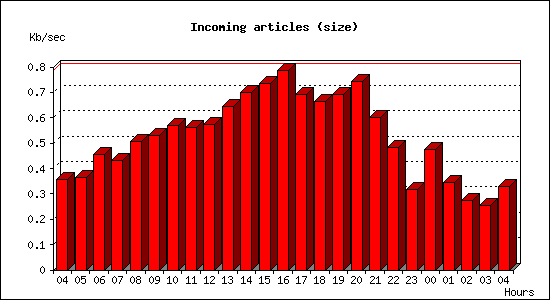
Incoming articles:
| Date | Articles | %Arts | Art/sec | Size | %Size | KB/sec |
|---|---|---|---|---|---|---|
| May 14 04:15:01 - 04:59:59 | 308 | 1.8% | 0.11 | 958.9 KB | 2.1% | 0.36 |
| May 14 05:00:00 - 05:59:59 | 452 | 2.7% | 0.13 | 1.3 MB | 2.9% | 0.37 |
| May 14 06:00:00 - 06:59:59 | 586 | 3.5% | 0.16 | 1.6 MB | 3.6% | 0.46 |
| May 14 07:00:00 - 07:59:59 | 649 | 3.9% | 0.18 | 1.5 MB | 3.4% | 0.43 |
| May 14 08:00:00 - 08:59:59 | 737 | 4.4% | 0.20 | 1.8 MB | 4.0% | 0.51 |
| May 14 09:00:00 - 09:59:59 | 798 | 4.8% | 0.22 | 1.9 MB | 4.2% | 0.53 |
| May 14 10:00:00 - 10:59:59 | 828 | 4.9% | 0.23 | 2.0 MB | 4.5% | 0.57 |
| May 14 11:00:00 - 11:59:59 | 794 | 4.7% | 0.22 | 2.0 MB | 4.4% | 0.56 |
| May 14 12:00:00 - 12:59:59 | 829 | 4.9% | 0.23 | 2.0 MB | 4.5% | 0.57 |
| May 14 13:00:00 - 13:59:59 | 929 | 5.5% | 0.26 | 2.3 MB | 5.0% | 0.64 |
| May 14 14:00:00 - 14:59:59 | 1006 | 6.0% | 0.28 | 2.5 MB | 5.5% | 0.70 |
| May 14 15:00:00 - 15:59:59 | 978 | 5.8% | 0.27 | 2.6 MB | 5.8% | 0.74 |
| May 14 16:00:00 - 16:59:59 | 1089 | 6.5% | 0.30 | 2.8 MB | 6.2% | 0.79 |
| May 14 17:00:00 - 17:59:59 | 947 | 5.6% | 0.26 | 2.4 MB | 5.4% | 0.69 |
| May 14 18:00:00 - 18:59:59 | 946 | 5.6% | 0.26 | 2.3 MB | 5.2% | 0.66 |
| May 14 19:00:00 - 19:59:59 | 906 | 5.4% | 0.25 | 2.4 MB | 5.4% | 0.69 |
| May 14 20:00:00 - 20:59:59 | 800 | 4.8% | 0.22 | 2.6 MB | 5.8% | 0.74 |
| May 14 21:00:00 - 21:59:59 | 720 | 4.3% | 0.20 | 2.1 MB | 4.7% | 0.60 |
| May 14 22:00:00 - 22:59:59 | 528 | 3.1% | 0.15 | 1.7 MB | 3.8% | 0.48 |
| May 14 23:00:00 - 23:59:59 | 446 | 2.7% | 0.12 | 1.1 MB | 2.5% | 0.32 |
| May 15 00:00:00 - 00:59:59 | 404 | 2.4% | 0.11 | 1.7 MB | 3.7% | 0.48 |
| May 15 01:00:00 - 01:59:59 | 360 | 2.1% | 0.10 | 1.2 MB | 2.7% | 0.35 |
| May 15 02:00:00 - 02:59:59 | 329 | 2.0% | 0.09 | 992.1 KB | 2.2% | 0.28 |
| May 15 03:00:00 - 03:59:59 | 313 | 1.9% | 0.09 | 909.9 KB | 2.0% | 0.25 |
| May 15 04:00:00 - 04:15:01 | 96 | 0.6% | 0.11 | 295.6 KB | 0.6% | 0.33 |
| TOTAL: 24:00:00 | 16778 | 100.0% | 0.19 | 44.8 MB | 100.0% | 0.53 |
Sites sending bad articles:
| Server | Total | Group | Dist | Duplic | Unapp | TooOld | Site | Line | Other | |
|---|---|---|---|---|---|---|---|---|---|---|
| 1 | i2pn | 561 | 0 | 0 | 0 | 0 | 0 | 0 | 0 | 561 |
| TOTAL: 1 | 561 | 0 | 0 | 0 | 0 | 0 | 0 | 0 | 561 | |
INND Perl filter [Top 20]:
| Reason | Count |
|---|---|
| Scoring filter (s5) | 132 |
| Scoring filter (s6) | 53 |
| Scoring filter (s7) | 14 |
| Scoring filter (n4) | 2 |
| TOTAL: 4 | 201 |
NoCeM on Spool:
| Id | Good | Bad | Unique | Total |
|---|---|---|---|---|
| bleachbot@httrack.com | 97 | 0 | 100 | 100 |
| TOTAL: 1 | 97 | 19 | 100 | 100 |
Miscellaneous innd statistics [Top 10]:
| Event | Server | Number |
|---|---|---|
| Including strange strings | ||
| i2pn | 360 | |
| TOTAL: 1 | 360 | |
| TOTAL: 1 | 360 | |
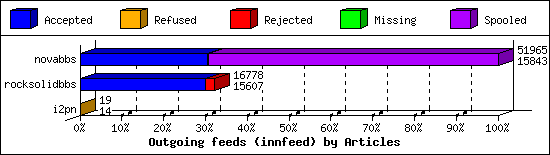
Outgoing Feeds (innfeed) by Articles:
| Server | Offered | Taken | Refused | Reject | Miss | Spool | %Took | Elapsed | |
|---|---|---|---|---|---|---|---|---|---|
| 1 | novabbs | 56723 | 15843 | 56 | 89 | 9 | 35968 | 27% | 23:59:45 |
| 2 | rocksolidbbs | 16790 | 15607 | 32 | 1139 | 0 | 0 | 92% | 23:59:58 |
| 3 | i2pn | 19 | 14 | 5 | 0 | 0 | 0 | 73% | 01:48:19 |
| TOTAL: 3 | 73532 | 31464 | 93 | 1228 | 9 | 35968 | 42% | 49:48:02 | |
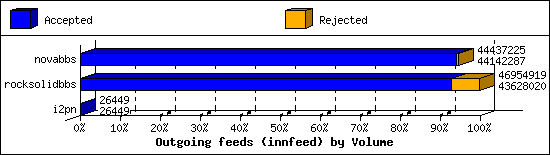
Outgoing Feeds (innfeed) by Volume:
| Server | AcceptVol | RejectVol | TotalVol | Volume/sec | Vol/Art | Elapsed | |
|---|---|---|---|---|---|---|---|
| 1 | novabbs | 42.1 MB | 288.0 KB | 42.4 MB | 0.5 KB/s | 2.7 KB | 23:59:45 |
| 2 | rocksolidbbs | 41.6 MB | 3.2 MB | 44.8 MB | 0.5 KB/s | 2.7 KB | 23:59:58 |
| 3 | i2pn | 25.8 KB | 0.0 KB | 25.8 KB | 0.0 KB/s | 1.8 KB | 01:48:19 |
| TOTAL: 3 | 83.7 MB | 3.5 MB | 87.2 MB | 0.5 KB/s | 2.7 KB | 49:48:02 | |
NNRP readership statistics:
| System | Conn | Arts | Size | Groups | Post | Rej | Elapsed | |
|---|---|---|---|---|---|---|---|---|
| 1 | scan-141.security.ipip.net | 1 | 0 | 0.0 KB | 0 | 0 | 0 | 00:00:00 |
| TOTAL: 1 | 1 | 0 | 0.0 KB | 0 | 0 | 0 | 00:30:00 | |
NNRP readership statistics (by domain):
| System | Conn | Arts | Size | Groups | Post | Rej | Elapsed | |
|---|---|---|---|---|---|---|---|---|
| 1 | *.security.ipip.net | 1 | 0 | 0.0 KB | 0 | 0 | 0 | 00:00:00 |
| TOTAL: 1 | 1 | 0 | 0.0 KB | 0 | 0 | 0 | 00:30:00 | |
NNRP total resource statistics [Top 20]:
| System | User(ms) | System(ms) | Idle(ms) | Elapsed |
|---|---|---|---|---|
| 60.191.0.243 | 0.044 | 0.000 | 0.000 | 00:30:00 |
| scan-141.security.ipip.net | 0.040 | 0.004 | 0.000 | 00:00:00 |
| TOTAL: 2 | 0.084 | 0.004 | 0.000 | 00:30:00 |
NNRP unrecognized commands (by host):
| System | Conn |
|---|---|
| scan-141.security.ipip.net | 4 |
| TOTAL: 1 | 4 |
NNRP unrecognized commands (by command):
| Command | Count |
|---|---|
| Connection: close | 1 |
| User-Agent: HTTP Banner Detection (https... | 1 |
| GET / HTTP/1.1 | 1 |
| Host: 157.230.63.40:119 | 1 |
| TOTAL: 4 | 4 |
NNRP client timeouts [Top 20]:
| System | Conn | Peer |
|---|---|---|
| 60.191.0.243 | 1 | 0 |
| TOTAL: 1 | 1 | 0 |
