
Log entries by program:
| Program name | Lines | %Lines | Size | %Size |
|---|---|---|---|---|
| inn | 17148 | 57.7% | 1.4 MB | 49.6% |
| innfeed | 10831 | 36.5% | 1.2 MB | 42.1% |
| innd | 1535 | 5.2% | 224.0 KB | 7.5% |
| nocem | 96 | 0.3% | 12.3 KB | 0.4% |
| nnrpd | 90 | 0.3% | 9.8 KB | 0.3% |
| controlchan | 3 | 0.0% | 0.2 KB | 0.0% |
| TOTAL: 6 | 29703 | 100.0% | 2.9 MB | 100.0% |
History cache:
| Reason | Count | %Count |
|---|---|---|
| Do not exist | 16529 | 91.7% |
| Negative hits | 1104 | 6.1% |
| Positive hits | 357 | 2.0% |
| Cache misses | 29 | 0.2% |
| TOTAL: 4 | 18019 | 100.0% |
INND timer:
| Code region | Time | Pct | Invoked | Min(ms) | Avg(ms) | Max(ms) |
|---|---|---|---|---|---|---|
| article cancel | 00:00:00.097 | 0.0% | 181 | 0.000 | 0.536 | 22.000 |
| article cleanup | 00:00:00.103 | 0.0% | 16544 | 0.000 | 0.006 | 0.045 |
| article logging | 00:00:00.550 | 0.0% | 16918 | 0.000 | 0.033 | 0.088 |
| article parse | 00:00:00.218 | 0.0% | 18565 | 0.000 | 0.012 | 0.040 |
| article write | 00:00:04.306 | 0.0% | 16256 | 0.085 | 0.265 | 3.167 |
| artlog/artcncl | 00:00:00.000 | 0.0% | 109 | 0.000 | 0.000 | 0.000 |
| artlog/artwrite | 00:00:00.000 | 0.0% | 0 | 0.000 | 0.000 | 0.000 |
| data move | 00:00:00.006 | 0.0% | 21610 | 0.000 | 0.000 | 0.019 |
| hisgrep/artcncl | 00:00:00.007 | 0.0% | 170 | 0.000 | 0.041 | 0.625 |
| hishave/artcncl | 00:00:00.003 | 0.0% | 181 | 0.000 | 0.017 | 0.250 |
| history grep | 00:00:00.000 | 0.0% | 0 | 0.000 | 0.000 | 0.000 |
| history lookup | 00:00:00.141 | 0.0% | 17895 | 0.000 | 0.008 | 0.270 |
| history sync | 00:00:00.016 | 0.0% | 388 | 0.000 | 0.041 | 0.500 |
| history write | 00:00:02.772 | 0.0% | 16544 | 0.000 | 0.168 | 1.444 |
| hiswrite/artcncl | 00:00:00.001 | 0.0% | 11 | 0.000 | 0.091 | 1.000 |
| idle | 23:50:34.999 | 100.0% | 20378 | 1991.934 | 4212.140 | 14636.098 |
| nntp read | 00:00:00.557 | 0.0% | 20051 | 0.000 | 0.028 | 0.094 |
| overview write | 00:00:03.376 | 0.0% | 16256 | 0.036 | 0.208 | 1.787 |
| perl filter | 00:00:10.626 | 0.0% | 16544 | 0.494 | 0.642 | 0.942 |
| python filter | 00:00:00.000 | 0.0% | 0 | 0.000 | 0.000 | 0.000 |
| site send | 00:00:00.537 | 0.0% | 15879 | 0.000 | 0.034 | 0.086 |
| TOTAL: 23:51:01.558 | 23:50:58.315 | 100.0% | - | - | - | - |
INNfeed timer:
| Code region | Time | Pct | Invoked | Min(ms) | Avg(ms) | Max(ms) |
|---|---|---|---|---|---|---|
| article new | 00:00:00.046 | 0.0% | 38608 | 0.000 | 0.001 | 0.016 |
| article prepare | 00:00:00.002 | 0.0% | 14248 | 0.000 | 0.000 | 0.003 |
| article read | 00:00:00.261 | 0.0% | 3560 | 0.000 | 0.073 | 33.000 |
| backlog stats | 00:00:00.028 | 0.0% | 77177 | 0.000 | 0.000 | 0.007 |
| callbacks | 00:00:00.000 | 0.0% | 0 | 0.000 | 0.000 | 0.000 |
| data read | 00:00:00.277 | 0.0% | 44774 | 0.000 | 0.006 | 0.024 |
| data write | 00:00:00.405 | 0.0% | 28996 | 0.000 | 0.014 | 0.500 |
| idle | 23:47:19.041 | 100.0% | 77177 | 38.729 | 1109.645 | 22281.852 |
| status file | 00:00:03.505 | 0.0% | 4481 | 0.000 | 0.782 | 8.667 |
| TOTAL: 23:47:24.738 | 23:47:23.565 | 100.0% | - | - | - | - |
nnrpd timer:
| Code region | Time | Pct | Invoked | Min(ms) | Avg(ms) | Max(ms) |
|---|---|---|---|---|---|---|
| idle | 00:00:10.075 | 0.2% | 5 | 11.500 | 2015.000 | 9815.000 |
| newnews | 00:00:00.000 | 0.0% | 0 | 0.000 | 0.000 | 0.000 |
| nntpwrite | 00:00:01.492 | 0.0% | 42653 | 0.000 | 0.035 | 5.222 |
| readart | 00:00:00.003 | 0.0% | 7 | 0.000 | 0.429 | 1.000 |
| TOTAL: 01:28:14.299 | 00:00:11.570 | 0.2% | - | - | - | - |
Control commands to INND:
| Command | Number |
|---|---|
| L | 1 |
| flush | 3 |
| flushlogs | 2 |
| go | 2 |
| logmode | 2 |
| mode | 149 |
| name | 2 |
| pause | 2 |
| paused | 2 |
| reload | 4 |
| reserve | 2 |
| shutdown | 6 |
| TOTAL: 12 | 177 |
Incoming Feeds (INN):
| Server | Connects | Offered | Taken | Refused | Reject | %Accpt | Elapsed | |
|---|---|---|---|---|---|---|---|---|
| 1 | i2pn | 24 | 16662 | 16370 | 4 | 288 | 98% | 25:51:59 |
| 2 | localhost | 36 | 4 | 4 | 0 | 0 | 100% | 00:00:00 |
| 3 | novabbs | 3 | 271 | 2 | 269 | 0 | 0% | 07:10:02 |
| TOTAL: 3 | 63 | 16937 | 16376 | 273 | 288 | 96% | 33:02:01 | |
Incoming Volume (INN):
| Server | AcceptVol | DupVol | RejVol | TotalVol | %Acc | Vol/Art | |
|---|---|---|---|---|---|---|---|
| 1 | i2pn | 43.1 MB | 0.0 KB | 2.3 MB | 45.4 MB | 95% | 2.8 KB |
| 2 | localhost | 3.5 KB | 0.0 KB | 0.0 KB | 3.5 KB | 100% | 0.9 KB |
| 3 | novabbs | 2.4 KB | 0.0 KB | 0.0 KB | 2.4 KB | 100% | 1.2 KB |
| TOTAL: 3 | 43.2 MB | 0.0 KB | 2.3 MB | 45.4 MB | 95% | 2.8 KB | |

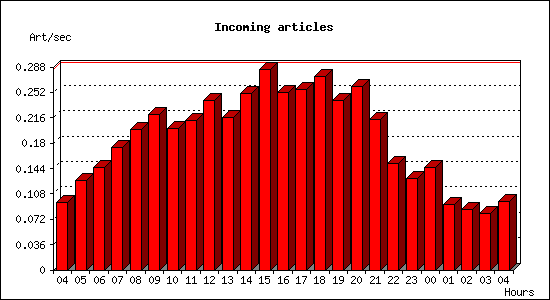
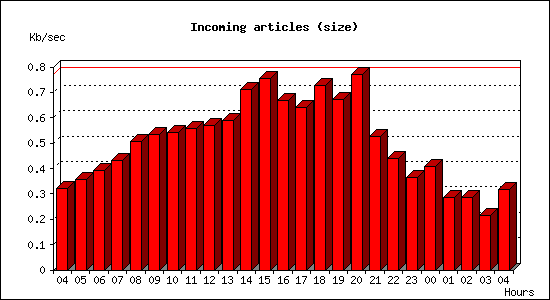
Incoming articles:
| Date | Articles | %Arts | Art/sec | Size | %Size | KB/sec |
|---|---|---|---|---|---|---|
| May 16 04:15:01 - 04:59:59 | 257 | 1.6% | 0.10 | 864.7 KB | 2.0% | 0.32 |
| May 16 05:00:00 - 05:59:59 | 456 | 2.8% | 0.13 | 1.3 MB | 2.9% | 0.36 |
| May 16 06:00:00 - 06:59:59 | 522 | 3.2% | 0.14 | 1.4 MB | 3.2% | 0.39 |
| May 16 07:00:00 - 07:59:59 | 627 | 3.8% | 0.17 | 1.5 MB | 3.5% | 0.43 |
| May 16 08:00:00 - 08:59:59 | 716 | 4.4% | 0.20 | 1.8 MB | 4.1% | 0.51 |
| May 16 09:00:00 - 09:59:59 | 795 | 4.9% | 0.22 | 1.9 MB | 4.4% | 0.54 |
| May 16 10:00:00 - 10:59:59 | 722 | 4.4% | 0.20 | 1.9 MB | 4.4% | 0.54 |
| May 16 11:00:00 - 11:59:59 | 766 | 4.7% | 0.21 | 2.0 MB | 4.5% | 0.56 |
| May 16 12:00:00 - 12:59:59 | 864 | 5.3% | 0.24 | 2.0 MB | 4.7% | 0.57 |
| May 16 13:00:00 - 13:59:59 | 781 | 4.8% | 0.22 | 2.1 MB | 4.8% | 0.59 |
| May 16 14:00:00 - 14:59:59 | 903 | 5.5% | 0.25 | 2.5 MB | 5.8% | 0.71 |
| May 16 15:00:00 - 15:59:59 | 1024 | 6.3% | 0.28 | 2.7 MB | 6.1% | 0.75 |
| May 16 16:00:00 - 16:59:59 | 905 | 5.5% | 0.25 | 2.3 MB | 5.4% | 0.67 |
| May 16 17:00:00 - 17:59:59 | 924 | 5.6% | 0.26 | 2.2 MB | 5.2% | 0.64 |
| May 16 18:00:00 - 18:59:59 | 987 | 6.0% | 0.27 | 2.6 MB | 5.9% | 0.73 |
| May 16 19:00:00 - 19:59:59 | 865 | 5.3% | 0.24 | 2.4 MB | 5.5% | 0.67 |
| May 16 20:00:00 - 20:59:59 | 939 | 5.7% | 0.26 | 2.7 MB | 6.3% | 0.77 |
| May 16 21:00:00 - 21:59:59 | 767 | 4.7% | 0.21 | 1.8 MB | 4.3% | 0.53 |
| May 16 22:00:00 - 22:59:59 | 546 | 3.3% | 0.15 | 1.5 MB | 3.6% | 0.44 |
| May 16 23:00:00 - 23:59:59 | 469 | 2.9% | 0.13 | 1.3 MB | 3.0% | 0.36 |
| May 17 00:00:00 - 00:59:59 | 522 | 3.2% | 0.14 | 1.4 MB | 3.3% | 0.41 |
| May 17 01:00:00 - 01:59:59 | 335 | 2.0% | 0.09 | 1.0 MB | 2.3% | 0.29 |
| May 17 02:00:00 - 02:59:59 | 309 | 1.9% | 0.09 | 1.0 MB | 2.3% | 0.29 |
| May 17 03:00:00 - 03:59:59 | 287 | 1.8% | 0.08 | 778.6 KB | 1.8% | 0.22 |
| May 17 04:00:00 - 04:15:01 | 87 | 0.5% | 0.10 | 284.8 KB | 0.6% | 0.32 |
| TOTAL: 24:00:00 | 16375 | 100.0% | 0.19 | 43.2 MB | 100.0% | 0.51 |
Sites sending bad articles:
| Server | Total | Group | Dist | Duplic | Unapp | TooOld | Site | Line | Other | |
|---|---|---|---|---|---|---|---|---|---|---|
| 1 | i2pn | 667 | 2 | 0 | 0 | 0 | 0 | 0 | 0 | 665 |
| TOTAL: 1 | 667 | 2 | 0 | 0 | 0 | 0 | 0 | 0 | 665 | |
Unwanted newsgroups [Top 20]:
| Newsgroup | Count |
|---|---|
| hk.politics | 1 |
| fa.linux.kernel | 1 |
| TOTAL: 2 | 2 |
INND Perl filter [Top 20]:
| Reason | Count |
|---|---|
| Scoring filter (s5) | 204 |
| Scoring filter (s6) | 35 |
| Scoring filter (sit1b) | 32 |
| Scoring filter (n11) | 9 |
| Scoring filter (n6) | 4 |
| Scoring filter (n4) | 2 |
| TOTAL: 6 | 286 |
NoCeM on Spool:
| Id | Good | Bad | Unique | Total |
|---|---|---|---|---|
| bleachbot@httrack.com | 79 | 0 | 84 | 84 |
| TOTAL: 1 | 79 | 9 | 84 | 84 |
Miscellaneous innd statistics [Top 10]:
| Event | Server | Number |
|---|---|---|
| Including strange strings | ||
| i2pn | 379 | |
| TOTAL: 1 | 379 | |
| TOTAL: 1 | 379 | |
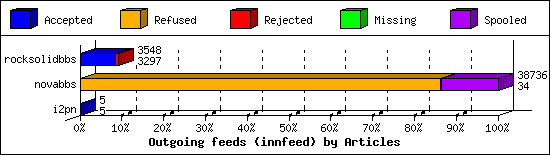
Outgoing Feeds (innfeed) by Articles:
| Server | Offered | Taken | Refused | Reject | Miss | Spool | %Took | Elapsed | |
|---|---|---|---|---|---|---|---|---|---|
| 1 | rocksolidbbs | 3551 | 3297 | 0 | 251 | 0 | 0 | 92% | 05:56:47 |
| 2 | novabbs | 34944 | 34 | 33373 | 48 | 0 | 5281 | 0% | 23:18:57 |
| 3 | i2pn | 5 | 5 | 0 | 0 | 0 | 0 | 100% | 01:12:26 |
| TOTAL: 3 | 38500 | 3336 | 33373 | 299 | 0 | 5281 | 8% | 30:28:10 | |
Outgoing Feeds (innfeed) by Volume:
| Server | AcceptVol | RejectVol | TotalVol | Volume/sec | Vol/Art | Elapsed | |
|---|---|---|---|---|---|---|---|
| 1 | rocksolidbbs | 8.5 MB | 670.6 KB | 9.2 MB | 0.4 KB/s | 2.7 KB | 05:56:47 |
| 2 | novabbs | 290.7 KB | 139.0 KB | 429.7 KB | 0.0 KB/s | 5.2 KB | 23:18:57 |
| 3 | i2pn | 4.3 KB | 0.0 KB | 4.3 KB | 0.0 KB/s | 0.9 KB | 01:12:26 |
| TOTAL: 3 | 8.8 MB | 809.6 KB | 9.6 MB | 0.1 KB/s | 2.7 KB | 30:28:10 | |

NNRP readership statistics:
| System | Conn | Arts | Size | Groups | Post | Rej | Elapsed | |
|---|---|---|---|---|---|---|---|---|
| 1 | ip68-2-45-86.ph.ph.cox.net | 7 | 7 | 7.2 KB | 7 | 4 | 3 | 01:28:03 |
| TOTAL: 1 | 7 | 7 | 7.2 KB | 7 | 4 | 3 | 01:28:14 | |
NNRP readership statistics (by domain):
| System | Conn | Arts | Size | Groups | Post | Rej | Elapsed | |
|---|---|---|---|---|---|---|---|---|
| 1 | unresolved | 2 | 0 | 0.0 KB | 0 | 0 | 0 | 00:00:10 |
| 2 | *.sfj.corp.censys.io | 1 | 0 | 0.0 KB | 0 | 0 | 0 | 00:00:00 |
| TOTAL: 2 | 3 | 7 | 7.2 KB | 7 | 4 | 3 | 00:00:10 | |
NNRP auth users [Top 20]:
| User | Conn |
|---|---|
| Retro Guy | 3 |
| TOTAL: 1 | 3 |
NNRP total resource statistics [Top 20]:
| System | User(ms) | System(ms) | Idle(ms) | Elapsed |
|---|---|---|---|---|
| ip68-2-45-86.ph.ph.cox.net | 0.584 | 0.100 | 0.523 | 01:28:03 |
| 107.170.238.234 | 0.064 | 0.004 | 0.000 | 00:00:09 |
| 122.228.19.79 | 0.044 | 0.008 | 0.000 | 00:00:00 |
| worker-18.sfj.corp.censys.io | 0.044 | 0.004 | 0.000 | 00:00:00 |
| TOTAL: 4 | 0.736 | 0.116 | 0.523 | 01:28:14 |
Curious NNRP server explorers [Top 20]:
| System | Conn |
|---|---|
| worker-18.sfj.corp.censys.io | 1 |
| 107.170.238.234 | 1 |
| 122.228.19.79 | 1 |
| TOTAL: 3 | 3 |
NNRP no permission clients:
| System | Conn |
|---|---|
| ip68-2-45-86.ph.ph.cox.net | 1 |
| TOTAL: 1 | 1 |
NNRP unrecognized commands (by host):
| System | Conn |
|---|---|
| 122.228.19.79 | 5 |
| TOTAL: 1 | 5 |
NNRP unrecognized commands (by command):
| Command | Count |
|---|---|
| Host: 157.230.63.40:119 | 1 |
| Accept: */* | 1 |
| User-Agent: Mozilla/5.0 (Macintosh; Inte... | 1 |
| GET / HTTP/1.1 | 1 |
| Connection: keep-alive | 1 |
| TOTAL: 5 | 5 |
NNRP client timeouts [Top 20]:
| System | Conn | Peer |
|---|---|---|
| worker-18.sfj.corp.censys.io | 1 | 1 |
| TOTAL: 1 | 1 | 1 |
Newsgroup request counts (by category):
| Category | Count | Pct | |
|---|---|---|---|
| 1 | alt | 5 | 71.4% |
| 2 | rocksolid | 2 | 28.6% |
| TOTAL: 2 | 7 | 100.0% | |
Newsgroup request counts (by newsgroup) [Top 100]:
| Newsgroup | Count | |
|---|---|---|
| 1 | alt.test | 5 |
| 2 | rocksolid.shared.test | 2 |
| TOTAL: 2 | 7 | |
