Log entries by program:
| Program name | Lines | %Lines | Size | %Size |
|---|---|---|---|---|
| inn | 17353 | 89.6% | 1.4 MB | 84.3% |
| innd | 1291 | 6.7% | 184.2 KB | 10.7% |
| innfeed | 600 | 3.1% | 68.7 KB | 4.0% |
| nocem | 95 | 0.5% | 10.7 KB | 0.6% |
| controlchan | 23 | 0.1% | 5.1 KB | 0.3% |
| nnrpd | 7 | 0.0% | 0.6 KB | 0.0% |
| pgpverify | 2 | 0.0% | 0.2 KB | 0.0% |
| TOTAL: 7 | 19371 | 100.0% | 1.7 MB | 100.0% |
History cache:
| Reason | Count | %Count |
|---|---|---|
| Do not exist | 16742 | 97.7% |
| Negative hits | 212 | 1.2% |
| Positive hits | 166 | 1.0% |
| Cache misses | 23 | 0.1% |
| TOTAL: 4 | 17143 | 100.0% |
INND timer:
| Code region | Time | Pct | Invoked | Min(ms) | Avg(ms) | Max(ms) |
|---|---|---|---|---|---|---|
| article cancel | 00:00:00.068 | 0.0% | 204 | 0.000 | 0.333 | 6.250 |
| article cleanup | 00:00:00.089 | 0.0% | 16753 | 0.000 | 0.005 | 0.041 |
| article logging | 00:00:00.509 | 0.0% | 17203 | 0.000 | 0.030 | 0.105 |
| article parse | 00:00:00.219 | 0.0% | 18798 | 0.000 | 0.012 | 0.046 |
| article write | 00:00:06.453 | 0.0% | 16561 | 0.144 | 0.390 | 1.065 |
| artlog/artcncl | 00:00:00.000 | 0.0% | 156 | 0.000 | 0.000 | 0.000 |
| data move | 00:00:00.009 | 0.0% | 20907 | 0.000 | 0.000 | 0.022 |
| hisgrep/artcncl | 00:00:00.015 | 0.0% | 193 | 0.000 | 0.078 | 2.500 |
| hishave/artcncl | 00:00:00.002 | 0.0% | 204 | 0.000 | 0.010 | 0.250 |
| history grep | 00:00:00.000 | 0.0% | 0 | 0.000 | 0.000 | 0.000 |
| history lookup | 00:00:00.158 | 0.0% | 16980 | 0.000 | 0.009 | 0.275 |
| history sync | 00:00:00.007 | 0.0% | 370 | 0.000 | 0.019 | 0.500 |
| history write | 00:00:01.951 | 0.0% | 16753 | 0.018 | 0.116 | 0.433 |
| hiswrite/artcncl | 00:00:00.000 | 0.0% | 11 | 0.000 | 0.000 | 0.000 |
| idle | 24:00:23.646 | 100.0% | 19417 | 2224.611 | 4450.927 | 14288.452 |
| nntp read | 00:00:00.523 | 0.0% | 19125 | 0.000 | 0.027 | 0.071 |
| overview write | 00:00:02.370 | 0.0% | 16561 | 0.022 | 0.143 | 1.362 |
| perl filter | 00:00:10.609 | 0.0% | 16753 | 0.497 | 0.633 | 0.962 |
| python filter | 00:00:00.000 | 0.0% | 0 | 0.000 | 0.000 | 0.000 |
| site send | 00:00:00.560 | 0.0% | 16639 | 0.000 | 0.034 | 0.084 |
| TOTAL: 24:00:50.056 | 24:00:47.188 | 100.0% | - | - | - | - |
INNfeed timer:
| Code region | Time | Pct | Invoked | Min(ms) | Avg(ms) | Max(ms) |
|---|---|---|---|---|---|---|
| article new | 00:00:00.017 | 0.0% | 16541 | 0.000 | 0.001 | 0.023 |
| article prepare | 00:00:00.000 | 0.0% | 524 | 0.000 | 0.000 | 0.000 |
| article read | 00:00:00.038 | 0.0% | 131 | 0.000 | 0.290 | 30.000 |
| backlog stats | 00:00:00.025 | 0.0% | 54283 | 0.000 | 0.000 | 0.005 |
| callbacks | 00:00:00.000 | 0.0% | 0 | 0.000 | 0.000 | 0.000 |
| data read | 00:00:00.259 | 0.0% | 33239 | 0.000 | 0.008 | 0.037 |
| data write | 00:00:00.287 | 0.0% | 16707 | 0.000 | 0.017 | 0.071 |
| idle | 23:58:48.086 | 100.0% | 54283 | 997.850 | 1590.334 | 4654.899 |
| status file | 00:00:00.045 | 0.0% | 152 | 0.000 | 0.296 | 1.000 |
| TOTAL: 23:58:49.232 | 23:58:48.757 | 100.0% | - | - | - | - |
nnrpd timer:
| Code region | Time | Pct | Invoked | Min(ms) | Avg(ms) | Max(ms) |
|---|---|---|---|---|---|---|
| idle | 00:00:00.119 | 33.3% | 2 | 59.500 | 59.500 | 59.500 |
| newnews | 00:00:00.000 | 0.0% | 0 | 0.000 | 0.000 | 0.000 |
| nntpwrite | 00:00:00.000 | 0.0% | 4 | 0.000 | 0.000 | 0.000 |
| TOTAL: 00:00:00.357 | 00:00:00.119 | 33.3% | - | - | - | - |
Control commands to INND:
| Command | Number |
|---|---|
| L | 1 |
| flush | 3 |
| flushlogs | 2 |
| go | 2 |
| logmode | 2 |
| mode | 149 |
| name | 2 |
| pause | 2 |
| paused | 2 |
| reload | 2 |
| reserve | 2 |
| TOTAL: 11 | 169 |
Control Channel:
| Sender | newgroup | rmgroup | Other | Bad PGP | DoIt | OK |
|---|---|---|---|---|---|---|
| randito@dictatorshandbook.net | 0 | 0 | 2 | 2 | 0 | 2 |
| TOTAL | 0 | 0 | 2 | 2 | 0 | 2 |
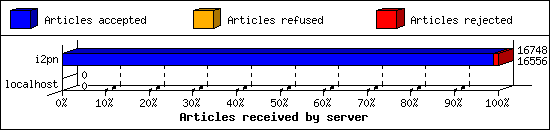
Incoming Feeds (INN):
| Server | Connects | Offered | Taken | Refused | Reject | %Accpt | Elapsed | |
|---|---|---|---|---|---|---|---|---|
| 1 | i2pn | 7 | 16748 | 16556 | 0 | 192 | 98% | 24:38:36 |
| 2 | localhost | 33 | 0 | 0 | 0 | 0 | 0% | 00:00:00 |
| TOTAL: 2 | 40 | 16748 | 16556 | 0 | 192 | 98% | 24:38:36 | |
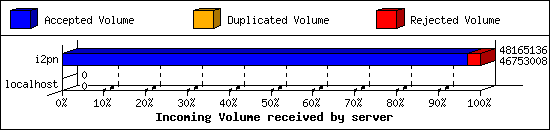
Incoming Volume (INN):
| Server | AcceptVol | DupVol | RejVol | TotalVol | %Acc | Vol/Art | |
|---|---|---|---|---|---|---|---|
| 1 | i2pn | 44.6 MB | 0.0 KB | 1.3 MB | 45.9 MB | 97% | 2.8 KB |
| 2 | localhost | 0.0 KB | 0.0 KB | 0.0 KB | 0.0 KB | 0% | 0 |
| TOTAL: 2 | 44.6 MB | 0.0 KB | 1.3 MB | 45.9 MB | 97% | 2.8 KB | |
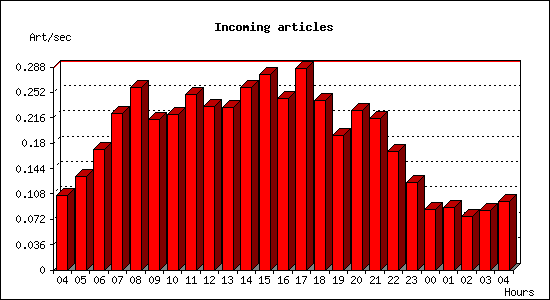
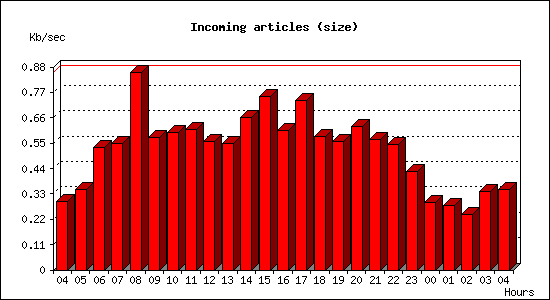
Incoming articles:
| Date | Articles | %Arts | Art/sec | Size | %Size | KB/sec |
|---|---|---|---|---|---|---|
| May 17 04:15:01 - 04:59:59 | 285 | 1.7% | 0.11 | 799.8 KB | 1.8% | 0.30 |
| May 17 05:00:00 - 05:59:59 | 478 | 2.9% | 0.13 | 1.2 MB | 2.8% | 0.35 |
| May 17 06:00:00 - 06:59:59 | 617 | 3.7% | 0.17 | 1.9 MB | 4.2% | 0.53 |
| May 17 07:00:00 - 07:59:59 | 799 | 4.8% | 0.22 | 1.9 MB | 4.3% | 0.55 |
| May 17 08:00:00 - 08:59:59 | 932 | 5.6% | 0.26 | 3.0 MB | 6.7% | 0.85 |
| May 17 09:00:00 - 09:59:59 | 767 | 4.6% | 0.21 | 2.0 MB | 4.5% | 0.57 |
| May 17 10:00:00 - 10:59:59 | 793 | 4.8% | 0.22 | 2.1 MB | 4.7% | 0.60 |
| May 17 11:00:00 - 11:59:59 | 898 | 5.4% | 0.25 | 2.1 MB | 4.8% | 0.61 |
| May 17 12:00:00 - 12:59:59 | 836 | 5.0% | 0.23 | 2.0 MB | 4.4% | 0.56 |
| May 17 13:00:00 - 13:59:59 | 831 | 5.0% | 0.23 | 1.9 MB | 4.3% | 0.55 |
| May 17 14:00:00 - 14:59:59 | 932 | 5.6% | 0.26 | 2.3 MB | 5.2% | 0.66 |
| May 17 15:00:00 - 15:59:59 | 999 | 6.0% | 0.28 | 2.6 MB | 5.9% | 0.75 |
| May 17 16:00:00 - 16:59:59 | 874 | 5.3% | 0.24 | 2.1 MB | 4.8% | 0.61 |
| May 17 17:00:00 - 17:59:59 | 1027 | 6.2% | 0.29 | 2.6 MB | 5.8% | 0.74 |
| May 17 18:00:00 - 18:59:59 | 864 | 5.2% | 0.24 | 2.0 MB | 4.6% | 0.58 |
| May 17 19:00:00 - 19:59:59 | 689 | 4.2% | 0.19 | 2.0 MB | 4.4% | 0.56 |
| May 17 20:00:00 - 20:59:59 | 815 | 4.9% | 0.23 | 2.2 MB | 4.9% | 0.62 |
| May 17 21:00:00 - 21:59:59 | 772 | 4.7% | 0.21 | 2.0 MB | 4.4% | 0.56 |
| May 17 22:00:00 - 22:59:59 | 605 | 3.7% | 0.17 | 1.9 MB | 4.3% | 0.54 |
| May 17 23:00:00 - 23:59:59 | 449 | 2.7% | 0.12 | 1.5 MB | 3.4% | 0.43 |
| May 18 00:00:00 - 00:59:59 | 308 | 1.9% | 0.09 | 1.0 MB | 2.3% | 0.29 |
| May 18 01:00:00 - 01:59:59 | 321 | 1.9% | 0.09 | 1000.9 KB | 2.2% | 0.28 |
| May 18 02:00:00 - 02:59:59 | 272 | 1.6% | 0.08 | 870.5 KB | 1.9% | 0.24 |
| May 18 03:00:00 - 03:59:59 | 305 | 1.8% | 0.08 | 1.2 MB | 2.7% | 0.34 |
| May 18 04:00:00 - 04:15:01 | 88 | 0.5% | 0.10 | 316.3 KB | 0.7% | 0.35 |
| TOTAL: 24:00:00 | 16556 | 100.0% | 0.19 | 44.6 MB | 100.0% | 0.53 |
Sites sending bad articles:
| Server | Total | Group | Dist | Duplic | Unapp | TooOld | Site | Line | Other | |
|---|---|---|---|---|---|---|---|---|---|---|
| 1 | i2pn | 642 | 1 | 0 | 0 | 0 | 0 | 0 | 0 | 641 |
| TOTAL: 1 | 642 | 1 | 0 | 0 | 0 | 0 | 0 | 0 | 641 | |
Unwanted newsgroups [Top 20]:
| Newsgroup | Count |
|---|---|
| 24hoursupport.helpdesk | 1 |
| TOTAL: 1 | 1 |
INND Perl filter [Top 20]:
| Reason | Count |
|---|---|
| Scoring filter (s5) | 145 |
| Scoring filter (s6) | 30 |
| Scoring filter (n11) | 14 |
| EMP (md5) | 1 |
| Scoring filter (n6) | 1 |
| TOTAL: 5 | 191 |
NoCeM on Spool:
| Id | Good | Bad | Unique | Total |
|---|---|---|---|---|
| bleachbot@httrack.com | 64 | 0 | 67 | 67 |
| TOTAL: 1 | 64 | 23 | 67 | 67 |
Miscellaneous innd statistics [Top 10]:
| Event | Server | Number |
|---|---|---|
| Including strange strings | ||
| i2pn | 450 | |
| TOTAL: 1 | 450 | |
| TOTAL: 1 | 450 | |
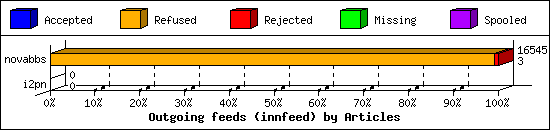
Outgoing Feeds (innfeed) by Articles:
| Server | Offered | Taken | Refused | Reject | Miss | Spool | %Took | Elapsed | |
|---|---|---|---|---|---|---|---|---|---|
| 1 | novabbs | 16575 | 3 | 16414 | 128 | 0 | 0 | 0% | 23:59:57 |
| 2 | i2pn | 0 | 0 | 0 | 0 | 0 | 0 | 0% | 00:10:00 |
| TOTAL: 2 | 16575 | 3 | 16414 | 128 | 0 | 0 | 0% | 24:09:57 | |
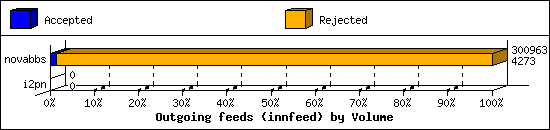
Outgoing Feeds (innfeed) by Volume:
| Server | AcceptVol | RejectVol | TotalVol | Volume/sec | Vol/Art | Elapsed | |
|---|---|---|---|---|---|---|---|
| 1 | novabbs | 4.2 KB | 289.7 KB | 293.9 KB | 0.0 KB/s | 2.2 KB | 23:59:57 |
| 2 | i2pn | 0.0 KB | 0.0 KB | 0.0 KB | 0.0 KB/s | 0 | 00:10:00 |
| TOTAL: 2 | 4.2 KB | 289.7 KB | 293.9 KB | 0.0 KB/s | 2.2 KB | 24:09:57 | |
NNRP readership statistics:
| System | Conn | Arts | Size | Groups | Post | Rej | Elapsed | |
|---|---|---|---|---|---|---|---|---|
| 1 | 185.222.211.146 | 1 | 0 | 0.0 KB | 0 | 0 | 0 | 00:00:00 |
| TOTAL: 1 | 1 | 0 | 0.0 KB | 0 | 0 | 0 | 00:00:00 | |
NNRP readership statistics (by domain):
| System | Conn | Arts | Size | Groups | Post | Rej | Elapsed | |
|---|---|---|---|---|---|---|---|---|
| 1 | unresolved | 1 | 0 | 0.0 KB | 0 | 0 | 0 | 00:00:00 |
| TOTAL: 1 | 1 | 0 | 0.0 KB | 0 | 0 | 0 | 00:00:00 | |
NNRP total resource statistics [Top 20]:
| System | User(ms) | System(ms) | Idle(ms) | Elapsed |
|---|---|---|---|---|
| 185.222.211.146 | 0.036 | 0.012 | 0.000 | 00:00:00 |
| TOTAL: 1 | 0.036 | 0.012 | 0.000 | 00:00:00 |
NNRP unrecognized commands (by host):
| System | Conn |
|---|---|
| 185.222.211.146 | 1 |
| TOTAL: 1 | 1 |
NNRP unrecognized commands (by command):
| Command | Count |
|---|---|
| #003 | 1 |
| TOTAL: 1 | 1 |
NNRP client timeouts [Top 20]:
| System | Conn | Peer |
|---|---|---|
| 185.222.211.146 | 1 | 1 |
| TOTAL: 1 | 1 | 1 |
