Log entries by program:
| Program name | Lines | %Lines | Size | %Size |
|---|---|---|---|---|
| inn | 16163 | 89.5% | 1.3 MB | 84.3% |
| innd | 1198 | 6.6% | 169.6 KB | 10.5% |
| innfeed | 606 | 3.4% | 70.4 KB | 4.4% |
| nocem | 96 | 0.5% | 11.4 KB | 0.7% |
| nnrpd | 4 | 0.0% | 0.4 KB | 0.0% |
| controlchan | 1 | 0.0% | 0.1 KB | 0.0% |
| TOTAL: 6 | 18068 | 100.0% | 1.6 MB | 100.0% |
History cache:
| Reason | Count | %Count |
|---|---|---|
| Do not exist | 15536 | 97.7% |
| Negative hits | 183 | 1.2% |
| Positive hits | 160 | 1.0% |
| Cache misses | 23 | 0.1% |
| TOTAL: 4 | 15902 | 100.0% |
INND timer:
| Code region | Time | Pct | Invoked | Min(ms) | Avg(ms) | Max(ms) |
|---|---|---|---|---|---|---|
| article cancel | 00:00:00.071 | 0.0% | 201 | 0.000 | 0.353 | 28.000 |
| article cleanup | 00:00:00.069 | 0.0% | 15538 | 0.000 | 0.004 | 0.029 |
| article logging | 00:00:00.430 | 0.0% | 15952 | 0.000 | 0.027 | 0.083 |
| article parse | 00:00:00.204 | 0.0% | 17393 | 0.000 | 0.012 | 0.062 |
| article write | 00:00:07.828 | 0.0% | 15419 | 0.172 | 0.508 | 1.915 |
| artlog/artcncl | 00:00:00.004 | 0.0% | 147 | 0.000 | 0.027 | 1.000 |
| data move | 00:00:00.010 | 0.0% | 19277 | 0.000 | 0.001 | 0.011 |
| hisgrep/artcncl | 00:00:00.005 | 0.0% | 186 | 0.000 | 0.027 | 1.000 |
| hishave/artcncl | 00:00:00.001 | 0.0% | 201 | 0.000 | 0.005 | 0.100 |
| history grep | 00:00:00.000 | 0.0% | 0 | 0.000 | 0.000 | 0.000 |
| history lookup | 00:00:02.908 | 0.0% | 15736 | 0.000 | 0.185 | 1.551 |
| history sync | 00:00:00.014 | 0.0% | 310 | 0.000 | 0.045 | 1.000 |
| history write | 00:00:03.681 | 0.0% | 15538 | 0.000 | 0.237 | 0.939 |
| hiswrite/artcncl | 00:00:00.002 | 0.0% | 15 | 0.000 | 0.133 | 0.500 |
| idle | 23:49:52.958 | 100.0% | 17907 | 2325.182 | 4791.029 | 17146.343 |
| nntp read | 00:00:00.469 | 0.0% | 17679 | 0.000 | 0.027 | 0.095 |
| overview write | 00:00:03.061 | 0.0% | 15419 | 0.027 | 0.199 | 2.719 |
| perl filter | 00:00:09.701 | 0.0% | 15538 | 0.490 | 0.624 | 1.617 |
| python filter | 00:00:00.000 | 0.0% | 0 | 0.000 | 0.000 | 0.000 |
| site send | 00:00:00.241 | 0.0% | 15507 | 0.000 | 0.016 | 0.069 |
| TOTAL: 23:50:24.154 | 23:50:21.657 | 100.0% | - | - | - | - |
INNfeed timer:
| Code region | Time | Pct | Invoked | Min(ms) | Avg(ms) | Max(ms) |
|---|---|---|---|---|---|---|
| article new | 00:00:00.024 | 0.0% | 15462 | 0.000 | 0.002 | 0.024 |
| article prepare | 00:00:00.000 | 0.0% | 232 | 0.000 | 0.000 | 0.000 |
| article read | 00:00:00.023 | 0.0% | 58 | 0.000 | 0.397 | 21.000 |
| backlog stats | 00:00:00.015 | 0.0% | 50995 | 0.000 | 0.000 | 0.005 |
| callbacks | 00:00:00.000 | 0.0% | 0 | 0.000 | 0.000 | 0.000 |
| data read | 00:00:00.226 | 0.0% | 31038 | 0.000 | 0.007 | 0.022 |
| data write | 00:00:00.223 | 0.0% | 15585 | 0.000 | 0.014 | 0.071 |
| idle | 23:58:42.735 | 100.0% | 50995 | 959.414 | 1692.769 | 4960.785 |
| status file | 00:00:00.039 | 0.0% | 155 | 0.000 | 0.252 | 2.000 |
| TOTAL: 23:58:43.724 | 23:58:43.285 | 100.0% | - | - | - | - |
nnrpd timer:
| Code region | Time | Pct | Invoked | Min(ms) | Avg(ms) | Max(ms) |
|---|---|---|---|---|---|---|
| idle | 00:00:09.816 | 99.0% | 1 | 9816.000 | 9816.000 | 9816.000 |
| newnews | 00:00:00.000 | 0.0% | 0 | 0.000 | 0.000 | 0.000 |
| nntpwrite | 00:00:00.000 | 0.0% | 2 | 0.000 | 0.000 | 0.000 |
| TOTAL: 00:00:09.918 | 00:00:09.816 | 99.0% | - | - | - | - |
Control commands to INND:
| Command | Number |
|---|---|
| L | 1 |
| flush | 3 |
| flushlogs | 2 |
| go | 2 |
| logmode | 2 |
| mode | 148 |
| name | 2 |
| pause | 2 |
| paused | 2 |
| reload | 2 |
| reserve | 2 |
| TOTAL: 11 | 168 |
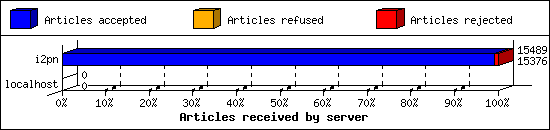
Incoming Feeds (INN):
| Server | Connects | Offered | Taken | Refused | Reject | %Accpt | Elapsed | |
|---|---|---|---|---|---|---|---|---|
| 1 | i2pn | 4 | 15489 | 15376 | 0 | 113 | 99% | 23:51:43 |
| 2 | localhost | 33 | 0 | 0 | 0 | 0 | 0% | 00:00:00 |
| TOTAL: 2 | 37 | 15489 | 15376 | 0 | 113 | 99% | 23:51:43 | |
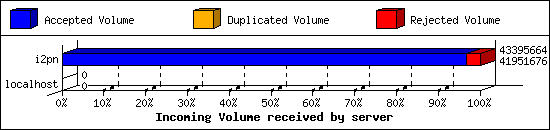
Incoming Volume (INN):
| Server | AcceptVol | DupVol | RejVol | TotalVol | %Acc | Vol/Art | |
|---|---|---|---|---|---|---|---|
| 1 | i2pn | 40.0 MB | 0.0 KB | 1.4 MB | 41.4 MB | 96% | 2.7 KB |
| 2 | localhost | 0.0 KB | 0.0 KB | 0.0 KB | 0.0 KB | 0% | 0 |
| TOTAL: 2 | 40.0 MB | 0.0 KB | 1.4 MB | 41.4 MB | 96% | 2.7 KB | |
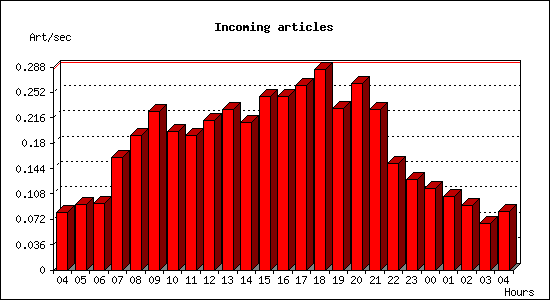
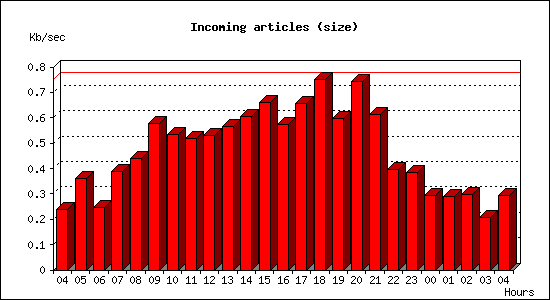
Incoming articles:
| Date | Articles | %Arts | Art/sec | Size | %Size | KB/sec |
|---|---|---|---|---|---|---|
| May 19 04:15:01 - 04:59:59 | 219 | 1.4% | 0.08 | 644.8 KB | 1.6% | 0.24 |
| May 19 05:00:00 - 05:59:59 | 336 | 2.2% | 0.09 | 1.3 MB | 3.1% | 0.36 |
| May 19 06:00:00 - 06:59:59 | 338 | 2.2% | 0.09 | 884.6 KB | 2.1% | 0.25 |
| May 19 07:00:00 - 07:59:59 | 574 | 3.7% | 0.16 | 1.4 MB | 3.4% | 0.39 |
| May 19 08:00:00 - 08:59:59 | 688 | 4.4% | 0.19 | 1.5 MB | 3.8% | 0.44 |
| May 19 09:00:00 - 09:59:59 | 810 | 5.2% | 0.23 | 2.0 MB | 5.0% | 0.58 |
| May 19 10:00:00 - 10:59:59 | 708 | 4.6% | 0.20 | 1.9 MB | 4.6% | 0.53 |
| May 19 11:00:00 - 11:59:59 | 688 | 4.4% | 0.19 | 1.8 MB | 4.5% | 0.52 |
| May 19 12:00:00 - 12:59:59 | 762 | 4.9% | 0.21 | 1.9 MB | 4.6% | 0.53 |
| May 19 13:00:00 - 13:59:59 | 821 | 5.3% | 0.23 | 2.0 MB | 4.9% | 0.57 |
| May 19 14:00:00 - 14:59:59 | 755 | 4.9% | 0.21 | 2.1 MB | 5.3% | 0.60 |
| May 19 15:00:00 - 15:59:59 | 888 | 5.7% | 0.25 | 2.3 MB | 5.8% | 0.66 |
| May 19 16:00:00 - 16:59:59 | 888 | 5.7% | 0.25 | 2.0 MB | 5.0% | 0.57 |
| May 19 17:00:00 - 17:59:59 | 941 | 6.1% | 0.26 | 2.3 MB | 5.7% | 0.66 |
| May 19 18:00:00 - 18:59:59 | 1022 | 6.6% | 0.28 | 2.6 MB | 6.6% | 0.75 |
| May 19 19:00:00 - 19:59:59 | 824 | 5.3% | 0.23 | 2.1 MB | 5.2% | 0.60 |
| May 19 20:00:00 - 20:59:59 | 952 | 6.2% | 0.26 | 2.6 MB | 6.5% | 0.74 |
| May 19 21:00:00 - 21:59:59 | 821 | 5.3% | 0.23 | 2.2 MB | 5.3% | 0.61 |
| May 19 22:00:00 - 22:59:59 | 542 | 3.5% | 0.15 | 1.4 MB | 3.5% | 0.40 |
| May 19 23:00:00 - 23:59:59 | 463 | 3.0% | 0.13 | 1.4 MB | 3.4% | 0.39 |
| May 20 00:00:00 - 00:59:59 | 415 | 2.7% | 0.12 | 1.0 MB | 2.6% | 0.29 |
| May 20 01:00:00 - 01:59:59 | 373 | 2.4% | 0.10 | 1.0 MB | 2.5% | 0.29 |
| May 20 02:00:00 - 02:59:59 | 330 | 2.1% | 0.09 | 1.0 MB | 2.6% | 0.30 |
| May 20 03:00:00 - 03:59:59 | 236 | 1.5% | 0.07 | 748.5 KB | 1.8% | 0.21 |
| May 20 04:00:00 - 04:15:01 | 75 | 0.5% | 0.08 | 265.8 KB | 0.6% | 0.29 |
| TOTAL: 24:00:00 | 15469 | 100.0% | 0.18 | 40.4 MB | 100.0% | 0.48 |
Sites sending bad articles:
| Server | Total | Group | Dist | Duplic | Unapp | TooOld | Site | Line | Other | |
|---|---|---|---|---|---|---|---|---|---|---|
| 1 | i2pn | 538 | 11 | 0 | 0 | 0 | 0 | 0 | 0 | 527 |
| TOTAL: 1 | 538 | 11 | 0 | 0 | 0 | 0 | 0 | 0 | 527 | |
Unwanted newsgroups [Top 20]:
| Newsgroup | Count |
|---|---|
| alt.pl.nieruchomosci.gielda | 11 |
| TOTAL: 1 | 11 |
INND Perl filter [Top 20]:
| Reason | Count |
|---|---|
| Scoring filter (s5) | 57 |
| Scoring filter (s6) | 40 |
| Scoring filter (n11) | 8 |
| Scoring filter (sit1b) | 6 |
| EMP (phl) | 1 |
| Scoring filter (n6) | 1 |
| TOTAL: 6 | 113 |
NoCeM on Spool:
| Id | Good | Bad | Unique | Total |
|---|---|---|---|---|
| bleachbot@httrack.com | 53 | 0 | 59 | 59 |
| TOTAL: 1 | 53 | 35 | 59 | 59 |
Miscellaneous innd statistics [Top 10]:
| Event | Server | Number |
|---|---|---|
| Including strange strings | ||
| i2pn | 414 | |
| TOTAL: 1 | 414 | |
| TOTAL: 1 | 414 | |
Outgoing Feeds (innfeed) by Articles:
| Server | Offered | Taken | Refused | Reject | Miss | Spool | %Took | Elapsed | |
|---|---|---|---|---|---|---|---|---|---|
| 1 | novabbs | 15529 | 3 | 15411 | 55 | 0 | 0 | 0% | 23:59:32 |
| 2 | i2pn | 0 | 0 | 0 | 0 | 0 | 0 | 0% | 00:10:00 |
| TOTAL: 2 | 15529 | 3 | 15411 | 55 | 0 | 0 | 0% | 24:09:32 | |

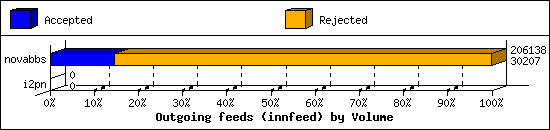
Outgoing Feeds (innfeed) by Volume:
| Server | AcceptVol | RejectVol | TotalVol | Volume/sec | Vol/Art | Elapsed | |
|---|---|---|---|---|---|---|---|
| 1 | novabbs | 29.5 KB | 171.8 KB | 201.3 KB | 0.0 KB/s | 3.5 KB | 23:59:32 |
| 2 | i2pn | 0.0 KB | 0.0 KB | 0.0 KB | 0.0 KB/s | 0 | 00:10:00 |
| TOTAL: 2 | 29.5 KB | 171.8 KB | 201.3 KB | 0.0 KB/s | 3.5 KB | 24:09:32 | |
NNRP readership statistics:
| System | Conn | Arts | Size | Groups | Post | Rej | Elapsed | |
|---|---|---|---|---|---|---|---|---|
| 1 | 162.243.140.86 | 1 | 0 | 0.0 KB | 0 | 0 | 0 | 00:00:09 |
| TOTAL: 1 | 1 | 0 | 0.0 KB | 0 | 0 | 0 | 00:00:09 | |
NNRP readership statistics (by domain):
| System | Conn | Arts | Size | Groups | Post | Rej | Elapsed | |
|---|---|---|---|---|---|---|---|---|
| 1 | unresolved | 1 | 0 | 0.0 KB | 0 | 0 | 0 | 00:00:09 |
| TOTAL: 1 | 1 | 0 | 0.0 KB | 0 | 0 | 0 | 00:00:09 | |
NNRP total resource statistics [Top 20]:
| System | User(ms) | System(ms) | Idle(ms) | Elapsed |
|---|---|---|---|---|
| 162.243.140.86 | 0.040 | 0.008 | 0.000 | 00:00:09 |
| TOTAL: 1 | 0.040 | 0.008 | 0.000 | 00:00:09 |
