Log entries by program:
| Program name | Lines | %Lines | Size | %Size |
|---|---|---|---|---|
| inn | 18838 | 90.4% | 1.5 MB | 85.6% |
| innd | 1321 | 6.3% | 199.6 KB | 10.9% |
| innfeed | 604 | 2.9% | 56.4 KB | 3.1% |
| nocem | 61 | 0.3% | 6.7 KB | 0.4% |
| nnrpd | 11 | 0.1% | 1.1 KB | 0.1% |
| controlchan | 1 | 0.0% | 0.1 KB | 0.0% |
| TOTAL: 6 | 20836 | 100.0% | 1.8 MB | 100.0% |
History cache:
| Reason | Count | %Count |
|---|---|---|
| Do not exist | 18130 | 97.2% |
| Negative hits | 375 | 2.0% |
| Positive hits | 106 | 0.6% |
| Cache misses | 50 | 0.3% |
| TOTAL: 4 | 18661 | 100.0% |
INND timer:
| Code region | Time | Pct | Invoked | Min(ms) | Avg(ms) | Max(ms) |
|---|---|---|---|---|---|---|
| article cancel | 00:00:00.081 | 0.0% | 174 | 0.000 | 0.466 | 3.444 |
| article cleanup | 00:00:00.081 | 0.0% | 18210 | 0.000 | 0.004 | 0.034 |
| article logging | 00:00:00.628 | 0.0% | 18724 | 0.000 | 0.034 | 0.118 |
| article parse | 00:00:00.235 | 0.0% | 20306 | 0.000 | 0.012 | 0.060 |
| article write | 00:00:04.116 | 0.0% | 17992 | 0.106 | 0.229 | 1.786 |
| artlog/artcncl | 00:00:00.001 | 0.0% | 132 | 0.000 | 0.008 | 0.333 |
| data move | 00:00:00.008 | 0.0% | 22665 | 0.000 | 0.000 | 0.024 |
| hisgrep/artcncl | 00:00:00.004 | 0.0% | 166 | 0.000 | 0.024 | 1.000 |
| hishave/artcncl | 00:00:00.000 | 0.0% | 174 | 0.000 | 0.000 | 0.000 |
| history grep | 00:00:00.000 | 0.0% | 0 | 0.000 | 0.000 | 0.000 |
| history lookup | 00:00:00.101 | 0.0% | 18619 | 0.000 | 0.005 | 0.038 |
| history sync | 00:00:00.015 | 0.0% | 420 | 0.000 | 0.036 | 0.500 |
| history write | 00:00:01.623 | 0.0% | 18210 | 0.000 | 0.089 | 0.620 |
| hiswrite/artcncl | 00:00:00.000 | 0.0% | 8 | 0.000 | 0.000 | 0.000 |
| idle | 24:00:42.588 | 100.0% | 21130 | 1880.213 | 4090.989 | 11540.750 |
| nntp read | 00:00:00.575 | 0.0% | 20791 | 0.000 | 0.028 | 0.069 |
| overview write | 00:00:03.279 | 0.0% | 17992 | 0.023 | 0.182 | 1.366 |
| perl filter | 00:00:11.676 | 0.0% | 18210 | 0.455 | 0.641 | 0.811 |
| python filter | 00:00:00.000 | 0.0% | 0 | 0.000 | 0.000 | 0.000 |
| site send | 00:00:00.445 | 0.0% | 18043 | 0.000 | 0.025 | 0.110 |
| TOTAL: 24:01:08.416 | 24:01:05.456 | 100.0% | - | - | - | - |
INNfeed timer:
| Code region | Time | Pct | Invoked | Min(ms) | Avg(ms) | Max(ms) |
|---|---|---|---|---|---|---|
| article new | 00:00:00.028 | 0.0% | 17972 | 0.000 | 0.002 | 0.023 |
| article prepare | 00:00:00.000 | 0.0% | 736 | 0.000 | 0.000 | 0.000 |
| article read | 00:00:00.034 | 0.0% | 184 | 0.000 | 0.185 | 4.400 |
| backlog stats | 00:00:00.015 | 0.0% | 58698 | 0.000 | 0.000 | 0.004 |
| callbacks | 00:00:00.000 | 0.0% | 0 | 0.000 | 0.000 | 0.000 |
| data read | 00:00:00.245 | 0.0% | 36145 | 0.000 | 0.007 | 0.024 |
| data write | 00:00:00.303 | 0.0% | 18207 | 0.000 | 0.017 | 0.070 |
| idle | 23:58:58.206 | 100.0% | 58698 | 875.557 | 1470.888 | 3873.355 |
| status file | 00:00:00.054 | 0.0% | 155 | 0.000 | 0.348 | 2.000 |
| TOTAL: 23:58:59.366 | 23:58:58.885 | 100.0% | - | - | - | - |
nnrpd timer:
| Code region | Time | Pct | Invoked | Min(ms) | Avg(ms) | Max(ms) |
|---|---|---|---|---|---|---|
| idle | 00:00:09.910 | 93.7% | 3 | 78.500 | 3303.333 | 9753.000 |
| newnews | 00:00:00.000 | 0.0% | 0 | 0.000 | 0.000 | 0.000 |
| nntpwrite | 00:00:00.000 | 0.0% | 13 | 0.000 | 0.000 | 0.000 |
| TOTAL: 00:00:10.577 | 00:00:09.910 | 93.7% | - | - | - | - |
Control commands to INND:
| Command | Number |
|---|---|
| L | 1 |
| flush | 3 |
| flushlogs | 2 |
| go | 2 |
| logmode | 2 |
| mode | 148 |
| name | 2 |
| pause | 2 |
| paused | 2 |
| reload | 2 |
| reserve | 2 |
| TOTAL: 11 | 168 |
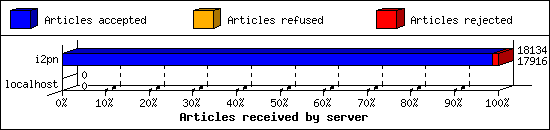
Incoming Feeds (INN):
| Server | Connects | Offered | Taken | Refused | Reject | %Accpt | Elapsed | |
|---|---|---|---|---|---|---|---|---|
| 1 | i2pn | 6 | 18134 | 17916 | 1 | 217 | 98% | 24:21:52 |
| 2 | localhost | 34 | 0 | 0 | 0 | 0 | 0% | 00:00:00 |
| TOTAL: 2 | 40 | 18134 | 17916 | 1 | 217 | 98% | 24:21:52 | |
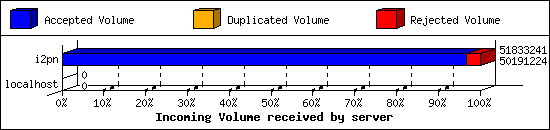
Incoming Volume (INN):
| Server | AcceptVol | DupVol | RejVol | TotalVol | %Acc | Vol/Art | |
|---|---|---|---|---|---|---|---|
| 1 | i2pn | 47.9 MB | 0.0 KB | 1.6 MB | 49.4 MB | 96% | 2.8 KB |
| 2 | localhost | 0.0 KB | 0.0 KB | 0.0 KB | 0.0 KB | 0% | 0 |
| TOTAL: 2 | 47.9 MB | 0.0 KB | 1.6 MB | 49.4 MB | 96% | 2.8 KB | |
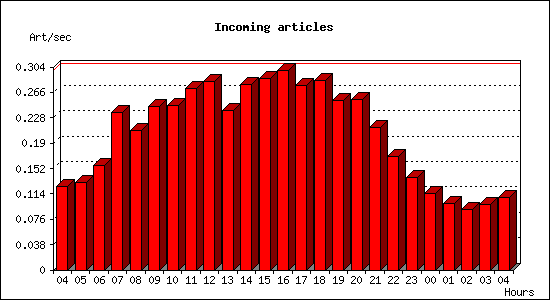
Incoming articles:
| Date | Articles | %Arts | Art/sec | Size | %Size | KB/sec |
|---|---|---|---|---|---|---|
| May 22 04:15:01 - 04:59:59 | 339 | 1.9% | 0.13 | 1016.1 KB | 2.1% | 0.38 |
| May 22 05:00:00 - 05:59:59 | 474 | 2.6% | 0.13 | 1.5 MB | 3.0% | 0.42 |
| May 22 06:00:00 - 06:59:59 | 565 | 3.1% | 0.16 | 1.4 MB | 2.9% | 0.40 |
| May 22 07:00:00 - 07:59:59 | 847 | 4.7% | 0.24 | 2.0 MB | 4.1% | 0.56 |
| May 22 08:00:00 - 08:59:59 | 754 | 4.2% | 0.21 | 1.9 MB | 4.0% | 0.55 |
| May 22 09:00:00 - 09:59:59 | 882 | 4.9% | 0.24 | 2.1 MB | 4.4% | 0.61 |
| May 22 10:00:00 - 10:59:59 | 885 | 4.9% | 0.25 | 2.1 MB | 4.4% | 0.60 |
| May 22 11:00:00 - 11:59:59 | 977 | 5.4% | 0.27 | 2.7 MB | 5.5% | 0.75 |
| May 22 12:00:00 - 12:59:59 | 1014 | 5.6% | 0.28 | 2.5 MB | 5.3% | 0.72 |
| May 22 13:00:00 - 13:59:59 | 860 | 4.8% | 0.24 | 2.2 MB | 4.6% | 0.63 |
| May 22 14:00:00 - 14:59:59 | 1001 | 5.6% | 0.28 | 2.5 MB | 5.3% | 0.72 |
| May 22 15:00:00 - 15:59:59 | 1034 | 5.8% | 0.29 | 2.5 MB | 5.3% | 0.72 |
| May 22 16:00:00 - 16:59:59 | 1076 | 6.0% | 0.30 | 2.8 MB | 5.8% | 0.80 |
| May 22 17:00:00 - 17:59:59 | 992 | 5.5% | 0.28 | 2.6 MB | 5.5% | 0.75 |
| May 22 18:00:00 - 18:59:59 | 1019 | 5.7% | 0.28 | 2.8 MB | 5.7% | 0.78 |
| May 22 19:00:00 - 19:59:59 | 913 | 5.1% | 0.25 | 2.3 MB | 4.9% | 0.66 |
| May 22 20:00:00 - 20:59:59 | 917 | 5.1% | 0.25 | 2.8 MB | 5.7% | 0.78 |
| May 22 21:00:00 - 21:59:59 | 770 | 4.3% | 0.21 | 2.3 MB | 4.7% | 0.64 |
| May 22 22:00:00 - 22:59:59 | 612 | 3.4% | 0.17 | 2.0 MB | 4.1% | 0.56 |
| May 22 23:00:00 - 23:59:59 | 498 | 2.8% | 0.14 | 1.4 MB | 3.0% | 0.41 |
| May 23 00:00:00 - 00:59:59 | 411 | 2.3% | 0.11 | 1.1 MB | 2.3% | 0.32 |
| May 23 01:00:00 - 01:59:59 | 356 | 2.0% | 0.10 | 1.1 MB | 2.3% | 0.31 |
| May 23 02:00:00 - 02:59:59 | 327 | 1.8% | 0.09 | 1015.5 KB | 2.1% | 0.28 |
| May 23 03:00:00 - 03:59:59 | 355 | 2.0% | 0.10 | 1.1 MB | 2.2% | 0.30 |
| May 23 04:00:00 - 04:15:01 | 98 | 0.5% | 0.11 | 300.2 KB | 0.6% | 0.33 |
| TOTAL: 24:00:00 | 17976 | 100.0% | 0.21 | 48.0 MB | 100.0% | 0.57 |

Sites sending bad articles:
| Server | Total | Group | Dist | Duplic | Unapp | TooOld | Site | Line | Other | |
|---|---|---|---|---|---|---|---|---|---|---|
| 1 | i2pn | 731 | 2 | 0 | 0 | 0 | 0 | 0 | 0 | 729 |
| TOTAL: 1 | 731 | 2 | 0 | 0 | 0 | 0 | 0 | 0 | 729 | |
Unwanted newsgroups [Top 20]:
| Newsgroup | Count |
|---|---|
| biz.mlm | 1 |
| alt.sex.girl | 1 |
| TOTAL: 2 | 2 |
INND Perl filter [Top 20]:
| Reason | Count |
|---|---|
| Scoring filter (s5) | 159 |
| Scoring filter (s6) | 47 |
| Scoring filter (sit1b) | 5 |
| Scoring filter (n6) | 2 |
| Scoring filter (n4) | 2 |
| Scoring filter (n11) | 1 |
| TOTAL: 6 | 216 |
NoCeM on Spool:
| Id | Good | Bad | Unique | Total |
|---|---|---|---|---|
| bleachbot@httrack.com | 44 | 0 | 49 | 49 |
| TOTAL: 1 | 44 | 8 | 49 | 49 |
Miscellaneous innd statistics [Top 10]:
| Event | Server | Number |
|---|---|---|
| Including strange strings | ||
| i2pn | 513 | |
| TOTAL: 1 | 513 | |
| TOTAL: 1 | 513 | |
Outgoing Feeds (innfeed) by Articles:
| Server | Offered | Taken | Refused | Reject | Miss | Spool | %Took | Elapsed | |
|---|---|---|---|---|---|---|---|---|---|
| 1 | novabbs | 18025 | 7 | 17791 | 177 | 0 | 0 | 0% | 23:59:58 |
| 2 | i2pn | 0 | 0 | 0 | 0 | 0 | 0 | 0% | 00:10:00 |
| TOTAL: 2 | 18025 | 7 | 17791 | 177 | 0 | 0 | 0% | 24:09:58 | |

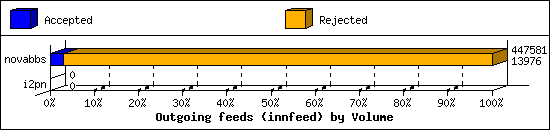
Outgoing Feeds (innfeed) by Volume:
| Server | AcceptVol | RejectVol | TotalVol | Volume/sec | Vol/Art | Elapsed | |
|---|---|---|---|---|---|---|---|
| 1 | novabbs | 13.6 KB | 423.4 KB | 437.1 KB | 0.0 KB/s | 2.4 KB | 23:59:58 |
| 2 | i2pn | 0.0 KB | 0.0 KB | 0.0 KB | 0.0 KB/s | 0 | 00:10:00 |
| TOTAL: 2 | 13.6 KB | 423.4 KB | 437.1 KB | 0.0 KB/s | 2.4 KB | 24:09:58 | |
NNRP readership statistics:
| System | Conn | Arts | Size | Groups | Post | Rej | Elapsed | |
|---|---|---|---|---|---|---|---|---|
| 1 | 162.243.150.154 | 1 | 0 | 0.0 KB | 0 | 0 | 0 | 00:00:09 |
| 2 | scan-141.security.ipip.net | 1 | 0 | 0.0 KB | 0 | 0 | 0 | 00:00:00 |
| TOTAL: 2 | 2 | 0 | 0.0 KB | 0 | 0 | 0 | 00:00:10 | |
NNRP readership statistics (by domain):
| System | Conn | Arts | Size | Groups | Post | Rej | Elapsed | |
|---|---|---|---|---|---|---|---|---|
| 1 | unresolved | 1 | 0 | 0.0 KB | 0 | 0 | 0 | 00:00:09 |
| 2 | *.security.ipip.net | 1 | 0 | 0.0 KB | 0 | 0 | 0 | 00:00:00 |
| TOTAL: 2 | 2 | 0 | 0.0 KB | 0 | 0 | 0 | 00:00:10 | |
NNRP total resource statistics [Top 20]:
| System | User(ms) | System(ms) | Idle(ms) | Elapsed |
|---|---|---|---|---|
| 162.243.150.154 | 0.052 | 0.000 | 0.000 | 00:00:09 |
| scan-141.security.ipip.net | 0.036 | 0.012 | 0.000 | 00:00:00 |
| TOTAL: 2 | 0.088 | 0.012 | 0.000 | 00:00:10 |
NNRP unrecognized commands (by host):
| System | Conn |
|---|---|
| scan-141.security.ipip.net | 4 |
| TOTAL: 1 | 4 |
NNRP unrecognized commands (by command):
| Command | Count |
|---|---|
| Host: 157.230.63.40:119 | 1 |
| GET / HTTP/1.1 | 1 |
| User-Agent: HTTP Banner Detection (https... | 1 |
| Connection: close | 1 |
| TOTAL: 4 | 4 |
