Log entries by program:
| Program name | Lines | %Lines | Size | %Size |
|---|---|---|---|---|
| inn | 18115 | 89.4% | 1.5 MB | 84.4% |
| innd | 1437 | 7.1% | 195.9 KB | 10.9% |
| innfeed | 606 | 3.0% | 74.4 KB | 4.1% |
| nocem | 88 | 0.4% | 9.6 KB | 0.5% |
| nnrpd | 20 | 0.1% | 2.1 KB | 0.1% |
| controlchan | 1 | 0.0% | 0.1 KB | 0.0% |
| TOTAL: 6 | 20267 | 100.0% | 1.8 MB | 100.0% |
History cache:
| Reason | Count | %Count |
|---|---|---|
| Do not exist | 17430 | 97.3% |
| Negative hits | 319 | 1.8% |
| Positive hits | 131 | 0.7% |
| Cache misses | 28 | 0.2% |
| TOTAL: 4 | 17908 | 100.0% |
INND timer:
| Code region | Time | Pct | Invoked | Min(ms) | Avg(ms) | Max(ms) |
|---|---|---|---|---|---|---|
| article cancel | 00:00:00.062 | 0.0% | 179 | 0.000 | 0.346 | 2.000 |
| article cleanup | 00:00:00.081 | 0.0% | 17472 | 0.000 | 0.005 | 0.048 |
| article logging | 00:00:00.541 | 0.0% | 17988 | 0.000 | 0.030 | 0.074 |
| article parse | 00:00:00.223 | 0.0% | 19393 | 0.000 | 0.011 | 0.043 |
| article write | 00:00:09.189 | 0.0% | 17134 | 0.135 | 0.536 | 2.014 |
| artlog/artcncl | 00:00:00.002 | 0.0% | 130 | 0.000 | 0.015 | 0.200 |
| data move | 00:00:00.012 | 0.0% | 21595 | 0.000 | 0.001 | 0.011 |
| hisgrep/artcncl | 00:00:00.008 | 0.0% | 168 | 0.000 | 0.048 | 1.000 |
| hishave/artcncl | 00:00:00.002 | 0.0% | 179 | 0.000 | 0.011 | 0.167 |
| history grep | 00:00:00.000 | 0.0% | 0 | 0.000 | 0.000 | 0.000 |
| history lookup | 00:00:03.466 | 0.0% | 17806 | 0.000 | 0.195 | 1.976 |
| history sync | 00:00:00.022 | 0.0% | 419 | 0.000 | 0.053 | 0.667 |
| history write | 00:00:03.744 | 0.0% | 17472 | 0.011 | 0.214 | 1.047 |
| hiswrite/artcncl | 00:00:00.002 | 0.0% | 11 | 0.000 | 0.182 | 1.000 |
| idle | 24:00:32.776 | 100.0% | 20167 | 2221.696 | 4285.852 | 12256.265 |
| nntp read | 00:00:00.555 | 0.0% | 19825 | 0.000 | 0.028 | 0.068 |
| overview write | 00:00:03.888 | 0.0% | 17134 | 0.032 | 0.227 | 3.180 |
| perl filter | 00:00:11.225 | 0.0% | 17472 | 0.463 | 0.642 | 0.905 |
| python filter | 00:00:00.000 | 0.0% | 0 | 0.000 | 0.000 | 0.000 |
| site send | 00:00:00.382 | 0.0% | 17204 | 0.000 | 0.022 | 0.080 |
| TOTAL: 24:01:09.123 | 24:01:06.180 | 100.0% | - | - | - | - |
INNfeed timer:
| Code region | Time | Pct | Invoked | Min(ms) | Avg(ms) | Max(ms) |
|---|---|---|---|---|---|---|
| article new | 00:00:00.033 | 0.0% | 26667 | 0.000 | 0.001 | 0.017 |
| article prepare | 00:00:00.001 | 0.0% | 672 | 0.000 | 0.001 | 0.250 |
| article read | 00:00:00.032 | 0.0% | 168 | 0.000 | 0.190 | 21.000 |
| backlog stats | 00:00:00.017 | 0.0% | 67125 | 0.000 | 0.000 | 0.008 |
| callbacks | 00:00:00.000 | 0.0% | 0 | 0.000 | 0.000 | 0.000 |
| data read | 00:00:00.282 | 0.0% | 40126 | 0.000 | 0.007 | 0.023 |
| data write | 00:00:00.349 | 0.0% | 21900 | 0.000 | 0.016 | 0.077 |
| idle | 23:57:40.835 | 100.0% | 67125 | 230.903 | 1285.078 | 4056.662 |
| status file | 00:00:00.059 | 0.0% | 154 | 0.000 | 0.383 | 2.000 |
| TOTAL: 23:57:42.203 | 23:57:41.608 | 100.0% | - | - | - | - |
nnrpd timer:
| Code region | Time | Pct | Invoked | Min(ms) | Avg(ms) | Max(ms) |
|---|---|---|---|---|---|---|
| idle | 00:00:01.729 | 0.1% | 2 | 211.000 | 864.500 | 1518.000 |
| newnews | 00:00:00.000 | 0.0% | 0 | 0.000 | 0.000 | 0.000 |
| nntpwrite | 00:00:00.000 | 0.0% | 27 | 0.000 | 0.000 | 0.000 |
| readart | 00:00:00.000 | 0.0% | 2 | 0.000 | 0.000 | 0.000 |
| TOTAL: 00:30:39.491 | 00:00:01.729 | 0.1% | - | - | - | - |
Control commands to INND:
| Command | Number |
|---|---|
| L | 1 |
| flush | 3 |
| flushlogs | 2 |
| go | 2 |
| logmode | 2 |
| mode | 148 |
| name | 2 |
| pause | 2 |
| paused | 2 |
| reload | 2 |
| reserve | 2 |
| TOTAL: 11 | 168 |
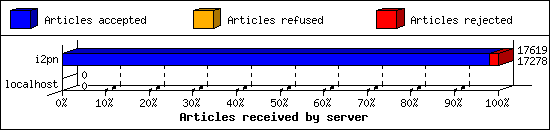
Incoming Feeds (INN):
| Server | Connects | Offered | Taken | Refused | Reject | %Accpt | Elapsed | |
|---|---|---|---|---|---|---|---|---|
| 1 | i2pn | 6 | 17619 | 17278 | 2 | 339 | 98% | 24:53:42 |
| 2 | localhost | 33 | 0 | 0 | 0 | 0 | 0% | 00:00:00 |
| TOTAL: 2 | 39 | 17619 | 17278 | 2 | 339 | 98% | 24:53:42 | |
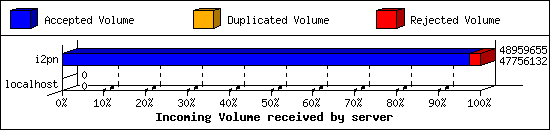
Incoming Volume (INN):
| Server | AcceptVol | DupVol | RejVol | TotalVol | %Acc | Vol/Art | |
|---|---|---|---|---|---|---|---|
| 1 | i2pn | 45.5 MB | 0.0 KB | 1.1 MB | 46.7 MB | 97% | 2.7 KB |
| 2 | localhost | 0.0 KB | 0.0 KB | 0.0 KB | 0.0 KB | 0% | 0 |
| TOTAL: 2 | 45.5 MB | 0.0 KB | 1.1 MB | 46.7 MB | 97% | 2.7 KB | |
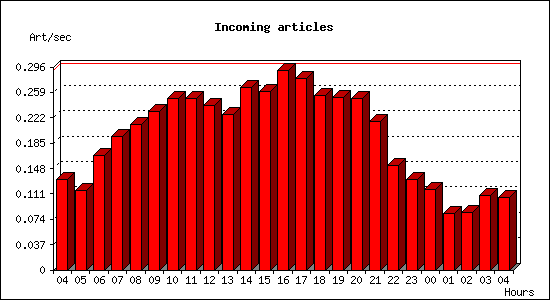
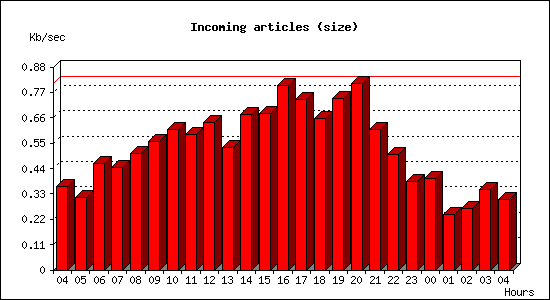
Incoming articles:
| Date | Articles | %Arts | Art/sec | Size | %Size | KB/sec |
|---|---|---|---|---|---|---|
| May 23 04:15:01 - 04:59:59 | 356 | 2.1% | 0.13 | 975.8 KB | 2.1% | 0.36 |
| May 23 05:00:00 - 05:59:59 | 417 | 2.4% | 0.12 | 1.1 MB | 2.5% | 0.32 |
| May 23 06:00:00 - 06:59:59 | 599 | 3.5% | 0.17 | 1.6 MB | 3.6% | 0.46 |
| May 23 07:00:00 - 07:59:59 | 702 | 4.1% | 0.20 | 1.6 MB | 3.5% | 0.44 |
| May 23 08:00:00 - 08:59:59 | 763 | 4.5% | 0.21 | 1.8 MB | 3.9% | 0.51 |
| May 23 09:00:00 - 09:59:59 | 830 | 4.8% | 0.23 | 2.0 MB | 4.3% | 0.56 |
| May 23 10:00:00 - 10:59:59 | 900 | 5.3% | 0.25 | 2.1 MB | 4.7% | 0.61 |
| May 23 11:00:00 - 11:59:59 | 901 | 5.3% | 0.25 | 2.1 MB | 4.6% | 0.59 |
| May 23 12:00:00 - 12:59:59 | 865 | 5.0% | 0.24 | 2.2 MB | 5.0% | 0.64 |
| May 23 13:00:00 - 13:59:59 | 816 | 4.8% | 0.23 | 1.9 MB | 4.1% | 0.53 |
| May 23 14:00:00 - 14:59:59 | 959 | 5.6% | 0.27 | 2.4 MB | 5.2% | 0.67 |
| May 23 15:00:00 - 15:59:59 | 935 | 5.5% | 0.26 | 2.4 MB | 5.3% | 0.68 |
| May 23 16:00:00 - 16:59:59 | 1049 | 6.1% | 0.29 | 2.8 MB | 6.2% | 0.80 |
| May 23 17:00:00 - 17:59:59 | 1004 | 5.9% | 0.28 | 2.6 MB | 5.8% | 0.74 |
| May 23 18:00:00 - 18:59:59 | 914 | 5.3% | 0.25 | 2.3 MB | 5.1% | 0.66 |
| May 23 19:00:00 - 19:59:59 | 908 | 5.3% | 0.25 | 2.6 MB | 5.8% | 0.74 |
| May 23 20:00:00 - 20:59:59 | 901 | 5.3% | 0.25 | 2.8 MB | 6.3% | 0.81 |
| May 23 21:00:00 - 21:59:59 | 778 | 4.5% | 0.22 | 2.1 MB | 4.7% | 0.61 |
| May 23 22:00:00 - 22:59:59 | 550 | 3.2% | 0.15 | 1.8 MB | 3.9% | 0.50 |
| May 23 23:00:00 - 23:59:59 | 475 | 2.8% | 0.13 | 1.4 MB | 3.0% | 0.39 |
| May 24 00:00:00 - 00:59:59 | 424 | 2.5% | 0.12 | 1.4 MB | 3.1% | 0.40 |
| May 24 01:00:00 - 01:59:59 | 299 | 1.7% | 0.08 | 869.2 KB | 1.9% | 0.24 |
| May 24 02:00:00 - 02:59:59 | 302 | 1.8% | 0.08 | 964.8 KB | 2.1% | 0.27 |
| May 24 03:00:00 - 03:59:59 | 389 | 2.3% | 0.11 | 1.2 MB | 2.7% | 0.35 |
| May 24 04:00:00 - 04:15:01 | 95 | 0.6% | 0.11 | 275.2 KB | 0.6% | 0.31 |
| TOTAL: 24:00:00 | 17131 | 100.0% | 0.20 | 45.1 MB | 100.0% | 0.54 |
Sites sending bad articles:
| Server | Total | Group | Dist | Duplic | Unapp | TooOld | Site | Line | Other | |
|---|---|---|---|---|---|---|---|---|---|---|
| 1 | i2pn | 855 | 2 | 0 | 0 | 0 | 0 | 0 | 0 | 853 |
| TOTAL: 1 | 855 | 2 | 0 | 0 | 0 | 0 | 0 | 0 | 853 | |
Unwanted newsgroups [Top 20]:
| Newsgroup | Count |
|---|---|
| hk.politics | 2 |
| TOTAL: 1 | 2 |
INND Perl filter [Top 20]:
| Reason | Count |
|---|---|
| Scoring filter (s5) | 306 |
| Scoring filter (s6) | 22 |
| Scoring filter (n10) | 4 |
| Scoring filter (n6) | 2 |
| Scoring filter (sit1b) | 1 |
| Scoring filter (n11) | 1 |
| TOTAL: 6 | 336 |
NoCeM on Spool:
| Id | Good | Bad | Unique | Total |
|---|---|---|---|---|
| bleachbot@httrack.com | 66 | 0 | 70 | 70 |
| TOTAL: 1 | 66 | 14 | 70 | 70 |
Miscellaneous innd statistics [Top 10]:
| Event | Server | Number |
|---|---|---|
| Including strange strings | ||
| i2pn | 517 | |
| TOTAL: 1 | 517 | |
| TOTAL: 1 | 517 | |
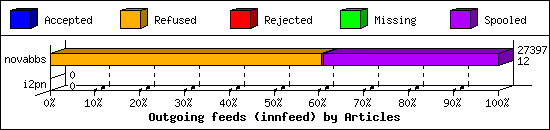
Outgoing Feeds (innfeed) by Articles:
| Server | Offered | Taken | Refused | Reject | Miss | Spool | %Took | Elapsed | |
|---|---|---|---|---|---|---|---|---|---|
| 1 | novabbs | 33982 | 12 | 16577 | 156 | 0 | 10652 | 0% | 23:59:58 |
| 2 | i2pn | 0 | 0 | 0 | 0 | 0 | 0 | 0% | 00:10:00 |
| TOTAL: 2 | 33982 | 12 | 16577 | 156 | 0 | 10652 | 0% | 24:09:58 | |
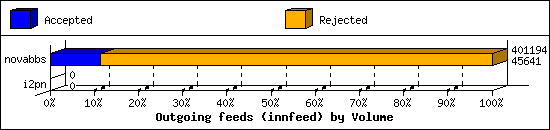
Outgoing Feeds (innfeed) by Volume:
| Server | AcceptVol | RejectVol | TotalVol | Volume/sec | Vol/Art | Elapsed | |
|---|---|---|---|---|---|---|---|
| 1 | novabbs | 44.6 KB | 347.2 KB | 391.8 KB | 0.0 KB/s | 2.3 KB | 23:59:58 |
| 2 | i2pn | 0.0 KB | 0.0 KB | 0.0 KB | 0.0 KB/s | 0 | 00:10:00 |
| TOTAL: 2 | 44.6 KB | 347.2 KB | 391.8 KB | 0.0 KB/s | 2.3 KB | 24:09:58 | |
NNRP readership statistics:
| System | Conn | Arts | Size | Groups | Post | Rej | Elapsed | |
|---|---|---|---|---|---|---|---|---|
| 1 | ip68-2-45-86.ph.ph.cox.net | 2 | 2 | 1.9 KB | 2 | 0 | 0 | 00:30:36 |
| TOTAL: 1 | 2 | 2 | 1.9 KB | 2 | 0 | 0 | 00:30:39 | |
NNRP readership statistics (by domain):
| System | Conn | Arts | Size | Groups | Post | Rej | Elapsed | |
|---|---|---|---|---|---|---|---|---|
| 1 | *.ph.ph.cox.net | 2 | 2 | 1.9 KB | 2 | 0 | 0 | 00:30:36 |
| 2 | unresolved | 1 | 0 | 0.0 KB | 0 | 0 | 0 | 00:00:00 |
| TOTAL: 2 | 3 | 2 | 1.9 KB | 2 | 0 | 0 | 00:30:39 | |
NNRP total resource statistics [Top 20]:
| System | User(ms) | System(ms) | Idle(ms) | Elapsed |
|---|---|---|---|---|
| ip68-2-45-86.ph.ph.cox.net | 0.108 | 0.032 | 0.000 | 00:30:36 |
| ? | 0.088 | 0.008 | 0.000 | 00:00:02 |
| 117.50.6.201 | 0.048 | 0.000 | 0.000 | 00:00:00 |
| TOTAL: 3 | 0.244 | 0.040 | 0.000 | 00:30:39 |
Curious NNRP server explorers [Top 20]:
| System | Conn |
|---|---|
| 117.50.6.201 | 1 |
| TOTAL: 1 | 1 |
Newsgroup request counts (by category):
| Category | Count | Pct | |
|---|---|---|---|
| 1 | rocksolid | 2 | 100.0% |
| TOTAL: 1 | 2 | 100.0% | |
Newsgroup request counts (by newsgroup) [Top 100]:
| Newsgroup | Count | |
|---|---|---|
| 1 | rocksolid.shared.test | 2 |
| TOTAL: 1 | 2 | |
