Log entries by program:
| Program name | Lines | %Lines | Size | %Size |
|---|---|---|---|---|
| inn | 16054 | 83.5% | 1.3 MB | 79.4% |
| nnrpd | 1315 | 6.8% | 106.6 KB | 6.3% |
| innd | 1176 | 6.1% | 164.9 KB | 9.7% |
| innfeed | 607 | 3.2% | 71.7 KB | 4.2% |
| nocem | 66 | 0.3% | 7.5 KB | 0.4% |
| controlchan | 1 | 0.0% | 0.1 KB | 0.0% |
| TOTAL: 6 | 19219 | 100.0% | 1.7 MB | 100.0% |
History cache:
| Reason | Count | %Count |
|---|---|---|
| Do not exist | 15612 | 98.4% |
| Negative hits | 144 | 0.9% |
| Positive hits | 95 | 0.6% |
| Cache misses | 12 | 0.1% |
| TOTAL: 4 | 15863 | 100.0% |
INND timer:
| Code region | Time | Pct | Invoked | Min(ms) | Avg(ms) | Max(ms) |
|---|---|---|---|---|---|---|
| article cancel | 00:00:00.040 | 0.0% | 129 | 0.000 | 0.310 | 4.000 |
| article cleanup | 00:00:00.090 | 0.0% | 15645 | 0.000 | 0.006 | 0.033 |
| article logging | 00:00:00.487 | 0.0% | 15967 | 0.000 | 0.031 | 0.072 |
| article parse | 00:00:00.212 | 0.0% | 17773 | 0.000 | 0.012 | 0.056 |
| article write | 00:00:05.687 | 0.0% | 15513 | 0.118 | 0.367 | 8.122 |
| artlog/artcncl | 00:00:00.000 | 0.0% | 80 | 0.000 | 0.000 | 0.000 |
| data move | 00:00:00.016 | 0.0% | 19893 | 0.000 | 0.001 | 0.014 |
| hisgrep/artcncl | 00:00:00.007 | 0.0% | 116 | 0.000 | 0.060 | 1.000 |
| hishave/artcncl | 00:00:00.000 | 0.0% | 129 | 0.000 | 0.000 | 0.000 |
| history grep | 00:00:00.000 | 0.0% | 0 | 0.000 | 0.000 | 0.000 |
| history lookup | 00:00:01.222 | 0.0% | 15796 | 0.000 | 0.077 | 1.400 |
| history sync | 00:00:00.013 | 0.0% | 323 | 0.000 | 0.040 | 1.000 |
| history write | 00:00:02.878 | 0.0% | 15645 | 0.000 | 0.184 | 1.200 |
| hiswrite/artcncl | 00:00:00.002 | 0.0% | 13 | 0.000 | 0.154 | 1.000 |
| idle | 24:00:04.638 | 100.0% | 18588 | 2352.110 | 4648.410 | 17665.882 |
| nntp read | 00:00:00.461 | 0.0% | 18013 | 0.000 | 0.026 | 0.067 |
| overview write | 00:00:02.986 | 0.0% | 15513 | 0.039 | 0.192 | 1.795 |
| perl filter | 00:00:09.593 | 0.0% | 15645 | 0.492 | 0.613 | 1.079 |
| python filter | 00:00:00.000 | 0.0% | 0 | 0.000 | 0.000 | 0.000 |
| site send | 00:00:00.305 | 0.0% | 15568 | 0.000 | 0.020 | 0.100 |
| TOTAL: 24:00:31.365 | 24:00:28.637 | 100.0% | - | - | - | - |
INNfeed timer:
| Code region | Time | Pct | Invoked | Min(ms) | Avg(ms) | Max(ms) |
|---|---|---|---|---|---|---|
| article new | 00:00:00.024 | 0.0% | 15495 | 0.000 | 0.002 | 0.022 |
| article prepare | 00:00:00.000 | 0.0% | 388 | 0.000 | 0.000 | 0.000 |
| article read | 00:00:00.026 | 0.0% | 97 | 0.000 | 0.268 | 22.000 |
| backlog stats | 00:00:00.017 | 0.0% | 51085 | 0.000 | 0.000 | 0.006 |
| callbacks | 00:00:00.000 | 0.0% | 0 | 0.000 | 0.000 | 0.000 |
| data read | 00:00:00.191 | 0.0% | 31115 | 0.000 | 0.006 | 0.028 |
| data write | 00:00:00.206 | 0.0% | 15633 | 0.000 | 0.013 | 0.059 |
| idle | 23:56:43.078 | 100.0% | 51085 | 994.522 | 1687.444 | 4604.763 |
| status file | 00:00:00.054 | 0.0% | 156 | 0.000 | 0.346 | 1.000 |
| TOTAL: 23:56:44.034 | 23:56:43.596 | 100.0% | - | - | - | - |
nnrpd timer:
| Code region | Time | Pct | Invoked | Min(ms) | Avg(ms) | Max(ms) |
|---|---|---|---|---|---|---|
| idle | 00:00:46.822 | 52.8% | 2418 | 6.833 | 19.364 | 26.446 |
| newnews | 00:00:00.000 | 0.0% | 0 | 0.000 | 0.000 | 0.000 |
| nntpwrite | 00:00:00.089 | 0.1% | 8235 | 0.000 | 0.011 | 0.143 |
| TOTAL: 00:01:28.700 | 00:00:46.911 | 52.9% | - | - | - | - |
Control commands to INND:
| Command | Number |
|---|---|
| L | 1 |
| flush | 3 |
| flushlogs | 2 |
| go | 2 |
| logmode | 2 |
| mode | 148 |
| name | 2 |
| pause | 2 |
| paused | 2 |
| reload | 2 |
| reserve | 2 |
| TOTAL: 11 | 168 |
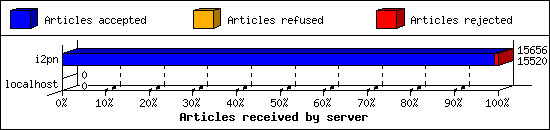
Incoming Feeds (INN):
| Server | Connects | Offered | Taken | Refused | Reject | %Accpt | Elapsed | |
|---|---|---|---|---|---|---|---|---|
| 1 | i2pn | 5 | 15656 | 15520 | 0 | 136 | 99% | 24:32:11 |
| 2 | localhost | 31 | 0 | 0 | 0 | 0 | 0% | 00:00:00 |
| TOTAL: 2 | 36 | 15656 | 15520 | 0 | 136 | 99% | 24:32:11 | |
Incoming Volume (INN):
| Server | AcceptVol | DupVol | RejVol | TotalVol | %Acc | Vol/Art | |
|---|---|---|---|---|---|---|---|
| 1 | i2pn | 41.7 MB | 0.0 KB | 1.4 MB | 43.1 MB | 96% | 2.8 KB |
| 2 | localhost | 0.0 KB | 0.0 KB | 0.0 KB | 0.0 KB | 0% | 0 |
| TOTAL: 2 | 41.7 MB | 0.0 KB | 1.4 MB | 43.1 MB | 96% | 2.8 KB | |

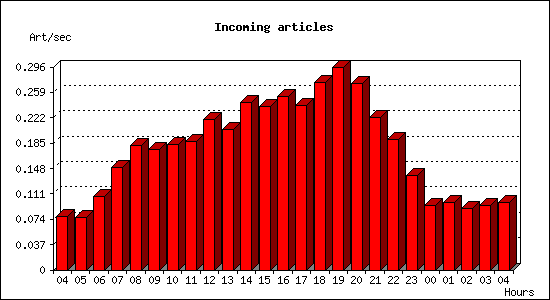
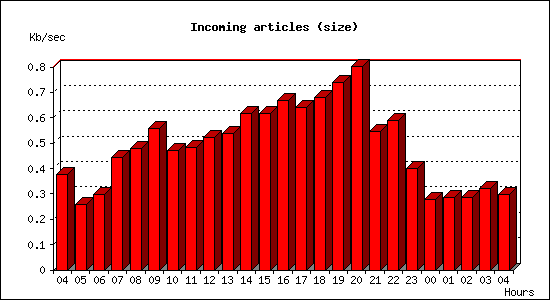
Incoming articles:
| Date | Articles | %Arts | Art/sec | Size | %Size | KB/sec |
|---|---|---|---|---|---|---|
| May 26 04:15:02 - 04:59:59 | 212 | 1.4% | 0.08 | 1017.3 KB | 2.4% | 0.38 |
| May 26 05:00:00 - 05:59:59 | 278 | 1.8% | 0.08 | 926.6 KB | 2.2% | 0.26 |
| May 26 06:00:00 - 06:59:59 | 385 | 2.5% | 0.11 | 1.0 MB | 2.5% | 0.30 |
| May 26 07:00:00 - 07:59:59 | 539 | 3.5% | 0.15 | 1.6 MB | 3.7% | 0.44 |
| May 26 08:00:00 - 08:59:59 | 656 | 4.2% | 0.18 | 1.7 MB | 4.0% | 0.48 |
| May 26 09:00:00 - 09:59:59 | 630 | 4.1% | 0.17 | 2.0 MB | 4.7% | 0.56 |
| May 26 10:00:00 - 10:59:59 | 659 | 4.2% | 0.18 | 1.7 MB | 4.0% | 0.47 |
| May 26 11:00:00 - 11:59:59 | 673 | 4.3% | 0.19 | 1.7 MB | 4.1% | 0.48 |
| May 26 12:00:00 - 12:59:59 | 789 | 5.1% | 0.22 | 1.8 MB | 4.4% | 0.52 |
| May 26 13:00:00 - 13:59:59 | 740 | 4.8% | 0.21 | 1.9 MB | 4.5% | 0.54 |
| May 26 14:00:00 - 14:59:59 | 879 | 5.7% | 0.24 | 2.2 MB | 5.2% | 0.62 |
| May 26 15:00:00 - 15:59:59 | 857 | 5.5% | 0.24 | 2.2 MB | 5.2% | 0.61 |
| May 26 16:00:00 - 16:59:59 | 910 | 5.9% | 0.25 | 2.4 MB | 5.6% | 0.67 |
| May 26 17:00:00 - 17:59:59 | 866 | 5.6% | 0.24 | 2.2 MB | 5.4% | 0.64 |
| May 26 18:00:00 - 18:59:59 | 982 | 6.3% | 0.27 | 2.4 MB | 5.7% | 0.68 |
| May 26 19:00:00 - 19:59:59 | 1062 | 6.8% | 0.29 | 2.6 MB | 6.2% | 0.74 |
| May 26 20:00:00 - 20:59:59 | 980 | 6.3% | 0.27 | 2.8 MB | 6.7% | 0.80 |
| May 26 21:00:00 - 21:59:59 | 801 | 5.2% | 0.22 | 1.9 MB | 4.6% | 0.55 |
| May 26 22:00:00 - 22:59:59 | 687 | 4.4% | 0.19 | 2.1 MB | 5.0% | 0.59 |
| May 26 23:00:00 - 23:59:59 | 496 | 3.2% | 0.14 | 1.4 MB | 3.4% | 0.40 |
| May 27 00:00:00 - 00:59:59 | 338 | 2.2% | 0.09 | 1004.0 KB | 2.3% | 0.28 |
| May 27 01:00:00 - 01:59:59 | 352 | 2.3% | 0.10 | 1023.1 KB | 2.4% | 0.28 |
| May 27 02:00:00 - 02:59:59 | 324 | 2.1% | 0.09 | 1.0 MB | 2.4% | 0.28 |
| May 27 03:00:00 - 03:59:59 | 336 | 2.2% | 0.09 | 1.1 MB | 2.7% | 0.32 |
| May 27 04:00:00 - 04:15:01 | 89 | 0.6% | 0.10 | 266.3 KB | 0.6% | 0.30 |
| TOTAL: 23:59:59 | 15520 | 100.0% | 0.18 | 41.7 MB | 100.0% | 0.49 |
Sites sending bad articles:
| Server | Total | Group | Dist | Duplic | Unapp | TooOld | Site | Line | Other | |
|---|---|---|---|---|---|---|---|---|---|---|
| 1 | i2pn | 457 | 11 | 0 | 0 | 0 | 0 | 0 | 0 | 446 |
| TOTAL: 1 | 457 | 11 | 0 | 0 | 0 | 0 | 0 | 0 | 446 | |
Unwanted newsgroups [Top 20]:
| Newsgroup | Count |
|---|---|
| alt.pl.nieruchomosci.gielda | 10 |
| alt.jokes | 1 |
| TOTAL: 2 | 11 |
INND Perl filter [Top 20]:
| Reason | Count |
|---|---|
| Scoring filter (s5) | 48 |
| Scoring filter (s6) | 47 |
| Scoring filter (s7) | 17 |
| Scoring filter (n4) | 12 |
| Scoring filter (n6) | 1 |
| TOTAL: 5 | 125 |
NoCeM on Spool:
| Id | Good | Bad | Unique | Total |
|---|---|---|---|---|
| bleachbot@httrack.com | 56 | 0 | 57 | 57 |
| TOTAL: 1 | 56 | 4 | 57 | 57 |
Miscellaneous innd statistics [Top 10]:
| Event | Server | Number |
|---|---|---|
| Including strange strings | ||
| i2pn | 321 | |
| TOTAL: 1 | 321 | |
| TOTAL: 1 | 321 | |
Outgoing Feeds (innfeed) by Articles:
| Server | Offered | Taken | Refused | Reject | Miss | Spool | %Took | Elapsed | |
|---|---|---|---|---|---|---|---|---|---|
| 1 | novabbs | 15546 | 1 | 15418 | 96 | 0 | 0 | 0% | 23:59:43 |
| 2 | i2pn | 0 | 0 | 0 | 0 | 0 | 0 | 0% | 00:10:00 |
| TOTAL: 2 | 15546 | 1 | 15418 | 96 | 0 | 0 | 0% | 24:09:43 | |

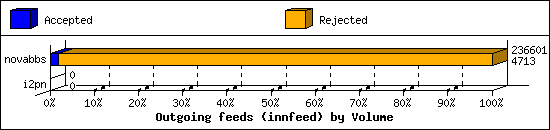
Outgoing Feeds (innfeed) by Volume:
| Server | AcceptVol | RejectVol | TotalVol | Volume/sec | Vol/Art | Elapsed | |
|---|---|---|---|---|---|---|---|
| 1 | novabbs | 4.6 KB | 226.5 KB | 231.1 KB | 0.0 KB/s | 2.4 KB | 23:59:43 |
| 2 | i2pn | 0.0 KB | 0.0 KB | 0.0 KB | 0.0 KB/s | 0 | 00:10:00 |
| TOTAL: 2 | 4.6 KB | 226.5 KB | 231.1 KB | 0.0 KB/s | 2.4 KB | 24:09:43 | |
NNRP readership statistics:
| System | Conn | Arts | Size | Groups | Post | Rej | Elapsed | |
|---|---|---|---|---|---|---|---|---|
| 1 | i2pn2.org | 167 | 0 | 0.0 KB | 0 | 0 | 0 | 00:01:28 |
| TOTAL: 1 | 167 | 0 | 0.0 KB | 0 | 0 | 0 | 00:01:28 | |
NNRP readership statistics (by domain):
| System | Conn | Arts | Size | Groups | Post | Rej | Elapsed | |
|---|---|---|---|---|---|---|---|---|
| 1 | *.org | 167 | 0 | 0.0 KB | 0 | 0 | 0 | 00:01:28 |
| TOTAL: 1 | 167 | 0 | 0.0 KB | 0 | 0 | 0 | 00:01:28 | |
NNRP auth users [Top 20]:
| User | Conn |
|---|---|
| AnonUser | 167 |
| TOTAL: 1 | 167 |
NNRP total resource statistics [Top 20]:
| System | User(ms) | System(ms) | Idle(ms) | Elapsed |
|---|---|---|---|---|
| i2pn2.org | 9.736 | 1.420 | 16.267 | 00:01:28 |
| TOTAL: 1 | 9.736 | 1.420 | 16.267 | 00:01:28 |
