Log entries by program:
| Program name | Lines | %Lines | Size | %Size |
|---|---|---|---|---|
| inn | 17829 | 89.8% | 1.5 MB | 84.7% |
| innd | 1332 | 6.7% | 183.1 KB | 10.4% |
| innfeed | 600 | 3.0% | 75.5 KB | 4.3% |
| nocem | 69 | 0.3% | 7.6 KB | 0.4% |
| nnrpd | 15 | 0.1% | 1.7 KB | 0.1% |
| controlchan | 1 | 0.0% | 0.0 KB | 0.0% |
| TOTAL: 6 | 19846 | 100.0% | 1.7 MB | 100.0% |
History cache:
| Reason | Count | %Count |
|---|---|---|
| Do not exist | 17405 | 96.1% |
| Negative hits | 619 | 3.4% |
| Positive hits | 79 | 0.4% |
| Cache misses | 11 | 0.1% |
| TOTAL: 4 | 18114 | 100.0% |
INND timer:
| Code region | Time | Pct | Invoked | Min(ms) | Avg(ms) | Max(ms) |
|---|---|---|---|---|---|---|
| article cancel | 00:00:00.023 | 0.0% | 113 | 0.000 | 0.204 | 1.500 |
| article cleanup | 00:00:00.103 | 0.0% | 17442 | 0.000 | 0.006 | 0.035 |
| article logging | 00:00:00.492 | 0.0% | 17777 | 0.000 | 0.028 | 0.069 |
| article parse | 00:00:00.266 | 0.0% | 19735 | 0.000 | 0.013 | 0.038 |
| article write | 00:00:04.494 | 0.0% | 17174 | 0.083 | 0.262 | 3.020 |
| artlog/artcncl | 00:00:00.000 | 0.0% | 66 | 0.000 | 0.000 | 0.000 |
| data move | 00:00:00.008 | 0.0% | 22361 | 0.000 | 0.000 | 0.013 |
| hisgrep/artcncl | 00:00:00.000 | 0.0% | 99 | 0.000 | 0.000 | 0.000 |
| hishave/artcncl | 00:00:00.001 | 0.0% | 113 | 0.000 | 0.009 | 0.500 |
| history grep | 00:00:00.000 | 0.0% | 0 | 0.000 | 0.000 | 0.000 |
| history lookup | 00:00:00.150 | 0.0% | 18063 | 0.000 | 0.008 | 0.475 |
| history sync | 00:00:00.015 | 0.0% | 408 | 0.000 | 0.037 | 1.000 |
| history write | 00:00:00.742 | 0.0% | 17442 | 0.000 | 0.043 | 0.608 |
| hiswrite/artcncl | 00:00:00.000 | 0.0% | 14 | 0.000 | 0.000 | 0.000 |
| idle | 24:00:42.520 | 100.0% | 20783 | 1787.345 | 4159.290 | 13050.022 |
| nntp read | 00:00:00.546 | 0.0% | 20453 | 0.000 | 0.027 | 0.097 |
| overview write | 00:00:04.682 | 0.0% | 17174 | 0.042 | 0.273 | 3.966 |
| perl filter | 00:00:10.963 | 0.0% | 17442 | 0.460 | 0.629 | 1.443 |
| python filter | 00:00:00.000 | 0.0% | 0 | 0.000 | 0.000 | 0.000 |
| site send | 00:00:00.383 | 0.0% | 17235 | 0.000 | 0.022 | 0.078 |
| TOTAL: 24:01:09.060 | 24:01:05.388 | 100.0% | - | - | - | - |
INNfeed timer:
| Code region | Time | Pct | Invoked | Min(ms) | Avg(ms) | Max(ms) |
|---|---|---|---|---|---|---|
| article new | 00:00:00.026 | 0.0% | 17154 | 0.000 | 0.002 | 0.016 |
| article prepare | 00:00:00.000 | 0.0% | 884 | 0.000 | 0.000 | 0.000 |
| article read | 00:00:00.033 | 0.0% | 221 | 0.000 | 0.149 | 12.000 |
| backlog stats | 00:00:00.014 | 0.0% | 56460 | 0.000 | 0.000 | 0.006 |
| callbacks | 00:00:00.000 | 0.0% | 0 | 0.000 | 0.000 | 0.000 |
| data read | 00:00:00.220 | 0.0% | 34599 | 0.000 | 0.006 | 0.031 |
| data write | 00:00:00.234 | 0.0% | 17468 | 0.000 | 0.013 | 0.070 |
| idle | 23:58:12.441 | 100.0% | 56460 | 805.610 | 1528.382 | 4012.413 |
| status file | 00:00:00.043 | 0.0% | 152 | 0.000 | 0.283 | 1.000 |
| TOTAL: 23:58:13.490 | 23:58:13.011 | 100.0% | - | - | - | - |
nnrpd timer:
| Code region | Time | Pct | Invoked | Min(ms) | Avg(ms) | Max(ms) |
|---|---|---|---|---|---|---|
| idle | 00:00:10.224 | 92.6% | 4 | 84.000 | 2556.000 | 9826.000 |
| newnews | 00:00:00.000 | 0.0% | 0 | 0.000 | 0.000 | 0.000 |
| nntpwrite | 00:00:00.001 | 0.0% | 15 | 0.000 | 0.067 | 0.500 |
| TOTAL: 00:00:11.045 | 00:00:10.225 | 92.6% | - | - | - | - |
Control commands to INND:
| Command | Number |
|---|---|
| L | 1 |
| flush | 3 |
| flushlogs | 2 |
| go | 2 |
| logmode | 2 |
| mode | 148 |
| name | 2 |
| pause | 2 |
| paused | 2 |
| reload | 2 |
| reserve | 2 |
| TOTAL: 11 | 168 |
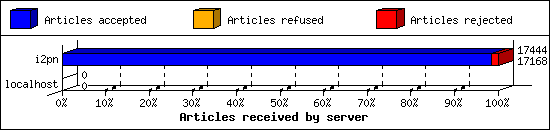
Incoming Feeds (INN):
| Server | Connects | Offered | Taken | Refused | Reject | %Accpt | Elapsed | |
|---|---|---|---|---|---|---|---|---|
| 1 | i2pn | 6 | 17444 | 17168 | 7 | 269 | 98% | 24:39:18 |
| 2 | localhost | 31 | 0 | 0 | 0 | 0 | 0% | 00:00:00 |
| TOTAL: 2 | 37 | 17444 | 17168 | 7 | 269 | 98% | 24:39:18 | |
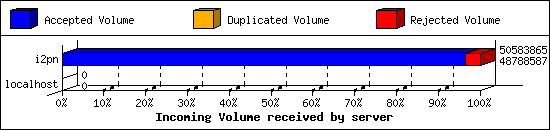
Incoming Volume (INN):
| Server | AcceptVol | DupVol | RejVol | TotalVol | %Acc | Vol/Art | |
|---|---|---|---|---|---|---|---|
| 1 | i2pn | 46.5 MB | 0.0 KB | 1.7 MB | 48.2 MB | 96% | 2.8 KB |
| 2 | localhost | 0.0 KB | 0.0 KB | 0.0 KB | 0.0 KB | 0% | 0 |
| TOTAL: 2 | 46.5 MB | 0.0 KB | 1.7 MB | 48.2 MB | 96% | 2.8 KB | |
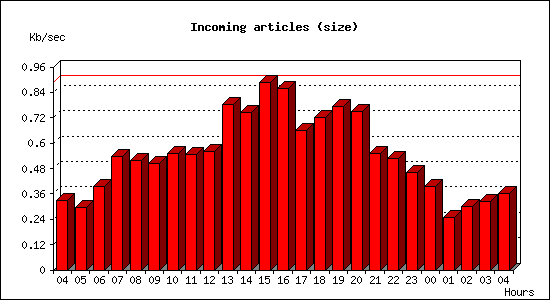
Incoming articles:
| Date | Articles | %Arts | Art/sec | Size | %Size | KB/sec |
|---|---|---|---|---|---|---|
| May 28 04:15:02 - 04:59:59 | 291 | 1.7% | 0.11 | 881.8 KB | 1.9% | 0.33 |
| May 28 05:00:00 - 05:59:59 | 401 | 2.3% | 0.11 | 1.0 MB | 2.2% | 0.30 |
| May 28 06:00:00 - 06:59:59 | 527 | 3.1% | 0.15 | 1.4 MB | 3.0% | 0.39 |
| May 28 07:00:00 - 07:59:59 | 774 | 4.5% | 0.21 | 1.9 MB | 4.1% | 0.54 |
| May 28 08:00:00 - 08:59:59 | 737 | 4.3% | 0.20 | 1.8 MB | 3.9% | 0.52 |
| May 28 09:00:00 - 09:59:59 | 806 | 4.7% | 0.22 | 1.8 MB | 3.8% | 0.50 |
| May 28 10:00:00 - 10:59:59 | 812 | 4.7% | 0.23 | 1.9 MB | 4.2% | 0.55 |
| May 28 11:00:00 - 11:59:59 | 774 | 4.5% | 0.21 | 1.9 MB | 4.1% | 0.55 |
| May 28 12:00:00 - 12:59:59 | 794 | 4.6% | 0.22 | 2.0 MB | 4.2% | 0.56 |
| May 28 13:00:00 - 13:59:59 | 957 | 5.6% | 0.27 | 2.8 MB | 5.9% | 0.78 |
| May 28 14:00:00 - 14:59:59 | 874 | 5.1% | 0.24 | 2.6 MB | 5.6% | 0.74 |
| May 28 15:00:00 - 15:59:59 | 1037 | 6.0% | 0.29 | 3.1 MB | 6.7% | 0.89 |
| May 28 16:00:00 - 16:59:59 | 1076 | 6.3% | 0.30 | 3.0 MB | 6.5% | 0.86 |
| May 28 17:00:00 - 17:59:59 | 929 | 5.4% | 0.26 | 2.3 MB | 5.0% | 0.66 |
| May 28 18:00:00 - 18:59:59 | 1032 | 6.0% | 0.29 | 2.5 MB | 5.5% | 0.72 |
| May 28 19:00:00 - 19:59:59 | 969 | 5.6% | 0.27 | 2.7 MB | 5.9% | 0.77 |
| May 28 20:00:00 - 20:59:59 | 878 | 5.1% | 0.24 | 2.6 MB | 5.7% | 0.75 |
| May 28 21:00:00 - 21:59:59 | 778 | 4.5% | 0.22 | 1.9 MB | 4.2% | 0.55 |
| May 28 22:00:00 - 22:59:59 | 613 | 3.6% | 0.17 | 1.9 MB | 4.0% | 0.53 |
| May 28 23:00:00 - 23:59:59 | 559 | 3.3% | 0.16 | 1.6 MB | 3.5% | 0.46 |
| May 29 00:00:00 - 00:59:59 | 457 | 2.7% | 0.13 | 1.4 MB | 3.0% | 0.39 |
| May 29 01:00:00 - 01:59:59 | 319 | 1.9% | 0.09 | 900.9 KB | 1.9% | 0.25 |
| May 29 02:00:00 - 02:59:59 | 325 | 1.9% | 0.09 | 1.1 MB | 2.3% | 0.30 |
| May 29 03:00:00 - 03:59:59 | 349 | 2.0% | 0.10 | 1.1 MB | 2.5% | 0.33 |
| May 29 04:00:00 - 04:15:01 | 100 | 0.6% | 0.11 | 327.7 KB | 0.7% | 0.36 |
| TOTAL: 23:59:59 | 17168 | 100.0% | 0.20 | 46.5 MB | 100.0% | 0.55 |

Sites sending bad articles:
| Server | Total | Group | Dist | Duplic | Unapp | TooOld | Site | Line | Other | |
|---|---|---|---|---|---|---|---|---|---|---|
| 1 | i2pn | 598 | 1 | 0 | 0 | 0 | 0 | 0 | 0 | 597 |
| TOTAL: 1 | 598 | 1 | 0 | 0 | 0 | 0 | 0 | 0 | 597 | |
Unwanted newsgroups [Top 20]:
| Newsgroup | Count |
|---|---|
| manse.ostan-myyn | 1 |
| TOTAL: 1 | 1 |
INND Perl filter [Top 20]:
| Reason | Count |
|---|---|
| Scoring filter (s5) | 217 |
| Scoring filter (s6) | 40 |
| Scoring filter (n4) | 4 |
| Scoring filter (n11) | 4 |
| Scoring filter (n6) | 3 |
| TOTAL: 5 | 268 |
NoCeM on Spool:
| Id | Good | Bad | Unique | Total |
|---|---|---|---|---|
| bleachbot@httrack.com | 51 | 0 | 52 | 52 |
| TOTAL: 1 | 51 | 12 | 52 | 52 |
Miscellaneous innd statistics [Top 10]:
| Event | Server | Number |
|---|---|---|
| Including strange strings | ||
| i2pn | 329 | |
| TOTAL: 1 | 329 | |
| TOTAL: 1 | 329 | |
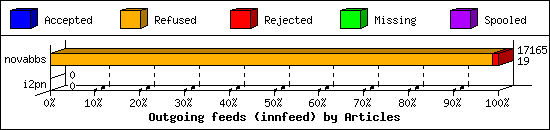
Outgoing Feeds (innfeed) by Articles:
| Server | Offered | Taken | Refused | Reject | Miss | Spool | %Took | Elapsed | |
|---|---|---|---|---|---|---|---|---|---|
| 1 | novabbs | 17257 | 19 | 16944 | 202 | 0 | 0 | 0% | 23:59:57 |
| 2 | i2pn | 0 | 0 | 0 | 0 | 0 | 0 | 0% | 00:10:00 |
| TOTAL: 2 | 17257 | 19 | 16944 | 202 | 0 | 0 | 0% | 24:09:57 | |
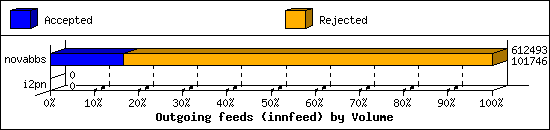
Outgoing Feeds (innfeed) by Volume:
| Server | AcceptVol | RejectVol | TotalVol | Volume/sec | Vol/Art | Elapsed | |
|---|---|---|---|---|---|---|---|
| 1 | novabbs | 99.4 KB | 498.8 KB | 598.1 KB | 0.0 KB/s | 2.7 KB | 23:59:57 |
| 2 | i2pn | 0.0 KB | 0.0 KB | 0.0 KB | 0.0 KB/s | 0 | 00:10:00 |
| TOTAL: 2 | 99.4 KB | 498.8 KB | 598.1 KB | 0.0 KB/s | 2.7 KB | 24:09:57 | |
NNRP readership statistics:
| System | Conn | Arts | Size | Groups | Post | Rej | Elapsed | |
|---|---|---|---|---|---|---|---|---|
| 1 | 71.6.199.23 | 1 | 0 | 0.0 KB | 0 | 0 | 0 | 00:00:00 |
| 2 | 107.170.194.187 | 1 | 0 | 0.0 KB | 0 | 0 | 0 | 00:00:09 |
| 3 | scan-141.security.ipip.net | 1 | 0 | 0.0 KB | 0 | 0 | 0 | 00:00:00 |
| TOTAL: 3 | 3 | 0 | 0.0 KB | 0 | 0 | 0 | 00:00:11 | |
NNRP readership statistics (by domain):
| System | Conn | Arts | Size | Groups | Post | Rej | Elapsed | |
|---|---|---|---|---|---|---|---|---|
| 1 | *.security.ipip.net | 1 | 0 | 0.0 KB | 0 | 0 | 0 | 00:00:00 |
| 2 | unresolved | 2 | 0 | 0.0 KB | 0 | 0 | 0 | 00:00:10 |
| TOTAL: 2 | 3 | 0 | 0.0 KB | 0 | 0 | 0 | 00:00:11 | |
NNRP total resource statistics [Top 20]:
| System | User(ms) | System(ms) | Idle(ms) | Elapsed |
|---|---|---|---|---|
| 107.170.194.187 | 0.048 | 0.004 | 0.000 | 00:00:09 |
| scan-141.security.ipip.net | 0.044 | 0.008 | 0.000 | 00:00:00 |
| 71.6.199.23 | 0.040 | 0.016 | 0.000 | 00:00:00 |
| TOTAL: 3 | 0.132 | 0.028 | 0.000 | 00:00:11 |
NNRP unrecognized commands (by host):
| System | Conn |
|---|---|
| scan-141.security.ipip.net | 4 |
| TOTAL: 1 | 4 |
NNRP unrecognized commands (by command):
| Command | Count |
|---|---|
| Connection: close | 1 |
| GET / HTTP/1.1 | 1 |
| Host: 157.230.63.40:119 | 1 |
| User-Agent: HTTP Banner Detection (https... | 1 |
| TOTAL: 4 | 4 |
