Log entries by program:
| Program name | Lines | %Lines | Size | %Size |
|---|---|---|---|---|
| inn | 17888 | 90.0% | 1.5 MB | 85.1% |
| innd | 1293 | 6.5% | 179.7 KB | 10.2% |
| innfeed | 615 | 3.1% | 74.5 KB | 4.2% |
| nocem | 67 | 0.3% | 7.2 KB | 0.4% |
| nnrpd | 6 | 0.0% | 0.5 KB | 0.0% |
| controlchan | 1 | 0.0% | 0.0 KB | 0.0% |
| TOTAL: 6 | 19870 | 100.0% | 1.7 MB | 100.0% |
History cache:
| Reason | Count | %Count |
|---|---|---|
| Do not exist | 17371 | 95.0% |
| Negative hits | 821 | 4.5% |
| Positive hits | 82 | 0.4% |
| Cache misses | 18 | 0.1% |
| TOTAL: 4 | 18292 | 100.0% |
INND timer:
| Code region | Time | Pct | Invoked | Min(ms) | Avg(ms) | Max(ms) |
|---|---|---|---|---|---|---|
| article cancel | 00:00:00.151 | 0.0% | 121 | 0.000 | 1.248 | 15.429 |
| article cleanup | 00:00:00.110 | 0.0% | 17419 | 0.000 | 0.006 | 0.028 |
| article logging | 00:00:00.481 | 0.0% | 17798 | 0.000 | 0.027 | 0.070 |
| article parse | 00:00:00.234 | 0.0% | 19815 | 0.000 | 0.012 | 0.043 |
| article write | 00:00:05.980 | 0.0% | 17175 | 0.127 | 0.348 | 4.056 |
| artlog/artcncl | 00:00:00.001 | 0.0% | 96 | 0.000 | 0.010 | 0.250 |
| data move | 00:00:00.006 | 0.0% | 22912 | 0.000 | 0.000 | 0.007 |
| hisgrep/artcncl | 00:00:00.057 | 0.0% | 109 | 0.000 | 0.523 | 7.571 |
| hishave/artcncl | 00:00:00.000 | 0.0% | 121 | 0.000 | 0.000 | 0.000 |
| history grep | 00:00:00.000 | 0.0% | 0 | 0.000 | 0.000 | 0.000 |
| history lookup | 00:00:00.078 | 0.0% | 18256 | 0.000 | 0.004 | 0.022 |
| history sync | 00:00:00.018 | 0.0% | 416 | 0.000 | 0.043 | 0.667 |
| history write | 00:00:02.592 | 0.0% | 17419 | 0.000 | 0.149 | 6.709 |
| hiswrite/artcncl | 00:00:00.001 | 0.0% | 12 | 0.000 | 0.083 | 0.500 |
| idle | 24:00:40.394 | 100.0% | 21052 | 2213.576 | 4106.042 | 16222.784 |
| nntp read | 00:00:00.514 | 0.0% | 20720 | 0.000 | 0.025 | 0.082 |
| overview write | 00:00:02.792 | 0.0% | 17175 | 0.026 | 0.163 | 2.015 |
| perl filter | 00:00:10.930 | 0.0% | 17419 | 0.471 | 0.627 | 0.850 |
| python filter | 00:00:00.000 | 0.0% | 0 | 0.000 | 0.000 | 0.000 |
| site send | 00:00:00.384 | 0.0% | 17231 | 0.000 | 0.022 | 0.087 |
| TOTAL: 24:01:07.416 | 24:01:04.723 | 100.0% | - | - | - | - |
INNfeed timer:
| Code region | Time | Pct | Invoked | Min(ms) | Avg(ms) | Max(ms) |
|---|---|---|---|---|---|---|
| article new | 00:00:00.046 | 0.0% | 71951 | 0.000 | 0.001 | 0.025 |
| article prepare | 00:00:00.000 | 0.0% | 6900 | 0.000 | 0.000 | 0.000 |
| article read | 00:00:00.074 | 0.0% | 1728 | 0.000 | 0.043 | 7.333 |
| backlog stats | 00:00:00.021 | 0.0% | 86243 | 0.000 | 0.000 | 0.005 |
| callbacks | 00:00:00.000 | 0.0% | 3 | 0.000 | 0.000 | 0.000 |
| data read | 00:00:00.279 | 0.0% | 51254 | 0.000 | 0.005 | 0.019 |
| data write | 00:00:00.362 | 0.0% | 32711 | 0.000 | 0.011 | 0.058 |
| idle | 23:58:13.811 | 100.0% | 86243 | 84.509 | 1000.589 | 5024.008 |
| status file | 00:00:00.040 | 0.0% | 160 | 0.000 | 0.250 | 1.000 |
| TOTAL: 23:58:15.436 | 23:58:14.633 | 100.0% | - | - | - | - |
nnrpd timer:
| Code region | Time | Pct | Invoked | Min(ms) | Avg(ms) | Max(ms) |
|---|---|---|---|---|---|---|
| idle | 00:30:00.099 | 100.0% | 2 | 900049.500 | 900049.500 | 900049.500 |
| newnews | 00:00:00.000 | 0.0% | 0 | 0.000 | 0.000 | 0.000 |
| nntpwrite | 00:00:00.000 | 0.0% | 5 | 0.000 | 0.000 | 0.000 |
| TOTAL: 00:30:00.255 | 00:30:00.099 | 100.0% | - | - | - | - |
Control commands to INND:
| Command | Number |
|---|---|
| L | 1 |
| flush | 3 |
| flushlogs | 2 |
| go | 2 |
| logmode | 2 |
| mode | 149 |
| name | 2 |
| pause | 2 |
| paused | 2 |
| reload | 2 |
| reserve | 2 |
| TOTAL: 11 | 169 |
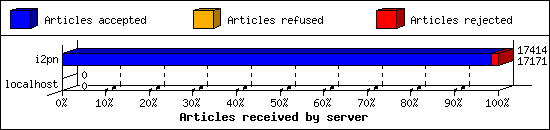
Incoming Feeds (INN):
| Server | Connects | Offered | Taken | Refused | Reject | %Accpt | Elapsed | |
|---|---|---|---|---|---|---|---|---|
| 1 | i2pn | 7 | 17414 | 17171 | 0 | 243 | 98% | 24:46:26 |
| 2 | localhost | 31 | 0 | 0 | 0 | 0 | 0% | 00:00:00 |
| TOTAL: 2 | 38 | 17414 | 17171 | 0 | 243 | 98% | 24:46:26 | |
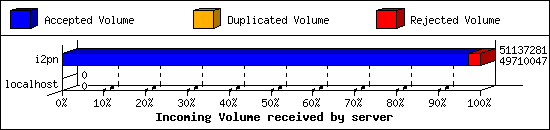
Incoming Volume (INN):
| Server | AcceptVol | DupVol | RejVol | TotalVol | %Acc | Vol/Art | |
|---|---|---|---|---|---|---|---|
| 1 | i2pn | 47.4 MB | 0.0 KB | 1.4 MB | 48.8 MB | 97% | 2.9 KB |
| 2 | localhost | 0.0 KB | 0.0 KB | 0.0 KB | 0.0 KB | 0% | 0 |
| TOTAL: 2 | 47.4 MB | 0.0 KB | 1.4 MB | 48.8 MB | 97% | 2.9 KB | |
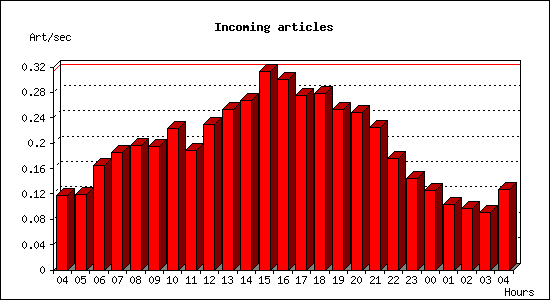
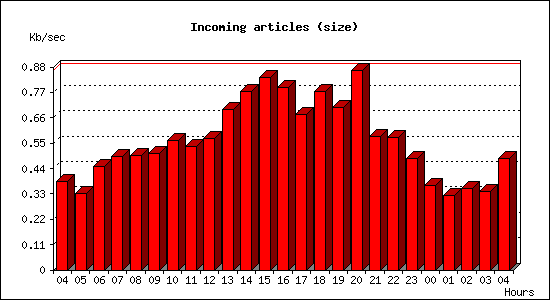
Incoming articles:
| Date | Articles | %Arts | Art/sec | Size | %Size | KB/sec |
|---|---|---|---|---|---|---|
| May 29 04:15:01 - 04:59:59 | 319 | 1.9% | 0.12 | 1.0 MB | 2.1% | 0.38 |
| May 29 05:00:00 - 05:59:59 | 428 | 2.5% | 0.12 | 1.2 MB | 2.5% | 0.33 |
| May 29 06:00:00 - 06:59:59 | 594 | 3.5% | 0.17 | 1.6 MB | 3.3% | 0.45 |
| May 29 07:00:00 - 07:59:59 | 669 | 3.9% | 0.19 | 1.7 MB | 3.7% | 0.49 |
| May 29 08:00:00 - 08:59:59 | 704 | 4.1% | 0.20 | 1.7 MB | 3.7% | 0.50 |
| May 29 09:00:00 - 09:59:59 | 703 | 4.1% | 0.20 | 1.8 MB | 3.8% | 0.51 |
| May 29 10:00:00 - 10:59:59 | 802 | 4.7% | 0.22 | 2.0 MB | 4.2% | 0.56 |
| May 29 11:00:00 - 11:59:59 | 677 | 3.9% | 0.19 | 1.9 MB | 4.0% | 0.54 |
| May 29 12:00:00 - 12:59:59 | 823 | 4.8% | 0.23 | 2.0 MB | 4.2% | 0.57 |
| May 29 13:00:00 - 13:59:59 | 913 | 5.3% | 0.25 | 2.4 MB | 5.2% | 0.69 |
| May 29 14:00:00 - 14:59:59 | 964 | 5.6% | 0.27 | 2.7 MB | 5.7% | 0.77 |
| May 29 15:00:00 - 15:59:59 | 1126 | 6.6% | 0.31 | 2.9 MB | 6.2% | 0.84 |
| May 29 16:00:00 - 16:59:59 | 1083 | 6.3% | 0.30 | 2.8 MB | 5.9% | 0.79 |
| May 29 17:00:00 - 17:59:59 | 989 | 5.8% | 0.27 | 2.4 MB | 5.0% | 0.68 |
| May 29 18:00:00 - 18:59:59 | 1001 | 5.8% | 0.28 | 2.7 MB | 5.7% | 0.77 |
| May 29 19:00:00 - 19:59:59 | 911 | 5.3% | 0.25 | 2.5 MB | 5.2% | 0.70 |
| May 29 20:00:00 - 20:59:59 | 896 | 5.2% | 0.25 | 3.0 MB | 6.4% | 0.86 |
| May 29 21:00:00 - 21:59:59 | 810 | 4.7% | 0.23 | 2.0 MB | 4.3% | 0.58 |
| May 29 22:00:00 - 22:59:59 | 632 | 3.7% | 0.18 | 2.0 MB | 4.3% | 0.57 |
| May 29 23:00:00 - 23:59:59 | 519 | 3.0% | 0.14 | 1.7 MB | 3.6% | 0.48 |
| May 30 00:00:00 - 00:59:59 | 451 | 2.6% | 0.13 | 1.3 MB | 2.7% | 0.37 |
| May 30 01:00:00 - 01:59:59 | 370 | 2.2% | 0.10 | 1.1 MB | 2.4% | 0.32 |
| May 30 02:00:00 - 02:59:59 | 347 | 2.0% | 0.10 | 1.2 MB | 2.6% | 0.35 |
| May 30 03:00:00 - 03:59:59 | 325 | 1.9% | 0.09 | 1.2 MB | 2.5% | 0.34 |
| May 30 04:00:00 - 04:15:01 | 115 | 0.7% | 0.13 | 436.2 KB | 0.9% | 0.48 |
| TOTAL: 24:00:00 | 17171 | 100.0% | 0.20 | 47.4 MB | 100.0% | 0.56 |
Sites sending bad articles:
| Server | Total | Group | Dist | Duplic | Unapp | TooOld | Site | Line | Other | |
|---|---|---|---|---|---|---|---|---|---|---|
| 1 | i2pn | 622 | 1 | 0 | 0 | 0 | 0 | 0 | 0 | 621 |
| TOTAL: 1 | 622 | 1 | 0 | 0 | 0 | 0 | 0 | 0 | 621 | |
Unwanted newsgroups [Top 20]:
| Newsgroup | Count |
|---|---|
| biz.mlm | 1 |
| TOTAL: 1 | 1 |
INND Perl filter [Top 20]:
| Reason | Count |
|---|---|
| Scoring filter (s5) | 188 |
| Scoring filter (s6) | 29 |
| Scoring filter (sit1b) | 20 |
| Scoring filter (n4) | 4 |
| Scoring filter (n11) | 1 |
| TOTAL: 5 | 242 |
NoCeM on Spool:
| Id | Good | Bad | Unique | Total |
|---|---|---|---|---|
| bleachbot@httrack.com | 38 | 0 | 38 | 38 |
| TOTAL: 1 | 38 | 23 | 38 | 38 |
Miscellaneous innd statistics [Top 10]:
| Event | Server | Number |
|---|---|---|
| Including strange strings | ||
| i2pn | 379 | |
| TOTAL: 1 | 379 | |
| TOTAL: 1 | 379 | |
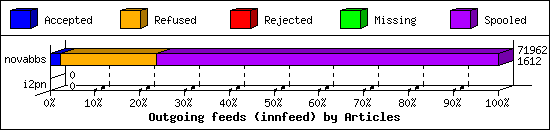
Outgoing Feeds (innfeed) by Articles:
| Server | Offered | Taken | Refused | Reject | Miss | Spool | %Took | Elapsed | |
|---|---|---|---|---|---|---|---|---|---|
| 1 | novabbs | 77617 | 1612 | 15437 | 110 | 6 | 54797 | 2% | 23:59:58 |
| 2 | i2pn | 0 | 0 | 0 | 0 | 0 | 0 | 0% | 00:10:00 |
| TOTAL: 2 | 77617 | 1612 | 15437 | 110 | 6 | 54797 | 2% | 24:09:58 | |
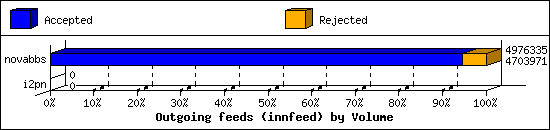
Outgoing Feeds (innfeed) by Volume:
| Server | AcceptVol | RejectVol | TotalVol | Volume/sec | Vol/Art | Elapsed | |
|---|---|---|---|---|---|---|---|
| 1 | novabbs | 4.5 MB | 266.0 KB | 4.7 MB | 0.1 KB/s | 2.8 KB | 23:59:58 |
| 2 | i2pn | 0.0 KB | 0.0 KB | 0.0 KB | 0.0 KB/s | 0 | 00:10:00 |
| TOTAL: 2 | 4.5 MB | 266.0 KB | 4.7 MB | 0.1 KB/s | 2.8 KB | 24:09:58 | |
NNRP readership statistics:
| System | Conn | Arts | Size | Groups | Post | Rej | Elapsed | |
|---|---|---|---|---|---|---|---|---|
| 1 | 60.191.17.218 | 1 | 0 | 0.0 KB | 0 | 0 | 0 | 00:30:00 |
| TOTAL: 1 | 1 | 0 | 0.0 KB | 0 | 0 | 0 | 00:30:00 | |
NNRP readership statistics (by domain):
| System | Conn | Arts | Size | Groups | Post | Rej | Elapsed | |
|---|---|---|---|---|---|---|---|---|
| 1 | unresolved | 1 | 0 | 0.0 KB | 0 | 0 | 0 | 00:30:00 |
| TOTAL: 1 | 1 | 0 | 0.0 KB | 0 | 0 | 0 | 00:30:00 | |
NNRP total resource statistics [Top 20]:
| System | User(ms) | System(ms) | Idle(ms) | Elapsed |
|---|---|---|---|---|
| 60.191.17.218 | 0.044 | 0.004 | 0.000 | 00:30:00 |
| TOTAL: 1 | 0.044 | 0.004 | 0.000 | 00:30:00 |
NNRP unrecognized commands (by host):
| System | Conn |
|---|---|
| 60.191.17.218 | 1 |
| TOTAL: 1 | 1 |
NNRP unrecognized commands (by command):
| Command | Count |
|---|---|
| GET / HTTP/1.0 | 1 |
| TOTAL: 1 | 1 |
NNRP client timeouts [Top 20]:
| System | Conn | Peer |
|---|---|---|
| 60.191.17.218 | 1 | 0 |
| TOTAL: 1 | 1 | 0 |
