Log entries by program:
| Program name | Lines | %Lines | Size | %Size |
|---|---|---|---|---|
| inn | 18743 | 75.8% | 1.5 MB | 72.2% |
| nnrpd | 3821 | 15.5% | 302.6 KB | 14.3% |
| innd | 1423 | 5.8% | 197.6 KB | 9.3% |
| innfeed | 622 | 2.5% | 74.2 KB | 3.5% |
| nocem | 104 | 0.4% | 10.9 KB | 0.5% |
| controlchan | 12 | 0.0% | 2.3 KB | 0.1% |
| pgpverify | 1 | 0.0% | 0.1 KB | 0.0% |
| TOTAL: 7 | 24726 | 100.0% | 2.1 MB | 100.0% |
History cache:
| Reason | Count | %Count |
|---|---|---|
| Do not exist | 18160 | 97.7% |
| Negative hits | 224 | 1.2% |
| Positive hits | 144 | 0.8% |
| Cache misses | 57 | 0.3% |
| TOTAL: 4 | 18585 | 100.0% |
INND timer:
| Code region | Time | Pct | Invoked | Min(ms) | Avg(ms) | Max(ms) |
|---|---|---|---|---|---|---|
| article cancel | 00:00:00.074 | 0.0% | 182 | 0.000 | 0.407 | 1.667 |
| article cleanup | 00:00:00.096 | 0.0% | 18184 | 0.000 | 0.005 | 0.069 |
| article logging | 00:00:00.482 | 0.0% | 18634 | 0.000 | 0.026 | 0.084 |
| article parse | 00:00:00.391 | 0.0% | 26273 | 0.000 | 0.015 | 0.047 |
| article write | 00:00:10.301 | 0.0% | 17905 | 0.172 | 0.575 | 5.290 |
| artlog/artcncl | 00:00:00.000 | 0.0% | 119 | 0.000 | 0.000 | 0.000 |
| data move | 00:00:00.015 | 0.0% | 33320 | 0.000 | 0.000 | 0.013 |
| hisgrep/artcncl | 00:00:00.008 | 0.0% | 175 | 0.000 | 0.046 | 0.500 |
| hishave/artcncl | 00:00:00.005 | 0.0% | 182 | 0.000 | 0.027 | 0.250 |
| history grep | 00:00:00.001 | 0.0% | 32 | 0.031 | 0.031 | 0.031 |
| history lookup | 00:00:03.355 | 0.0% | 18455 | 0.000 | 0.182 | 3.028 |
| history sync | 00:00:00.024 | 0.0% | 415 | 0.000 | 0.058 | 0.500 |
| history write | 00:00:04.191 | 0.0% | 18184 | 0.000 | 0.230 | 4.027 |
| hiswrite/artcncl | 00:00:00.001 | 0.0% | 7 | 0.000 | 0.143 | 0.333 |
| idle | 24:00:28.078 | 100.0% | 27574 | 71.751 | 3134.405 | 15004.275 |
| nntp read | 00:00:00.493 | 0.0% | 26290 | 0.000 | 0.019 | 0.122 |
| overview write | 00:00:03.686 | 0.0% | 17905 | 0.000 | 0.206 | 2.353 |
| perl filter | 00:00:14.919 | 0.0% | 18184 | 0.540 | 0.820 | 1.689 |
| python filter | 00:00:00.000 | 0.0% | 0 | 0.000 | 0.000 | 0.000 |
| site send | 00:00:00.655 | 0.0% | 18001 | 0.000 | 0.036 | 0.084 |
| TOTAL: 24:01:10.357 | 24:01:06.775 | 100.0% | - | - | - | - |
INNfeed timer:
| Code region | Time | Pct | Invoked | Min(ms) | Avg(ms) | Max(ms) |
|---|---|---|---|---|---|---|
| article new | 00:00:00.026 | 0.0% | 17949 | 0.000 | 0.001 | 0.021 |
| article prepare | 00:00:00.000 | 0.0% | 952 | 0.000 | 0.000 | 0.000 |
| article read | 00:00:00.036 | 0.0% | 234 | 0.000 | 0.154 | 21.000 |
| backlog stats | 00:00:00.018 | 0.0% | 58400 | 0.000 | 0.000 | 0.005 |
| callbacks | 00:00:00.000 | 0.0% | 0 | 0.000 | 0.000 | 0.000 |
| data read | 00:00:00.213 | 0.0% | 35860 | 0.000 | 0.006 | 0.029 |
| data write | 00:00:00.303 | 0.0% | 18192 | 0.000 | 0.017 | 0.096 |
| idle | 23:59:43.917 | 100.0% | 58400 | 76.367 | 1479.177 | 4453.126 |
| status file | 00:00:00.046 | 0.0% | 160 | 0.000 | 0.287 | 1.000 |
| TOTAL: 23:59:45.050 | 23:59:44.559 | 100.0% | - | - | - | - |
nnrpd timer:
| Code region | Time | Pct | Invoked | Min(ms) | Avg(ms) | Max(ms) |
|---|---|---|---|---|---|---|
| idle | 00:01:37.000 | 4.9% | 5370 | 0.167 | 18.063 | 70.000 |
| newnews | 00:00:00.000 | 0.0% | 0 | 0.000 | 0.000 | 0.000 |
| nntpwrite | 00:00:00.389 | 0.0% | 16621 | 0.000 | 0.023 | 17.700 |
| readart | 00:00:07.361 | 0.4% | 605 | 2.800 | 12.167 | 86.000 |
| TOTAL: 00:33:18.257 | 00:01:44.750 | 5.2% | - | - | - | - |
Control commands to INND:
| Command | Number |
|---|---|
| L | 1 |
| flush | 3 |
| flushlogs | 2 |
| go | 2 |
| logmode | 2 |
| mode | 149 |
| name | 2 |
| pause | 2 |
| paused | 2 |
| reload | 8 |
| reserve | 2 |
| TOTAL: 11 | 175 |
Control Channel:
| Sender | newgroup | rmgroup | Other | Bad PGP | DoIt | OK |
|---|---|---|---|---|---|---|
| moderator@dana.de | 0 | 0 | 1 | 1 | 0 | 1 |
| TOTAL | 0 | 0 | 1 | 1 | 0 | 1 |
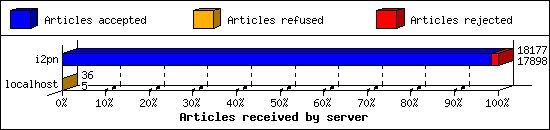
Incoming Feeds (INN):
| Server | Connects | Offered | Taken | Refused | Reject | %Accpt | Elapsed | |
|---|---|---|---|---|---|---|---|---|
| 1 | i2pn | 9 | 18177 | 17898 | 0 | 279 | 98% | 24:55:54 |
| 2 | localhost | 38 | 36 | 5 | 31 | 0 | 13% | 00:00:02 |
| TOTAL: 2 | 47 | 18213 | 17903 | 31 | 279 | 98% | 24:55:56 | |
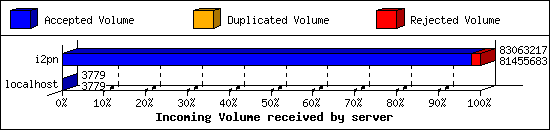
Incoming Volume (INN):
| Server | AcceptVol | DupVol | RejVol | TotalVol | %Acc | Vol/Art | |
|---|---|---|---|---|---|---|---|
| 1 | i2pn | 77.7 MB | 0.0 KB | 1.5 MB | 79.2 MB | 98% | 4.5 KB |
| 2 | localhost | 3.7 KB | 0.0 KB | 0.0 KB | 3.7 KB | 100% | 0.7 KB |
| TOTAL: 2 | 77.7 MB | 0.0 KB | 1.5 MB | 79.2 MB | 98% | 4.5 KB | |
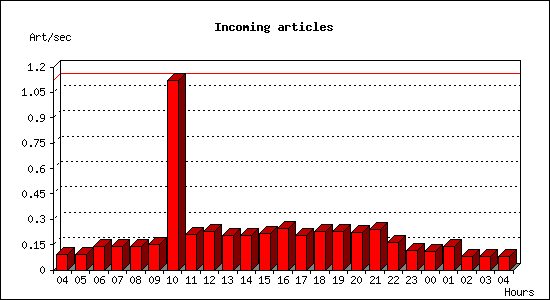
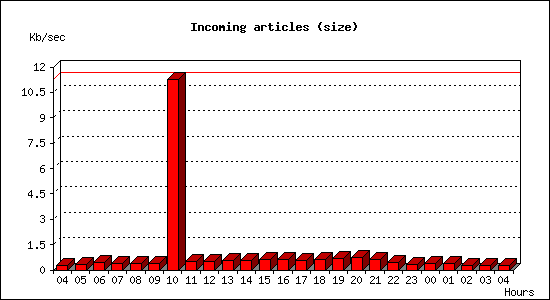
Incoming articles:
| Date | Articles | %Arts | Art/sec | Size | %Size | KB/sec |
|---|---|---|---|---|---|---|
| Jun 1 04:15:01 - 04:59:59 | 246 | 1.4% | 0.09 | 674.5 KB | 0.8% | 0.25 |
| Jun 1 05:00:00 - 05:59:59 | 330 | 1.8% | 0.09 | 1.1 MB | 1.5% | 0.32 |
| Jun 1 06:00:00 - 06:59:59 | 497 | 2.8% | 0.14 | 1.5 MB | 2.0% | 0.44 |
| Jun 1 07:00:00 - 07:59:59 | 497 | 2.8% | 0.14 | 1.4 MB | 1.8% | 0.39 |
| Jun 1 08:00:00 - 08:59:59 | 503 | 2.8% | 0.14 | 1.3 MB | 1.6% | 0.36 |
| Jun 1 09:00:00 - 09:59:59 | 539 | 3.0% | 0.15 | 1.3 MB | 1.7% | 0.37 |
| Jun 1 10:00:00 - 10:59:59 | 4038 | 22.6% | 1.12 | 39.7 MB | 51.1% | 11.28 |
| Jun 1 11:00:00 - 11:59:59 | 749 | 4.2% | 0.21 | 1.9 MB | 2.4% | 0.53 |
| Jun 1 12:00:00 - 12:59:59 | 811 | 4.5% | 0.23 | 1.9 MB | 2.4% | 0.53 |
| Jun 1 13:00:00 - 13:59:59 | 737 | 4.1% | 0.20 | 1.9 MB | 2.5% | 0.54 |
| Jun 1 14:00:00 - 14:59:59 | 739 | 4.1% | 0.21 | 2.0 MB | 2.6% | 0.58 |
| Jun 1 15:00:00 - 15:59:59 | 775 | 4.3% | 0.22 | 2.1 MB | 2.7% | 0.60 |
| Jun 1 16:00:00 - 16:59:59 | 886 | 5.0% | 0.25 | 2.2 MB | 2.9% | 0.64 |
| Jun 1 17:00:00 - 17:59:59 | 731 | 4.1% | 0.20 | 2.0 MB | 2.6% | 0.57 |
| Jun 1 18:00:00 - 18:59:59 | 813 | 4.5% | 0.23 | 2.2 MB | 2.9% | 0.64 |
| Jun 1 19:00:00 - 19:59:59 | 823 | 4.6% | 0.23 | 2.3 MB | 3.0% | 0.66 |
| Jun 1 20:00:00 - 20:59:59 | 794 | 4.4% | 0.22 | 2.5 MB | 3.3% | 0.72 |
| Jun 1 21:00:00 - 21:59:59 | 866 | 4.8% | 0.24 | 2.1 MB | 2.8% | 0.61 |
| Jun 1 22:00:00 - 22:59:59 | 575 | 3.2% | 0.16 | 1.6 MB | 2.1% | 0.46 |
| Jun 1 23:00:00 - 23:59:59 | 405 | 2.3% | 0.11 | 1.1 MB | 1.5% | 0.32 |
| Jun 2 00:00:00 - 00:59:59 | 388 | 2.2% | 0.11 | 1.3 MB | 1.6% | 0.36 |
| Jun 2 01:00:00 - 01:59:59 | 510 | 2.8% | 0.14 | 1.4 MB | 1.8% | 0.40 |
| Jun 2 02:00:00 - 02:59:59 | 283 | 1.6% | 0.08 | 881.7 KB | 1.1% | 0.24 |
| Jun 2 03:00:00 - 03:59:59 | 290 | 1.6% | 0.08 | 926.5 KB | 1.2% | 0.26 |
| Jun 2 04:00:00 - 04:15:01 | 71 | 0.4% | 0.08 | 262.6 KB | 0.3% | 0.29 |
| TOTAL: 24:00:00 | 17896 | 100.0% | 0.21 | 77.7 MB | 100.0% | 0.92 |
Sites sending bad articles:
| Server | Total | Group | Dist | Duplic | Unapp | TooOld | Site | Line | Other | |
|---|---|---|---|---|---|---|---|---|---|---|
| 1 | i2pn | 729 | 2 | 0 | 0 | 0 | 0 | 0 | 0 | 727 |
| TOTAL: 1 | 729 | 2 | 0 | 0 | 0 | 0 | 0 | 0 | 727 | |
Unwanted newsgroups [Top 20]:
| Newsgroup | Count |
|---|---|
| biz.mlm | 1 |
| alt.sex.girl | 1 |
| TOTAL: 2 | 2 |
INND Perl filter [Top 20]:
| Reason | Count |
|---|---|
| Scoring filter (s5) | 238 |
| Scoring filter (s6) | 28 |
| Scoring filter (n10) | 4 |
| Scoring filter (n11) | 4 |
| Scoring filter (n4) | 2 |
| EMP (phl) | 1 |
| TOTAL: 6 | 277 |
NoCeM on Spool:
| Id | Good | Bad | Unique | Total |
|---|---|---|---|---|
| bleachbot@httrack.com | 74 | 0 | 79 | 79 |
| TOTAL: 1 | 74 | 22 | 79 | 79 |
Miscellaneous innd statistics [Top 10]:
| Event | Server | Number |
|---|---|---|
| Including strange strings | ||
| i2pn | 450 | |
| TOTAL: 1 | 450 | |
| TOTAL: 1 | 450 | |
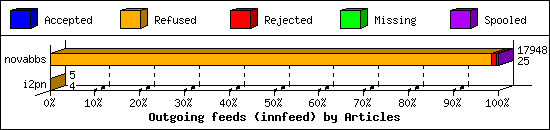
Outgoing Feeds (innfeed) by Articles:
| Server | Offered | Taken | Refused | Reject | Miss | Spool | %Took | Elapsed | |
|---|---|---|---|---|---|---|---|---|---|
| 1 | novabbs | 18048 | 25 | 17661 | 209 | 0 | 53 | 0% | 23:59:58 |
| 2 | i2pn | 5 | 4 | 1 | 0 | 0 | 0 | 80% | 00:45:01 |
| TOTAL: 2 | 18053 | 29 | 17662 | 209 | 0 | 53 | 0% | 24:44:59 | |
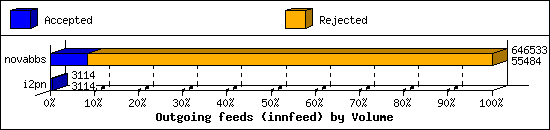
Outgoing Feeds (innfeed) by Volume:
| Server | AcceptVol | RejectVol | TotalVol | Volume/sec | Vol/Art | Elapsed | |
|---|---|---|---|---|---|---|---|
| 1 | novabbs | 54.2 KB | 577.2 KB | 631.4 KB | 0.0 KB/s | 2.7 KB | 23:59:58 |
| 2 | i2pn | 3.0 KB | 0.0 KB | 3.0 KB | 0.0 KB/s | 0.8 KB | 00:45:01 |
| TOTAL: 2 | 57.2 KB | 577.2 KB | 634.4 KB | 0.0 KB/s | 2.7 KB | 24:44:59 | |
NNRP readership statistics:
| System | Conn | Arts | Size | Groups | Post | Rej | Elapsed | |
|---|---|---|---|---|---|---|---|---|
| 1 | i2pn2.org | 470 | 605 | 2.1 MB | 605 | 4 | 0 | 00:03:12 |
| TOTAL: 1 | 470 | 605 | 2.1 MB | 605 | 4 | 0 | 00:33:15 | |
NNRP readership statistics (by domain):
| System | Conn | Arts | Size | Groups | Post | Rej | Elapsed | |
|---|---|---|---|---|---|---|---|---|
| 1 | *.org | 470 | 605 | 2.1 MB | 605 | 4 | 0 | 00:03:12 |
| 2 | *.ph.ph.cox.net | 1 | 0 | 0.0 KB | 0 | 0 | 0 | 00:30:02 |
| 3 | *.sfj.corp.censys.io | 1 | 0 | 0.0 KB | 0 | 0 | 0 | 00:00:00 |
| TOTAL: 3 | 472 | 605 | 2.1 MB | 605 | 4 | 0 | 00:33:15 | |
NNRP auth users [Top 20]:
| User | Conn |
|---|---|
| AnonUser | 470 |
| TOTAL: 1 | 470 |
NNRP total resource statistics [Top 20]:
| System | User(ms) | System(ms) | Idle(ms) | Elapsed |
|---|---|---|---|---|
| ip68-2-45-86.ph.ph.cox.net | 0.060 | 0.016 | 0.000 | 00:30:02 |
| i2pn2.org | 39.196 | 3.400 | 43.230 | 00:03:12 |
| worker-18.sfj.corp.censys.io | 0.132 | 0.000 | 0.000 | 00:00:00 |
| TOTAL: 3 | 39.388 | 3.416 | 43.230 | 00:33:15 |
Curious NNRP server explorers [Top 20]:
| System | Conn |
|---|---|
| ip68-2-45-86.ph.ph.cox.net | 1 |
| worker-18.sfj.corp.censys.io | 1 |
| TOTAL: 2 | 2 |
NNRP client timeouts [Top 20]:
| System | Conn | Peer |
|---|---|---|
| worker-18.sfj.corp.censys.io | 1 | 1 |
| TOTAL: 1 | 1 | 1 |
Newsgroup request counts (by category):
| Category | Count | Pct | |
|---|---|---|---|
| 1 | rocksolid | 605 | 100.0% |
| TOTAL: 1 | 605 | 100.0% | |
Newsgroup request counts (by newsgroup) [Top 100]:
| Newsgroup | Count | |
|---|---|---|
| 1 | rocksolid.shared.test | 151 |
| 2 | rocksolid.shared.i2p | 68 |
| 3 | rocksolid.shared.tor | 62 |
| 4 | rocksolid.shared.general | 59 |
| 5 | rocksolid.shared.news | 58 |
| 6 | rocksolid.nodes | 34 |
| 7 | rocksolid.shared.hacking | 33 |
| 8 | rocksolid.shared.security | 32 |
| 9 | rocksolid.shared.dancingelephants | 26 |
| 10 | rocksolid.shared.encryption | 18 |
| 11 | rocksolid.shared.linux | 14 |
| 12 | rocksolid.shared.helpdesk | 11 |
| 13 | rocksolid.shared.freenet | 10 |
| 14 | rocksolid.shared.offtopic | 8 |
| 15 | rocksolid.shared.entertainment | 7 |
| 16 | rocksolid.shared.rocksolid | 5 |
| 17 | rocksolid.nodes.announce | 4 |
| 18 | rocksolid.ru.talk | 2 |
| 19 | rocksolid.shared.retrobbs | 2 |
| 20 | rocksolid.nodes.help | 1 |
| TOTAL: 20 | 605 | |
