Log entries by program:
| Program name | Lines | %Lines | Size | %Size |
|---|---|---|---|---|
| inn | 16982 | 67.7% | 1.4 MB | 65.5% |
| nnrpd | 6240 | 24.9% | 495.6 KB | 23.0% |
| innd | 1225 | 4.9% | 171.9 KB | 8.0% |
| innfeed | 608 | 2.4% | 72.7 KB | 3.4% |
| nocem | 37 | 0.1% | 3.4 KB | 0.2% |
| controlchan | 1 | 0.0% | 0.1 KB | 0.0% |
| TOTAL: 6 | 25093 | 100.0% | 2.1 MB | 100.0% |
History cache:
| Reason | Count | %Count |
|---|---|---|
| Do not exist | 16465 | 98.3% |
| Negative hits | 223 | 1.3% |
| Positive hits | 39 | 0.2% |
| Cache misses | 21 | 0.1% |
| TOTAL: 4 | 16748 | 100.0% |
INND timer:
| Code region | Time | Pct | Invoked | Min(ms) | Avg(ms) | Max(ms) |
|---|---|---|---|---|---|---|
| article cancel | 00:00:00.056 | 0.0% | 76 | 0.000 | 0.737 | 4.500 |
| article cleanup | 00:00:00.074 | 0.0% | 16513 | 0.000 | 0.004 | 0.035 |
| article logging | 00:00:00.438 | 0.0% | 16922 | 0.000 | 0.026 | 0.083 |
| article parse | 00:00:00.225 | 0.0% | 18149 | 0.000 | 0.012 | 0.043 |
| article write | 00:00:09.126 | 0.0% | 16298 | 0.182 | 0.560 | 2.303 |
| artlog/artcncl | 00:00:00.000 | 0.0% | 72 | 0.000 | 0.000 | 0.000 |
| data move | 00:00:00.007 | 0.0% | 19863 | 0.000 | 0.000 | 0.008 |
| hisgrep/artcncl | 00:00:00.010 | 0.0% | 68 | 0.000 | 0.147 | 1.000 |
| hishave/artcncl | 00:00:00.002 | 0.0% | 76 | 0.000 | 0.026 | 0.500 |
| history grep | 00:00:00.000 | 0.0% | 0 | 0.000 | 0.000 | 0.000 |
| history lookup | 00:00:04.142 | 0.0% | 16755 | 0.000 | 0.247 | 1.333 |
| history sync | 00:00:00.014 | 0.0% | 409 | 0.000 | 0.034 | 0.500 |
| history write | 00:00:04.292 | 0.0% | 16513 | 0.021 | 0.260 | 1.290 |
| hiswrite/artcncl | 00:00:00.001 | 0.0% | 8 | 0.000 | 0.125 | 0.143 |
| idle | 24:00:21.209 | 99.9% | 20568 | 927.604 | 4201.731 | 14653.854 |
| nntp read | 00:00:00.467 | 0.0% | 18438 | 0.000 | 0.025 | 0.085 |
| overview write | 00:00:03.292 | 0.0% | 16298 | 0.025 | 0.202 | 8.169 |
| perl filter | 00:00:20.918 | 0.0% | 16513 | 1.007 | 1.267 | 2.167 |
| python filter | 00:00:00.000 | 0.0% | 0 | 0.000 | 0.000 | 0.000 |
| site send | 00:00:00.598 | 0.0% | 16305 | 0.000 | 0.037 | 0.113 |
| TOTAL: 24:01:08.540 | 24:01:04.871 | 100.0% | - | - | - | - |
INNfeed timer:
| Code region | Time | Pct | Invoked | Min(ms) | Avg(ms) | Max(ms) |
|---|---|---|---|---|---|---|
| article new | 00:00:00.029 | 0.0% | 16250 | 0.000 | 0.002 | 0.026 |
| article prepare | 00:00:00.000 | 0.0% | 120 | 0.000 | 0.000 | 0.000 |
| article read | 00:00:00.026 | 0.0% | 28 | 0.000 | 0.929 | 13.000 |
| backlog stats | 00:00:00.015 | 0.0% | 53184 | 0.000 | 0.000 | 0.007 |
| callbacks | 00:00:00.000 | 0.0% | 0 | 0.000 | 0.000 | 0.000 |
| data read | 00:00:00.187 | 0.0% | 32555 | 0.000 | 0.006 | 0.035 |
| data write | 00:00:00.277 | 0.0% | 16308 | 0.000 | 0.017 | 0.058 |
| idle | 23:58:14.015 | 100.0% | 53184 | 930.787 | 1622.556 | 5406.658 |
| status file | 00:00:00.043 | 0.0% | 155 | 0.000 | 0.277 | 1.000 |
| TOTAL: 23:58:15.054 | 23:58:14.592 | 100.0% | - | - | - | - |
nnrpd timer:
| Code region | Time | Pct | Invoked | Min(ms) | Avg(ms) | Max(ms) |
|---|---|---|---|---|---|---|
| idle | 00:02:10.166 | 44.2% | 7956 | 0.000 | 16.361 | 49.667 |
| newnews | 00:00:00.000 | 0.0% | 0 | 0.000 | 0.000 | 0.000 |
| nntpwrite | 00:00:00.301 | 0.1% | 24818 | 0.000 | 0.012 | 0.643 |
| readart | 00:00:07.122 | 2.4% | 849 | 2.273 | 8.389 | 37.000 |
| TOTAL: 00:04:54.392 | 00:02:17.589 | 46.7% | - | - | - | - |
Control commands to INND:
| Command | Number |
|---|---|
| L | 1 |
| flush | 3 |
| flushlogs | 2 |
| go | 2 |
| logmode | 2 |
| mode | 149 |
| name | 2 |
| pause | 2 |
| paused | 2 |
| reload | 2 |
| reserve | 2 |
| TOTAL: 11 | 169 |
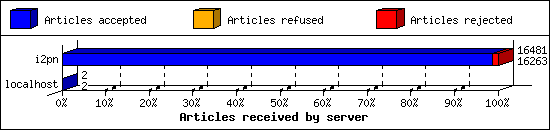
Incoming Feeds (INN):
| Server | Connects | Offered | Taken | Refused | Reject | %Accpt | Elapsed | |
|---|---|---|---|---|---|---|---|---|
| 1 | i2pn | 6 | 16481 | 16263 | 3 | 215 | 98% | 24:29:07 |
| 2 | localhost | 31 | 2 | 2 | 0 | 0 | 100% | 00:00:00 |
| TOTAL: 2 | 37 | 16483 | 16265 | 3 | 215 | 98% | 24:29:07 | |
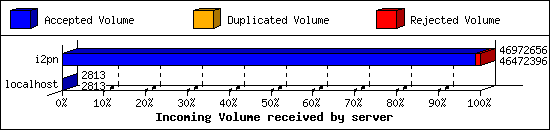
Incoming Volume (INN):
| Server | AcceptVol | DupVol | RejVol | TotalVol | %Acc | Vol/Art | |
|---|---|---|---|---|---|---|---|
| 1 | i2pn | 44.3 MB | 0.0 KB | 488.5 KB | 44.8 MB | 98% | 2.8 KB |
| 2 | localhost | 2.7 KB | 0.0 KB | 0.0 KB | 2.7 KB | 100% | 1.4 KB |
| TOTAL: 2 | 44.3 MB | 0.0 KB | 488.5 KB | 44.8 MB | 98% | 2.8 KB | |
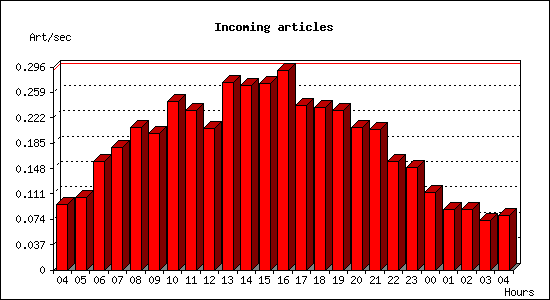
Incoming articles:
| Date | Articles | %Arts | Art/sec | Size | %Size | KB/sec |
|---|---|---|---|---|---|---|
| Jun 7 04:15:01 - 04:59:59 | 258 | 1.6% | 0.10 | 819.6 KB | 1.8% | 0.30 |
| Jun 7 05:00:00 - 05:59:59 | 383 | 2.4% | 0.11 | 1.1 MB | 2.4% | 0.31 |
| Jun 7 06:00:00 - 06:59:59 | 568 | 3.5% | 0.16 | 1.4 MB | 3.0% | 0.38 |
| Jun 7 07:00:00 - 07:59:59 | 641 | 3.9% | 0.18 | 1.5 MB | 3.4% | 0.43 |
| Jun 7 08:00:00 - 08:59:59 | 747 | 4.6% | 0.21 | 1.9 MB | 4.2% | 0.53 |
| Jun 7 09:00:00 - 09:59:59 | 719 | 4.4% | 0.20 | 1.8 MB | 4.1% | 0.52 |
| Jun 7 10:00:00 - 10:59:59 | 884 | 5.4% | 0.25 | 2.5 MB | 5.6% | 0.71 |
| Jun 7 11:00:00 - 11:59:59 | 839 | 5.2% | 0.23 | 2.0 MB | 4.5% | 0.56 |
| Jun 7 12:00:00 - 12:59:59 | 741 | 4.5% | 0.21 | 1.7 MB | 3.9% | 0.49 |
| Jun 7 13:00:00 - 13:59:59 | 986 | 6.1% | 0.27 | 2.5 MB | 5.6% | 0.71 |
| Jun 7 14:00:00 - 14:59:59 | 969 | 5.9% | 0.27 | 2.5 MB | 5.6% | 0.71 |
| Jun 7 15:00:00 - 15:59:59 | 980 | 6.0% | 0.27 | 2.6 MB | 6.0% | 0.75 |
| Jun 7 16:00:00 - 16:59:59 | 1049 | 6.4% | 0.29 | 2.8 MB | 6.4% | 0.81 |
| Jun 7 17:00:00 - 17:59:59 | 861 | 5.3% | 0.24 | 2.4 MB | 5.5% | 0.69 |
| Jun 7 18:00:00 - 18:59:59 | 854 | 5.2% | 0.24 | 2.4 MB | 5.3% | 0.67 |
| Jun 7 19:00:00 - 19:59:59 | 838 | 5.1% | 0.23 | 2.4 MB | 5.4% | 0.68 |
| Jun 7 20:00:00 - 20:59:59 | 747 | 4.6% | 0.21 | 2.5 MB | 5.7% | 0.72 |
| Jun 7 21:00:00 - 21:59:59 | 738 | 4.5% | 0.20 | 2.0 MB | 4.5% | 0.57 |
| Jun 7 22:00:00 - 22:59:59 | 572 | 3.5% | 0.16 | 1.6 MB | 3.7% | 0.47 |
| Jun 7 23:00:00 - 23:59:59 | 538 | 3.3% | 0.15 | 1.6 MB | 3.6% | 0.45 |
| Jun 8 00:00:00 - 00:59:59 | 408 | 2.5% | 0.11 | 1.1 MB | 2.6% | 0.32 |
| Jun 8 01:00:00 - 01:59:59 | 315 | 1.9% | 0.09 | 1.1 MB | 2.4% | 0.30 |
| Jun 8 02:00:00 - 02:59:59 | 320 | 2.0% | 0.09 | 1.0 MB | 2.3% | 0.29 |
| Jun 8 03:00:00 - 03:59:59 | 262 | 1.6% | 0.07 | 790.5 KB | 1.7% | 0.22 |
| Jun 8 04:00:00 - 04:15:01 | 71 | 0.4% | 0.08 | 364.1 KB | 0.8% | 0.40 |
| TOTAL: 24:00:00 | 16288 | 100.0% | 0.19 | 44.4 MB | 100.0% | 0.53 |

Sites sending bad articles:
| Server | Total | Group | Dist | Duplic | Unapp | TooOld | Site | Line | Other | |
|---|---|---|---|---|---|---|---|---|---|---|
| 1 | i2pn | 623 | 3 | 0 | 0 | 0 | 0 | 0 | 0 | 620 |
| TOTAL: 1 | 623 | 3 | 0 | 0 | 0 | 0 | 0 | 0 | 620 | |
Unwanted newsgroups [Top 20]:
| Newsgroup | Count |
|---|---|
| hk.politics | 3 |
| TOTAL: 1 | 3 |
INND Perl filter [Top 20]:
| Reason | Count |
|---|---|
| Scoring filter (s5) | 177 |
| Scoring filter (n11) | 14 |
| Scoring filter (s7) | 12 |
| Scoring filter (n6) | 4 |
| EMP (phn path) | 3 |
| Scoring filter (s6) | 2 |
| TOTAL: 6 | 212 |
NoCeM on Spool:
| Id | Good | Bad | Unique | Total |
|---|---|---|---|---|
| bleachbot@httrack.com | 7 | 0 | 7 | 7 |
| TOTAL: 1 | 7 | 26 | 7 | 7 |
Miscellaneous innd statistics [Top 10]:
| Event | Server | Number |
|---|---|---|
| Including strange strings | ||
| i2pn | 408 | |
| TOTAL: 1 | 408 | |
| TOTAL: 1 | 408 | |
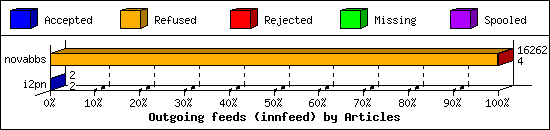
Outgoing Feeds (innfeed) by Articles:
| Server | Offered | Taken | Refused | Reject | Miss | Spool | %Took | Elapsed | |
|---|---|---|---|---|---|---|---|---|---|
| 1 | novabbs | 16277 | 4 | 16234 | 24 | 0 | 0 | 0% | 23:59:58 |
| 2 | i2pn | 2 | 2 | 0 | 0 | 0 | 0 | 100% | 00:21:50 |
| TOTAL: 2 | 16279 | 6 | 16234 | 24 | 0 | 0 | 0% | 24:21:48 | |
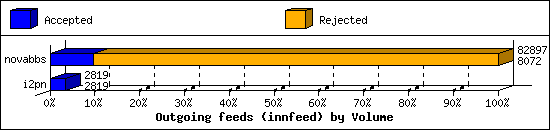
Outgoing Feeds (innfeed) by Volume:
| Server | AcceptVol | RejectVol | TotalVol | Volume/sec | Vol/Art | Elapsed | |
|---|---|---|---|---|---|---|---|
| 1 | novabbs | 7.9 KB | 73.1 KB | 81.0 KB | 0.0 KB/s | 2.9 KB | 23:59:58 |
| 2 | i2pn | 2.8 KB | 0.0 KB | 2.8 KB | 0.0 KB/s | 1.4 KB | 00:21:50 |
| TOTAL: 2 | 10.6 KB | 73.1 KB | 83.7 KB | 0.0 KB/s | 2.8 KB | 24:21:48 | |
NNRP auth users [Top 20]:
| User | Conn |
|---|---|
| i2pn2user | 796 |
| AnonUser | 82 |
| TOTAL: 2 | 878 |
NNRP total resource statistics [Top 20]:
| System | User(ms) | System(ms) | Idle(ms) | Elapsed |
|---|---|---|---|---|
| i2pn2.org | 47.328 | 5.400 | 79.791 | 00:04:51 |
| TOTAL: 1 | 47.328 | 5.400 | 79.791 | 00:04:51 |
NNRP no permission clients:
| System | Conn |
|---|---|
| i2pn2.org | 22 |
| TOTAL: 1 | 22 |
Newsgroup request counts (by category):
| Category | Count | Pct | |
|---|---|---|---|
| 1 | rocksolid | 849 | 100.0% |
| TOTAL: 1 | 849 | 100.0% | |
Newsgroup request counts (by newsgroup) [Top 100]:
| Newsgroup | Count | |
|---|---|---|
| 1 | rocksolid.shared.test | 295 |
| 2 | rocksolid.shared.general | 67 |
| 3 | rocksolid.shared.tor | 61 |
| 4 | rocksolid.shared.i2p | 57 |
| 5 | rocksolid.shared.news | 57 |
| 6 | rocksolid.shared.rocksolid | 47 |
| 7 | rocksolid.shared.offtopic | 37 |
| 8 | rocksolid.shared.dancingelephants | 34 |
| 9 | rocksolid.shared.security | 33 |
| 10 | rocksolid.nodes | 31 |
| 11 | rocksolid.shared.hacking | 27 |
| 12 | rocksolid.shared.retrobbs | 26 |
| 13 | rocksolid.shared.entertainment | 26 |
| 14 | rocksolid.shared.helpdesk | 14 |
| 15 | rocksolid.shared.encryption | 14 |
| 16 | rocksolid.shared.linux | 12 |
| 17 | rocksolid.shared.freenet | 8 |
| 18 | rocksolid.nodes.announce | 3 |
| TOTAL: 18 | 849 | |
