Log entries by program:
| Program name | Lines | %Lines | Size | %Size |
|---|---|---|---|---|
| inn | 14121 | 84.9% | 1.2 MB | 80.2% |
| innd | 1069 | 6.4% | 152.8 KB | 10.3% |
| nnrpd | 778 | 4.7% | 62.1 KB | 4.2% |
| innfeed | 607 | 3.6% | 73.5 KB | 4.9% |
| nocem | 43 | 0.3% | 4.5 KB | 0.3% |
| controlchan | 12 | 0.1% | 2.2 KB | 0.1% |
| pgpverify | 1 | 0.0% | 0.1 KB | 0.0% |
| TOTAL: 7 | 16631 | 100.0% | 1.5 MB | 100.0% |
History cache:
| Reason | Count | %Count |
|---|---|---|
| Do not exist | 13642 | 98.6% |
| Negative hits | 137 | 1.0% |
| Positive hits | 33 | 0.2% |
| Cache misses | 21 | 0.2% |
| TOTAL: 4 | 13833 | 100.0% |
INND timer:
| Code region | Time | Pct | Invoked | Min(ms) | Avg(ms) | Max(ms) |
|---|---|---|---|---|---|---|
| article cancel | 00:00:00.061 | 0.0% | 84 | 0.000 | 0.726 | 3.000 |
| article cleanup | 00:00:00.087 | 0.0% | 13680 | 0.000 | 0.006 | 0.049 |
| article logging | 00:00:00.376 | 0.0% | 14056 | 0.000 | 0.027 | 0.091 |
| article parse | 00:00:00.188 | 0.0% | 15630 | 0.000 | 0.012 | 0.041 |
| article write | 00:00:08.211 | 0.0% | 13670 | 0.250 | 0.601 | 1.222 |
| artlog/artcncl | 00:00:00.001 | 0.0% | 83 | 0.000 | 0.012 | 1.000 |
| data move | 00:00:00.017 | 0.0% | 17581 | 0.000 | 0.001 | 0.015 |
| hisgrep/artcncl | 00:00:00.011 | 0.0% | 64 | 0.000 | 0.172 | 1.000 |
| hishave/artcncl | 00:00:00.011 | 0.0% | 84 | 0.000 | 0.131 | 3.000 |
| history grep | 00:00:00.000 | 0.0% | 0 | 0.000 | 0.000 | 0.000 |
| history lookup | 00:00:03.969 | 0.0% | 13833 | 0.000 | 0.287 | 1.327 |
| history sync | 00:00:00.018 | 0.0% | 416 | 0.000 | 0.043 | 0.500 |
| history write | 00:00:03.722 | 0.0% | 13680 | 0.000 | 0.272 | 1.018 |
| hiswrite/artcncl | 00:00:00.003 | 0.0% | 20 | 0.000 | 0.150 | 1.000 |
| idle | 24:00:28.484 | 100.0% | 16306 | 2858.748 | 5300.410 | 11782.196 |
| nntp read | 00:00:00.425 | 0.0% | 15858 | 0.000 | 0.027 | 0.075 |
| overview write | 00:00:03.220 | 0.0% | 13670 | 0.056 | 0.236 | 2.141 |
| perl filter | 00:00:18.929 | 0.0% | 13680 | 1.099 | 1.384 | 1.900 |
| python filter | 00:00:00.000 | 0.0% | 0 | 0.000 | 0.000 | 0.000 |
| site send | 00:00:00.763 | 0.0% | 13702 | 0.000 | 0.056 | 0.127 |
| TOTAL: 24:01:10.940 | 24:01:08.496 | 100.0% | - | - | - | - |
INNfeed timer:
| Code region | Time | Pct | Invoked | Min(ms) | Avg(ms) | Max(ms) |
|---|---|---|---|---|---|---|
| article new | 00:00:00.028 | 0.0% | 13643 | 0.000 | 0.002 | 0.029 |
| article prepare | 00:00:00.000 | 0.0% | 148 | 0.000 | 0.000 | 0.000 |
| article read | 00:00:00.034 | 0.0% | 37 | 0.000 | 0.919 | 32.000 |
| backlog stats | 00:00:00.014 | 0.0% | 45374 | 0.000 | 0.000 | 0.006 |
| callbacks | 00:00:00.000 | 0.0% | 0 | 0.000 | 0.000 | 0.000 |
| data read | 00:00:00.195 | 0.0% | 27336 | 0.000 | 0.007 | 0.029 |
| data write | 00:00:00.267 | 0.0% | 13707 | 0.000 | 0.019 | 0.066 |
| idle | 23:58:36.564 | 100.0% | 45374 | 1027.726 | 1902.335 | 5455.427 |
| status file | 00:00:00.042 | 0.0% | 156 | 0.000 | 0.269 | 1.000 |
| TOTAL: 23:58:37.528 | 23:58:37.144 | 100.0% | - | - | - | - |
nnrpd timer:
| Code region | Time | Pct | Invoked | Min(ms) | Avg(ms) | Max(ms) |
|---|---|---|---|---|---|---|
| idle | 00:00:51.790 | 73.2% | 1768 | 5.000 | 29.293 | 9763.000 |
| newnews | 00:00:00.000 | 0.0% | 0 | 0.000 | 0.000 | 0.000 |
| nntpwrite | 00:00:00.054 | 0.1% | 5965 | 0.000 | 0.009 | 0.095 |
| readart | 00:00:00.024 | 0.0% | 2 | 12.000 | 12.000 | 12.000 |
| TOTAL: 00:01:10.746 | 00:00:51.868 | 73.3% | - | - | - | - |
Control commands to INND:
| Command | Number |
|---|---|
| L | 1 |
| flush | 3 |
| flushlogs | 2 |
| go | 2 |
| logmode | 2 |
| mode | 148 |
| name | 2 |
| pause | 2 |
| paused | 2 |
| reload | 2 |
| reserve | 2 |
| TOTAL: 11 | 168 |
Control Channel:
| Sender | newgroup | rmgroup | Other | Bad PGP | DoIt | OK |
|---|---|---|---|---|---|---|
| ba-mod@panix.com | 0 | 0 | 1 | 1 | 0 | 1 |
| TOTAL | 0 | 0 | 1 | 1 | 0 | 1 |
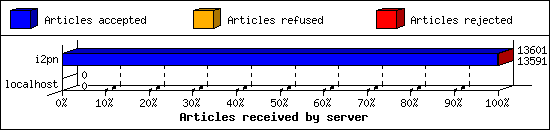
Incoming Feeds (INN):
| Server | Connects | Offered | Taken | Refused | Reject | %Accpt | Elapsed | |
|---|---|---|---|---|---|---|---|---|
| 1 | i2pn | 6 | 13601 | 13591 | 0 | 10 | 99% | 24:21:22 |
| 2 | localhost | 32 | 0 | 0 | 0 | 0 | 0% | 00:00:00 |
| TOTAL: 2 | 38 | 13601 | 13591 | 0 | 10 | 99% | 24:21:22 | |
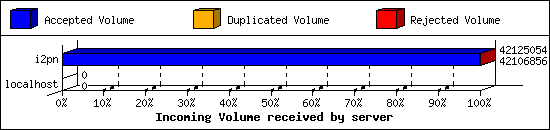
Incoming Volume (INN):
| Server | AcceptVol | DupVol | RejVol | TotalVol | %Acc | Vol/Art | |
|---|---|---|---|---|---|---|---|
| 1 | i2pn | 40.2 MB | 0.0 KB | 17.8 KB | 40.2 MB | 99% | 3.0 KB |
| 2 | localhost | 0.0 KB | 0.0 KB | 0.0 KB | 0.0 KB | 0% | 0 |
| TOTAL: 2 | 40.2 MB | 0.0 KB | 17.8 KB | 40.2 MB | 99% | 3.0 KB | |
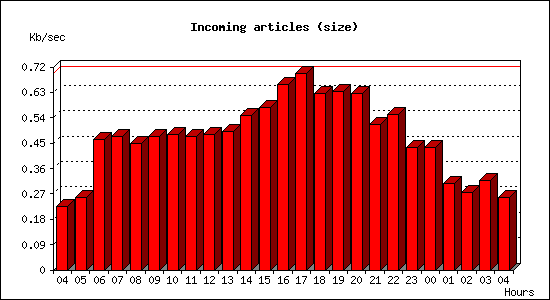
Incoming articles:
| Date | Articles | %Arts | Art/sec | Size | %Size | KB/sec |
|---|---|---|---|---|---|---|
| Jun 22 04:15:01 - 04:59:59 | 202 | 1.5% | 0.07 | 607.9 KB | 1.5% | 0.23 |
| Jun 22 05:00:00 - 05:59:59 | 300 | 2.2% | 0.08 | 925.1 KB | 2.2% | 0.26 |
| Jun 22 06:00:00 - 06:59:59 | 505 | 3.7% | 0.14 | 1.6 MB | 4.0% | 0.46 |
| Jun 22 07:00:00 - 07:59:59 | 571 | 4.2% | 0.16 | 1.7 MB | 4.1% | 0.47 |
| Jun 22 08:00:00 - 08:59:59 | 608 | 4.5% | 0.17 | 1.6 MB | 3.9% | 0.45 |
| Jun 22 09:00:00 - 09:59:59 | 638 | 4.7% | 0.18 | 1.7 MB | 4.1% | 0.47 |
| Jun 22 10:00:00 - 10:59:59 | 641 | 4.7% | 0.18 | 1.7 MB | 4.2% | 0.48 |
| Jun 22 11:00:00 - 11:59:59 | 580 | 4.2% | 0.16 | 1.7 MB | 4.1% | 0.47 |
| Jun 22 12:00:00 - 12:59:59 | 634 | 4.6% | 0.18 | 1.7 MB | 4.2% | 0.48 |
| Jun 22 13:00:00 - 13:59:59 | 630 | 4.6% | 0.17 | 1.7 MB | 4.3% | 0.49 |
| Jun 22 14:00:00 - 14:59:59 | 687 | 5.0% | 0.19 | 1.9 MB | 4.8% | 0.55 |
| Jun 22 15:00:00 - 15:59:59 | 710 | 5.2% | 0.20 | 2.0 MB | 5.0% | 0.57 |
| Jun 22 16:00:00 - 16:59:59 | 843 | 6.2% | 0.23 | 2.3 MB | 5.7% | 0.66 |
| Jun 22 17:00:00 - 17:59:59 | 819 | 6.0% | 0.23 | 2.5 MB | 6.1% | 0.70 |
| Jun 22 18:00:00 - 18:59:59 | 713 | 5.2% | 0.20 | 2.2 MB | 5.5% | 0.63 |
| Jun 22 19:00:00 - 19:59:59 | 743 | 5.4% | 0.21 | 2.2 MB | 5.5% | 0.63 |
| Jun 22 20:00:00 - 20:59:59 | 654 | 4.8% | 0.18 | 2.2 MB | 5.5% | 0.63 |
| Jun 22 21:00:00 - 21:59:59 | 649 | 4.8% | 0.18 | 1.8 MB | 4.5% | 0.52 |
| Jun 22 22:00:00 - 22:59:59 | 623 | 4.6% | 0.17 | 1.9 MB | 4.8% | 0.55 |
| Jun 22 23:00:00 - 23:59:59 | 471 | 3.4% | 0.13 | 1.5 MB | 3.8% | 0.43 |
| Jun 23 00:00:00 - 00:59:59 | 422 | 3.1% | 0.12 | 1.5 MB | 3.8% | 0.43 |
| Jun 23 01:00:00 - 01:59:59 | 330 | 2.4% | 0.09 | 1.1 MB | 2.7% | 0.31 |
| Jun 23 02:00:00 - 02:59:59 | 293 | 2.1% | 0.08 | 990.9 KB | 2.4% | 0.28 |
| Jun 23 03:00:00 - 03:59:59 | 314 | 2.3% | 0.09 | 1.1 MB | 2.8% | 0.32 |
| Jun 23 04:00:00 - 04:15:01 | 74 | 0.5% | 0.08 | 230.8 KB | 0.6% | 0.26 |
| TOTAL: 24:00:00 | 13654 | 100.0% | 0.16 | 40.3 MB | 100.0% | 0.48 |

Sites sending bad articles:
| Server | Total | Group | Dist | Duplic | Unapp | TooOld | Site | Line | Other | |
|---|---|---|---|---|---|---|---|---|---|---|
| 1 | i2pn | 385 | 1 | 0 | 0 | 0 | 0 | 0 | 0 | 384 |
| TOTAL: 1 | 385 | 1 | 0 | 0 | 0 | 0 | 0 | 0 | 384 | |
Unwanted newsgroups [Top 20]:
| Newsgroup | Count |
|---|---|
| alt.sex.girl | 1 |
| TOTAL: 1 | 1 |
INND Perl filter [Top 20]:
| Reason | Count |
|---|---|
| EMP (phn path) | 9 |
| TOTAL: 1 | 9 |
NoCeM on Spool:
| Id | Good | Bad | Unique | Total |
|---|---|---|---|---|
| bleachbot@httrack.com | 31 | 0 | 33 | 33 |
| TOTAL: 1 | 31 | 5 | 33 | 33 |
Miscellaneous innd statistics [Top 10]:
| Event | Server | Number |
|---|---|---|
| Including strange strings | ||
| i2pn | 375 | |
| TOTAL: 1 | 375 | |
| TOTAL: 1 | 375 | |
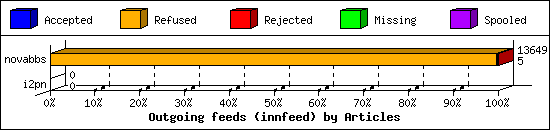
Outgoing Feeds (innfeed) by Articles:
| Server | Offered | Taken | Refused | Reject | Miss | Spool | %Took | Elapsed | |
|---|---|---|---|---|---|---|---|---|---|
| 1 | novabbs | 13665 | 5 | 13612 | 32 | 0 | 0 | 0% | 23:59:54 |
| 2 | i2pn | 0 | 0 | 0 | 0 | 0 | 0 | 0% | 00:10:00 |
| TOTAL: 2 | 13665 | 5 | 13612 | 32 | 0 | 0 | 0% | 24:09:54 | |
Outgoing Feeds (innfeed) by Volume:
| Server | AcceptVol | RejectVol | TotalVol | Volume/sec | Vol/Art | Elapsed | |
|---|---|---|---|---|---|---|---|
| 1 | novabbs | 19.3 KB | 87.2 KB | 106.5 KB | 0.0 KB/s | 2.9 KB | 23:59:54 |
| 2 | i2pn | 0.0 KB | 0.0 KB | 0.0 KB | 0.0 KB/s | 0 | 00:10:00 |
| TOTAL: 2 | 19.3 KB | 87.2 KB | 106.5 KB | 0.0 KB/s | 2.9 KB | 24:09:54 | |

NNRP readership statistics:
| System | Conn | Arts | Size | Groups | Post | Rej | Elapsed | |
|---|---|---|---|---|---|---|---|---|
| 1 | i2pn2.org | 57 | 2 | 2.3 KB | 2 | 0 | 0 | 00:01:00 |
| TOTAL: 1 | 57 | 2 | 2.3 KB | 2 | 0 | 0 | 00:01:10 | |
NNRP readership statistics (by domain):
| System | Conn | Arts | Size | Groups | Post | Rej | Elapsed | |
|---|---|---|---|---|---|---|---|---|
| 1 | *.org | 57 | 2 | 2.3 KB | 2 | 0 | 0 | 00:01:00 |
| 2 | unresolved | 1 | 0 | 0.0 KB | 0 | 0 | 0 | 00:00:09 |
| TOTAL: 2 | 58 | 2 | 2.3 KB | 2 | 0 | 0 | 00:01:10 | |
NNRP auth users [Top 20]:
| User | Conn |
|---|---|
| i2pn2user | 57 |
| TOTAL: 1 | 57 |
NNRP total resource statistics [Top 20]:
| System | User(ms) | System(ms) | Idle(ms) | Elapsed |
|---|---|---|---|---|
| i2pn2.org | 5.732 | 0.604 | 5.323 | 00:01:00 |
| 162.243.144.26 | 0.048 | 0.000 | 0.000 | 00:00:09 |
| TOTAL: 2 | 5.780 | 0.604 | 5.323 | 00:01:10 |
Curious NNRP server explorers [Top 20]:
| System | Conn |
|---|---|
| 162.243.144.26 | 1 |
| TOTAL: 1 | 1 |
Newsgroup request counts (by category):
| Category | Count | Pct | |
|---|---|---|---|
| 1 | rocksolid | 2 | 100.0% |
| TOTAL: 1 | 2 | 100.0% | |
Newsgroup request counts (by newsgroup) [Top 100]:
| Newsgroup | Count | |
|---|---|---|
| 1 | rocksolid.shared.rocksolid | 2 |
| TOTAL: 1 | 2 | |
