Log entries by program:
| Program name | Lines | %Lines | Size | %Size |
|---|---|---|---|---|
| inn | 14046 | 84.8% | 1.2 MB | 80.1% |
| innd | 1076 | 6.5% | 156.6 KB | 10.6% |
| nnrpd | 798 | 4.8% | 63.2 KB | 4.3% |
| innfeed | 600 | 3.6% | 71.1 KB | 4.8% |
| nocem | 46 | 0.3% | 4.3 KB | 0.3% |
| controlchan | 1 | 0.0% | 0.1 KB | 0.0% |
| TOTAL: 6 | 16567 | 100.0% | 1.4 MB | 100.0% |
History cache:
| Reason | Count | %Count |
|---|---|---|
| Do not exist | 13545 | 98.8% |
| Negative hits | 141 | 1.0% |
| Positive hits | 16 | 0.1% |
| Cache misses | 9 | 0.1% |
| TOTAL: 4 | 13711 | 100.0% |
INND timer:
| Code region | Time | Pct | Invoked | Min(ms) | Avg(ms) | Max(ms) |
|---|---|---|---|---|---|---|
| article cancel | 00:00:00.022 | 0.0% | 66 | 0.000 | 0.333 | 1.000 |
| article cleanup | 00:00:00.069 | 0.0% | 13546 | 0.000 | 0.005 | 0.049 |
| article logging | 00:00:00.368 | 0.0% | 13988 | 0.000 | 0.026 | 0.070 |
| article parse | 00:00:00.193 | 0.0% | 15267 | 0.000 | 0.013 | 0.071 |
| article write | 00:00:02.722 | 0.0% | 13479 | 0.075 | 0.202 | 1.115 |
| artlog/artcncl | 00:00:00.001 | 0.0% | 65 | 0.000 | 0.015 | 0.333 |
| data move | 00:00:00.018 | 0.0% | 17081 | 0.000 | 0.001 | 0.015 |
| hisgrep/artcncl | 00:00:00.002 | 0.0% | 32 | 0.000 | 0.062 | 0.250 |
| hishave/artcncl | 00:00:00.000 | 0.0% | 66 | 0.000 | 0.000 | 0.000 |
| history grep | 00:00:00.000 | 0.0% | 0 | 0.000 | 0.000 | 0.000 |
| history lookup | 00:00:00.091 | 0.0% | 13696 | 0.000 | 0.007 | 0.060 |
| history sync | 00:00:00.018 | 0.0% | 421 | 0.000 | 0.043 | 0.667 |
| history write | 00:00:00.555 | 0.0% | 13546 | 0.000 | 0.041 | 0.587 |
| hiswrite/artcncl | 00:00:00.001 | 0.0% | 34 | 0.000 | 0.029 | 1.000 |
| idle | 24:00:39.047 | 100.0% | 15957 | 2998.725 | 5416.999 | 13966.488 |
| nntp read | 00:00:00.414 | 0.0% | 15494 | 0.000 | 0.027 | 0.087 |
| overview write | 00:00:02.497 | 0.0% | 13479 | 0.032 | 0.185 | 2.286 |
| perl filter | 00:00:19.101 | 0.0% | 13546 | 1.153 | 1.410 | 1.917 |
| python filter | 00:00:00.000 | 0.0% | 0 | 0.000 | 0.000 | 0.000 |
| site send | 00:00:01.002 | 0.0% | 13516 | 0.000 | 0.074 | 0.200 |
| TOTAL: 24:01:08.601 | 24:01:06.121 | 100.0% | - | - | - | - |
INNfeed timer:
| Code region | Time | Pct | Invoked | Min(ms) | Avg(ms) | Max(ms) |
|---|---|---|---|---|---|---|
| article new | 00:00:00.027 | 0.0% | 13461 | 0.000 | 0.002 | 0.056 |
| article prepare | 00:00:00.000 | 0.0% | 412 | 0.000 | 0.000 | 0.000 |
| article read | 00:00:00.027 | 0.0% | 103 | 0.000 | 0.262 | 24.000 |
| backlog stats | 00:00:00.015 | 0.0% | 45176 | 0.000 | 0.000 | 0.005 |
| callbacks | 00:00:00.000 | 0.0% | 0 | 0.000 | 0.000 | 0.000 |
| data read | 00:00:00.213 | 0.0% | 27118 | 0.000 | 0.008 | 0.045 |
| data write | 00:00:00.351 | 0.0% | 13661 | 0.000 | 0.026 | 0.070 |
| idle | 23:58:44.146 | 100.0% | 45176 | 1122.377 | 1910.841 | 4444.305 |
| status file | 00:00:00.045 | 0.0% | 152 | 0.000 | 0.296 | 1.000 |
| TOTAL: 23:58:45.280 | 23:58:44.824 | 100.0% | - | - | - | - |
nnrpd timer:
| Code region | Time | Pct | Invoked | Min(ms) | Avg(ms) | Max(ms) |
|---|---|---|---|---|---|---|
| idle | 00:00:46.240 | 69.9% | 1787 | 7.167 | 25.876 | 4090.000 |
| newnews | 00:00:00.000 | 0.0% | 0 | 0.000 | 0.000 | 0.000 |
| nntpwrite | 00:00:00.065 | 0.1% | 6047 | 0.000 | 0.011 | 0.250 |
| TOTAL: 00:01:06.167 | 00:00:46.305 | 70.0% | - | - | - | - |
Control commands to INND:
| Command | Number |
|---|---|
| L | 1 |
| flush | 3 |
| flushlogs | 2 |
| go | 2 |
| logmode | 2 |
| mode | 148 |
| name | 2 |
| pause | 2 |
| paused | 2 |
| reload | 2 |
| reserve | 2 |
| TOTAL: 11 | 168 |
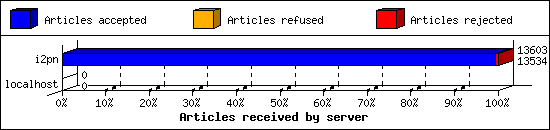
Incoming Feeds (INN):
| Server | Connects | Offered | Taken | Refused | Reject | %Accpt | Elapsed | |
|---|---|---|---|---|---|---|---|---|
| 1 | i2pn | 5 | 13603 | 13534 | 0 | 69 | 99% | 24:44:33 |
| 2 | localhost | 30 | 0 | 0 | 0 | 0 | 0% | 00:00:00 |
| TOTAL: 2 | 35 | 13603 | 13534 | 0 | 69 | 99% | 24:44:33 | |
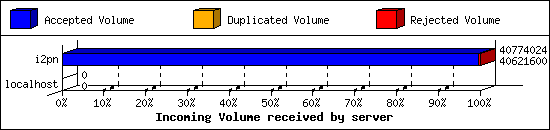
Incoming Volume (INN):
| Server | AcceptVol | DupVol | RejVol | TotalVol | %Acc | Vol/Art | |
|---|---|---|---|---|---|---|---|
| 1 | i2pn | 38.7 MB | 0.0 KB | 148.9 KB | 38.9 MB | 99% | 2.9 KB |
| 2 | localhost | 0.0 KB | 0.0 KB | 0.0 KB | 0.0 KB | 0% | 0 |
| TOTAL: 2 | 38.7 MB | 0.0 KB | 148.9 KB | 38.9 MB | 99% | 2.9 KB | |
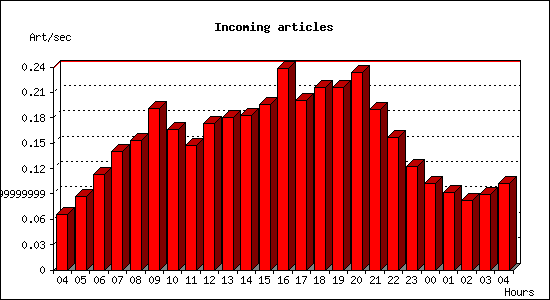
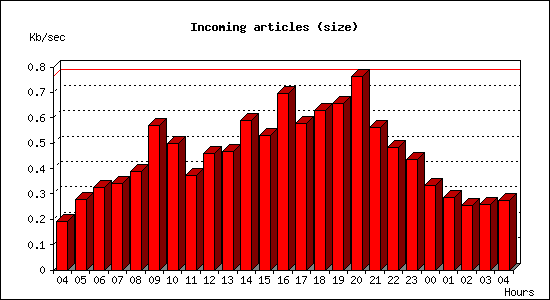
Incoming articles:
| Date | Articles | %Arts | Art/sec | Size | %Size | KB/sec |
|---|---|---|---|---|---|---|
| Jun 23 04:15:01 - 04:59:59 | 178 | 1.3% | 0.07 | 518.5 KB | 1.3% | 0.19 |
| Jun 23 05:00:00 - 05:59:59 | 314 | 2.3% | 0.09 | 1007.1 KB | 2.6% | 0.28 |
| Jun 23 06:00:00 - 06:59:59 | 406 | 3.0% | 0.11 | 1.1 MB | 2.9% | 0.32 |
| Jun 23 07:00:00 - 07:59:59 | 503 | 3.7% | 0.14 | 1.2 MB | 3.1% | 0.34 |
| Jun 23 08:00:00 - 08:59:59 | 550 | 4.1% | 0.15 | 1.4 MB | 3.5% | 0.39 |
| Jun 23 09:00:00 - 09:59:59 | 689 | 5.1% | 0.19 | 2.0 MB | 5.2% | 0.57 |
| Jun 23 10:00:00 - 10:59:59 | 600 | 4.5% | 0.17 | 1.8 MB | 4.5% | 0.50 |
| Jun 23 11:00:00 - 11:59:59 | 528 | 3.9% | 0.15 | 1.3 MB | 3.4% | 0.37 |
| Jun 23 12:00:00 - 12:59:59 | 625 | 4.6% | 0.17 | 1.6 MB | 4.2% | 0.46 |
| Jun 23 13:00:00 - 13:59:59 | 650 | 4.8% | 0.18 | 1.6 MB | 4.3% | 0.47 |
| Jun 23 14:00:00 - 14:59:59 | 659 | 4.9% | 0.18 | 2.1 MB | 5.4% | 0.59 |
| Jun 23 15:00:00 - 15:59:59 | 705 | 5.2% | 0.20 | 1.9 MB | 4.8% | 0.53 |
| Jun 23 16:00:00 - 16:59:59 | 857 | 6.4% | 0.24 | 2.5 MB | 6.4% | 0.70 |
| Jun 23 17:00:00 - 17:59:59 | 721 | 5.4% | 0.20 | 2.0 MB | 5.3% | 0.58 |
| Jun 23 18:00:00 - 18:59:59 | 776 | 5.8% | 0.22 | 2.2 MB | 5.7% | 0.63 |
| Jun 23 19:00:00 - 19:59:59 | 775 | 5.8% | 0.22 | 2.3 MB | 6.0% | 0.65 |
| Jun 23 20:00:00 - 20:59:59 | 839 | 6.2% | 0.23 | 2.7 MB | 7.0% | 0.76 |
| Jun 23 21:00:00 - 21:59:59 | 685 | 5.1% | 0.19 | 2.0 MB | 5.1% | 0.56 |
| Jun 23 22:00:00 - 22:59:59 | 564 | 4.2% | 0.16 | 1.7 MB | 4.4% | 0.48 |
| Jun 23 23:00:00 - 23:59:59 | 439 | 3.3% | 0.12 | 1.5 MB | 4.0% | 0.44 |
| Jun 24 00:00:00 - 00:59:59 | 368 | 2.7% | 0.10 | 1.2 MB | 3.0% | 0.33 |
| Jun 24 01:00:00 - 01:59:59 | 331 | 2.5% | 0.09 | 1023.8 KB | 2.6% | 0.28 |
| Jun 24 02:00:00 - 02:59:59 | 294 | 2.2% | 0.08 | 918.2 KB | 2.3% | 0.26 |
| Jun 24 03:00:00 - 03:59:59 | 323 | 2.4% | 0.09 | 932.4 KB | 2.4% | 0.26 |
| Jun 24 04:00:00 - 04:15:01 | 92 | 0.7% | 0.10 | 245.9 KB | 0.6% | 0.27 |
| TOTAL: 24:00:00 | 13471 | 100.0% | 0.16 | 38.6 MB | 100.0% | 0.46 |
Sites sending bad articles:
| Server | Total | Group | Dist | Duplic | Unapp | TooOld | Site | Line | Other | |
|---|---|---|---|---|---|---|---|---|---|---|
| 1 | i2pn | 511 | 12 | 0 | 0 | 0 | 0 | 0 | 0 | 499 |
| TOTAL: 1 | 511 | 12 | 0 | 0 | 0 | 0 | 0 | 0 | 499 | |
Unwanted newsgroups [Top 20]:
| Newsgroup | Count |
|---|---|
| alt.pl.nieruchomosci.gielda | 11 |
| adobe.illustrator.windows | 1 |
| TOTAL: 2 | 12 |
INND Perl filter [Top 20]:
| Reason | Count |
|---|---|
| EMP (phn path) | 57 |
| TOTAL: 1 | 57 |
NoCeM on Spool:
| Id | Good | Bad | Unique | Total |
|---|---|---|---|---|
| bleachbot@httrack.com | 36 | 0 | 37 | 37 |
| TOTAL: 1 | 36 | 5 | 37 | 37 |
Miscellaneous innd statistics [Top 10]:
| Event | Server | Number |
|---|---|---|
| Including strange strings | ||
| i2pn | 442 | |
| TOTAL: 1 | 442 | |
| TOTAL: 1 | 442 | |
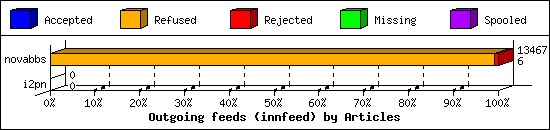
Outgoing Feeds (innfeed) by Articles:
| Server | Offered | Taken | Refused | Reject | Miss | Spool | %Took | Elapsed | |
|---|---|---|---|---|---|---|---|---|---|
| 1 | novabbs | 13556 | 6 | 13364 | 97 | 0 | 0 | 0% | 23:59:58 |
| 2 | i2pn | 0 | 0 | 0 | 0 | 0 | 0 | 0% | 00:10:00 |
| TOTAL: 2 | 13556 | 6 | 13364 | 97 | 0 | 0 | 0% | 24:09:58 | |
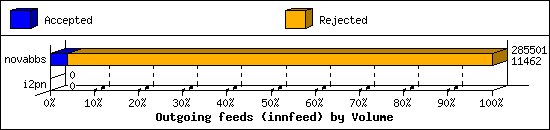
Outgoing Feeds (innfeed) by Volume:
| Server | AcceptVol | RejectVol | TotalVol | Volume/sec | Vol/Art | Elapsed | |
|---|---|---|---|---|---|---|---|
| 1 | novabbs | 11.2 KB | 267.6 KB | 278.8 KB | 0.0 KB/s | 2.7 KB | 23:59:58 |
| 2 | i2pn | 0.0 KB | 0.0 KB | 0.0 KB | 0.0 KB/s | 0 | 00:10:00 |
| TOTAL: 2 | 11.2 KB | 267.6 KB | 278.8 KB | 0.0 KB/s | 2.7 KB | 24:09:58 | |
NNRP readership statistics:
| System | Conn | Arts | Size | Groups | Post | Rej | Elapsed | |
|---|---|---|---|---|---|---|---|---|
| 1 | 91.191.223.182 | 1 | 0 | 0.0 KB | 0 | 0 | 0 | 00:00:05 |
| 2 | i2pn2.org | 61 | 0 | 0.0 KB | 0 | 0 | 0 | 00:01:00 |
| 3 | 185.156.177.20 | 1 | 0 | 0.0 KB | 0 | 0 | 0 | 00:00:00 |
| TOTAL: 3 | 63 | 0 | 0.0 KB | 0 | 0 | 0 | 00:01:05 | |
NNRP readership statistics (by domain):
| System | Conn | Arts | Size | Groups | Post | Rej | Elapsed | |
|---|---|---|---|---|---|---|---|---|
| 1 | *.org | 61 | 0 | 0.0 KB | 0 | 0 | 0 | 00:01:00 |
| 2 | unresolved | 2 | 0 | 0.0 KB | 0 | 0 | 0 | 00:00:05 |
| TOTAL: 2 | 63 | 0 | 0.0 KB | 0 | 0 | 0 | 00:01:05 | |
NNRP auth users [Top 20]:
| User | Conn |
|---|---|
| i2pn2user | 61 |
| TOTAL: 1 | 61 |
NNRP total resource statistics [Top 20]:
| System | User(ms) | System(ms) | Idle(ms) | Elapsed |
|---|---|---|---|---|
| i2pn2.org | 5.944 | 0.648 | 5.509 | 00:01:00 |
| 91.191.223.182 | 0.060 | 0.008 | 0.000 | 00:00:05 |
| 185.156.177.20 | 0.056 | 0.008 | 0.000 | 00:00:00 |
| TOTAL: 3 | 6.060 | 0.664 | 5.509 | 00:01:05 |
NNRP unrecognized commands (by host):
| System | Conn |
|---|---|
| 185.156.177.20 | 1 |
| TOTAL: 1 | 1 |
NNRP unrecognized commands (by command):
| Command | Count |
|---|---|
| #003 | 1 |
| TOTAL: 1 | 1 |
NNRP client timeouts [Top 20]:
| System | Conn | Peer |
|---|---|---|
| 185.156.177.20 | 1 | 1 |
| TOTAL: 1 | 1 | 1 |
