Log entries by program:
| Program name | Lines | %Lines | Size | %Size |
|---|---|---|---|---|
| inn | 16759 | 89.2% | 1.4 MB | 84.2% |
| innd | 1073 | 5.7% | 158.7 KB | 9.6% |
| innfeed | 605 | 3.2% | 70.8 KB | 4.3% |
| nnrpd | 272 | 1.4% | 21.7 KB | 1.3% |
| nocem | 62 | 0.3% | 5.7 KB | 0.3% |
| controlchan | 12 | 0.1% | 2.4 KB | 0.1% |
| pgpverify | 1 | 0.0% | 0.1 KB | 0.0% |
| TOTAL: 7 | 18784 | 100.0% | 1.6 MB | 100.0% |
History cache:
| Reason | Count | %Count |
|---|---|---|
| Do not exist | 16258 | 98.8% |
| Negative hits | 134 | 0.8% |
| Positive hits | 52 | 0.3% |
| Cache misses | 16 | 0.1% |
| TOTAL: 4 | 16460 | 100.0% |
INND timer:
| Code region | Time | Pct | Invoked | Min(ms) | Avg(ms) | Max(ms) |
|---|---|---|---|---|---|---|
| article cancel | 00:00:00.045 | 0.0% | 104 | 0.000 | 0.433 | 1.750 |
| article cleanup | 00:00:00.086 | 0.0% | 16286 | 0.000 | 0.005 | 0.030 |
| article logging | 00:00:00.485 | 0.0% | 16677 | 0.000 | 0.029 | 0.082 |
| article parse | 00:00:00.266 | 0.0% | 18779 | 0.000 | 0.014 | 0.073 |
| article write | 00:00:03.489 | 0.0% | 16252 | 0.056 | 0.215 | 3.849 |
| artlog/artcncl | 00:00:00.001 | 0.0% | 104 | 0.000 | 0.010 | 0.500 |
| data move | 00:00:00.011 | 0.0% | 21276 | 0.000 | 0.001 | 0.018 |
| hisgrep/artcncl | 00:00:00.003 | 0.0% | 76 | 0.000 | 0.039 | 0.250 |
| hishave/artcncl | 00:00:00.001 | 0.0% | 104 | 0.000 | 0.010 | 0.111 |
| history grep | 00:00:00.000 | 0.0% | 0 | 0.000 | 0.000 | 0.000 |
| history lookup | 00:00:00.115 | 0.0% | 16443 | 0.000 | 0.007 | 0.130 |
| history sync | 00:00:00.019 | 0.0% | 413 | 0.000 | 0.046 | 0.667 |
| history write | 00:00:00.561 | 0.0% | 16286 | 0.000 | 0.034 | 0.194 |
| hiswrite/artcncl | 00:00:00.000 | 0.0% | 28 | 0.000 | 0.000 | 0.000 |
| idle | 24:00:33.966 | 100.0% | 19444 | 2531.051 | 4445.277 | 15013.100 |
| nntp read | 00:00:00.519 | 0.0% | 19026 | 0.000 | 0.027 | 0.066 |
| overview write | 00:00:03.036 | 0.0% | 16252 | 0.000 | 0.187 | 2.195 |
| perl filter | 00:00:24.444 | 0.0% | 16286 | 1.181 | 1.501 | 2.333 |
| python filter | 00:00:00.000 | 0.0% | 0 | 0.000 | 0.000 | 0.000 |
| site send | 00:00:00.843 | 0.0% | 16308 | 0.000 | 0.052 | 0.138 |
| TOTAL: 24:01:10.768 | 24:01:07.890 | 100.0% | - | - | - | - |
INNfeed timer:
| Code region | Time | Pct | Invoked | Min(ms) | Avg(ms) | Max(ms) |
|---|---|---|---|---|---|---|
| article new | 00:00:00.027 | 0.0% | 16231 | 0.000 | 0.002 | 0.025 |
| article prepare | 00:00:00.000 | 0.0% | 520 | 0.000 | 0.000 | 0.000 |
| article read | 00:00:00.025 | 0.0% | 130 | 0.000 | 0.192 | 10.500 |
| backlog stats | 00:00:00.012 | 0.0% | 53372 | 0.000 | 0.000 | 0.004 |
| callbacks | 00:00:00.000 | 0.0% | 0 | 0.000 | 0.000 | 0.000 |
| data read | 00:00:00.250 | 0.0% | 32625 | 0.000 | 0.008 | 0.039 |
| data write | 00:00:00.311 | 0.0% | 16402 | 0.000 | 0.019 | 0.050 |
| idle | 23:59:02.200 | 100.0% | 53372 | 925.657 | 1617.743 | 4778.024 |
| status file | 00:00:00.042 | 0.0% | 156 | 0.000 | 0.269 | 1.000 |
| TOTAL: 23:59:03.377 | 23:59:02.867 | 100.0% | - | - | - | - |
nnrpd timer:
| Code region | Time | Pct | Invoked | Min(ms) | Avg(ms) | Max(ms) |
|---|---|---|---|---|---|---|
| idle | 00:00:15.141 | 54.0% | 375 | 7.167 | 40.376 | 9810.000 |
| newnews | 00:00:00.000 | 0.0% | 0 | 0.000 | 0.000 | 0.000 |
| nntpwrite | 00:00:00.018 | 0.1% | 1276 | 0.000 | 0.014 | 0.095 |
| readart | 00:00:00.067 | 0.2% | 3 | 22.000 | 22.333 | 23.000 |
| TOTAL: 00:00:28.027 | 00:00:15.226 | 54.3% | - | - | - | - |
Control commands to INND:
| Command | Number |
|---|---|
| L | 1 |
| flush | 3 |
| flushlogs | 2 |
| go | 2 |
| logmode | 2 |
| mode | 149 |
| name | 2 |
| pause | 2 |
| paused | 2 |
| reload | 2 |
| reserve | 2 |
| TOTAL: 11 | 169 |
Control Channel:
| Sender | newgroup | rmgroup | Other | Bad PGP | DoIt | OK |
|---|---|---|---|---|---|---|
| hun-mnt@news.sztaki.hu | 0 | 0 | 1 | 1 | 0 | 1 |
| TOTAL | 0 | 0 | 1 | 1 | 0 | 1 |
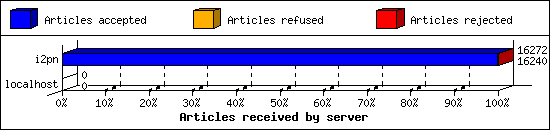
Incoming Feeds (INN):
| Server | Connects | Offered | Taken | Refused | Reject | %Accpt | Elapsed | |
|---|---|---|---|---|---|---|---|---|
| 1 | i2pn | 4 | 16272 | 16240 | 0 | 32 | 99% | 24:26:08 |
| 2 | localhost | 31 | 0 | 0 | 0 | 0 | 0% | 00:00:00 |
| TOTAL: 2 | 35 | 16272 | 16240 | 0 | 32 | 99% | 24:26:08 | |
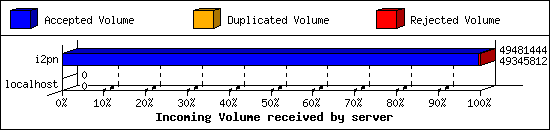
Incoming Volume (INN):
| Server | AcceptVol | DupVol | RejVol | TotalVol | %Acc | Vol/Art | |
|---|---|---|---|---|---|---|---|
| 1 | i2pn | 47.1 MB | 0.0 KB | 132.5 KB | 47.2 MB | 99% | 3.0 KB |
| 2 | localhost | 0.0 KB | 0.0 KB | 0.0 KB | 0.0 KB | 0% | 0 |
| TOTAL: 2 | 47.1 MB | 0.0 KB | 132.5 KB | 47.2 MB | 99% | 3.0 KB | |
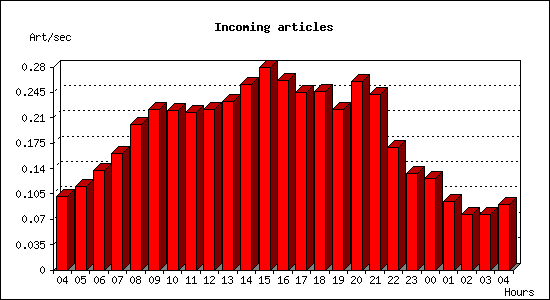
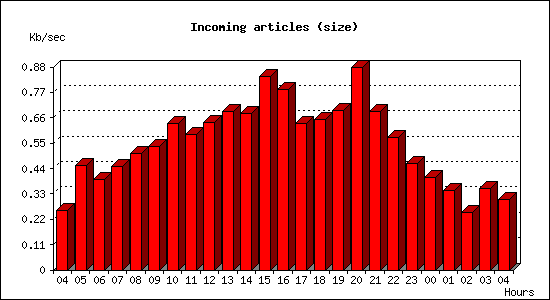
Incoming articles:
| Date | Articles | %Arts | Art/sec | Size | %Size | KB/sec |
|---|---|---|---|---|---|---|
| Jul 1 04:15:01 - 04:59:59 | 272 | 1.7% | 0.10 | 699.7 KB | 1.5% | 0.26 |
| Jul 1 05:00:00 - 05:59:59 | 416 | 2.6% | 0.12 | 1.6 MB | 3.4% | 0.45 |
| Jul 1 06:00:00 - 06:59:59 | 492 | 3.0% | 0.14 | 1.4 MB | 2.9% | 0.39 |
| Jul 1 07:00:00 - 07:59:59 | 579 | 3.6% | 0.16 | 1.6 MB | 3.4% | 0.45 |
| Jul 1 08:00:00 - 08:59:59 | 720 | 4.4% | 0.20 | 1.8 MB | 3.8% | 0.50 |
| Jul 1 09:00:00 - 09:59:59 | 798 | 4.9% | 0.22 | 1.9 MB | 4.0% | 0.53 |
| Jul 1 10:00:00 - 10:59:59 | 791 | 4.9% | 0.22 | 2.2 MB | 4.7% | 0.63 |
| Jul 1 11:00:00 - 11:59:59 | 781 | 4.8% | 0.22 | 2.1 MB | 4.4% | 0.59 |
| Jul 1 12:00:00 - 12:59:59 | 797 | 4.9% | 0.22 | 2.2 MB | 4.8% | 0.64 |
| Jul 1 13:00:00 - 13:59:59 | 837 | 5.2% | 0.23 | 2.4 MB | 5.1% | 0.69 |
| Jul 1 14:00:00 - 14:59:59 | 921 | 5.7% | 0.26 | 2.4 MB | 5.1% | 0.68 |
| Jul 1 15:00:00 - 15:59:59 | 1005 | 6.2% | 0.28 | 3.0 MB | 6.3% | 0.84 |
| Jul 1 16:00:00 - 16:59:59 | 939 | 5.8% | 0.26 | 2.8 MB | 5.9% | 0.78 |
| Jul 1 17:00:00 - 17:59:59 | 879 | 5.4% | 0.24 | 2.2 MB | 4.8% | 0.64 |
| Jul 1 18:00:00 - 18:59:59 | 888 | 5.5% | 0.25 | 2.3 MB | 4.9% | 0.65 |
| Jul 1 19:00:00 - 19:59:59 | 797 | 4.9% | 0.22 | 2.4 MB | 5.2% | 0.69 |
| Jul 1 20:00:00 - 20:59:59 | 934 | 5.8% | 0.26 | 3.1 MB | 6.6% | 0.88 |
| Jul 1 21:00:00 - 21:59:59 | 872 | 5.4% | 0.24 | 2.4 MB | 5.1% | 0.69 |
| Jul 1 22:00:00 - 22:59:59 | 608 | 3.7% | 0.17 | 2.0 MB | 4.3% | 0.57 |
| Jul 1 23:00:00 - 23:59:59 | 481 | 3.0% | 0.13 | 1.6 MB | 3.5% | 0.46 |
| Jul 2 00:00:00 - 00:59:59 | 455 | 2.8% | 0.13 | 1.4 MB | 3.0% | 0.40 |
| Jul 2 01:00:00 - 01:59:59 | 340 | 2.1% | 0.09 | 1.2 MB | 2.6% | 0.35 |
| Jul 2 02:00:00 - 02:59:59 | 276 | 1.7% | 0.08 | 891.1 KB | 1.8% | 0.25 |
| Jul 2 03:00:00 - 03:59:59 | 274 | 1.7% | 0.08 | 1.2 MB | 2.7% | 0.35 |
| Jul 2 04:00:00 - 04:15:02 | 82 | 0.5% | 0.09 | 274.3 KB | 0.6% | 0.30 |
| TOTAL: 24:00:01 | 16234 | 100.0% | 0.19 | 47.0 MB | 100.0% | 0.56 |
Sites sending bad articles:
| Server | Total | Group | Dist | Duplic | Unapp | TooOld | Site | Line | Other | |
|---|---|---|---|---|---|---|---|---|---|---|
| 1 | i2pn | 422 | 5 | 0 | 0 | 0 | 0 | 0 | 0 | 417 |
| TOTAL: 1 | 422 | 5 | 0 | 0 | 0 | 0 | 0 | 0 | 417 | |
Unwanted newsgroups [Top 20]:
| Newsgroup | Count |
|---|---|
| hk.politics | 2 |
| 24hoursupport.helpdesk | 1 |
| alt.jokes | 1 |
| alt.pl.nieruchomosci.gielda | 1 |
| TOTAL: 4 | 5 |
INND Perl filter [Top 20]:
| Reason | Count |
|---|---|
| EMP (phn path) | 26 |
| EMP (phl) | 1 |
| TOTAL: 2 | 27 |
NoCeM on Spool:
| Id | Good | Bad | Unique | Total |
|---|---|---|---|---|
| bleachbot@httrack.com | 41 | 0 | 48 | 48 |
| TOTAL: 1 | 41 | 15 | 48 | 48 |
Miscellaneous innd statistics [Top 10]:
| Event | Server | Number |
|---|---|---|
| Including strange strings | ||
| i2pn | 390 | |
| TOTAL: 1 | 390 | |
| TOTAL: 1 | 390 | |
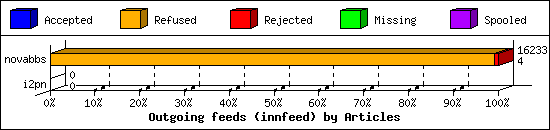
Outgoing Feeds (innfeed) by Articles:
| Server | Offered | Taken | Refused | Reject | Miss | Spool | %Took | Elapsed | |
|---|---|---|---|---|---|---|---|---|---|
| 1 | novabbs | 16266 | 4 | 16103 | 126 | 0 | 0 | 0% | 23:59:58 |
| 2 | i2pn | 0 | 0 | 0 | 0 | 0 | 0 | 0% | 00:10:00 |
| TOTAL: 2 | 16266 | 4 | 16103 | 126 | 0 | 0 | 0% | 24:09:58 | |
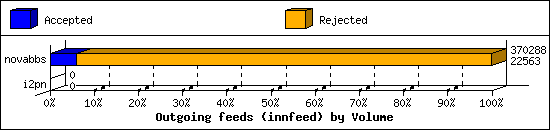
Outgoing Feeds (innfeed) by Volume:
| Server | AcceptVol | RejectVol | TotalVol | Volume/sec | Vol/Art | Elapsed | |
|---|---|---|---|---|---|---|---|
| 1 | novabbs | 22.0 KB | 339.6 KB | 361.6 KB | 0.0 KB/s | 2.8 KB | 23:59:58 |
| 2 | i2pn | 0.0 KB | 0.0 KB | 0.0 KB | 0.0 KB/s | 0 | 00:10:00 |
| TOTAL: 2 | 22.0 KB | 339.6 KB | 361.6 KB | 0.0 KB/s | 2.8 KB | 24:09:58 | |
NNRP readership statistics:
| System | Conn | Arts | Size | Groups | Post | Rej | Elapsed | |
|---|---|---|---|---|---|---|---|---|
| 1 | i2pn2.org | 42 | 3 | 9.6 KB | 3 | 0 | 0 | 00:00:17 |
| TOTAL: 1 | 42 | 3 | 9.6 KB | 3 | 0 | 0 | 00:00:27 | |
NNRP readership statistics (by domain):
| System | Conn | Arts | Size | Groups | Post | Rej | Elapsed | |
|---|---|---|---|---|---|---|---|---|
| 1 | *.org | 42 | 3 | 9.6 KB | 3 | 0 | 0 | 00:00:17 |
| 2 | *.sfj.corp.censys.io | 1 | 0 | 0.0 KB | 0 | 0 | 0 | 00:00:00 |
| 3 | unresolved | 1 | 0 | 0.0 KB | 0 | 0 | 0 | 00:00:09 |
| 4 | *.security.ipip.net | 1 | 0 | 0.0 KB | 0 | 0 | 0 | 00:00:00 |
| TOTAL: 4 | 45 | 3 | 9.6 KB | 3 | 0 | 0 | 00:00:27 | |
NNRP auth users [Top 20]:
| User | Conn |
|---|---|
| i2pn2user | 42 |
| TOTAL: 1 | 42 |
NNRP total resource statistics [Top 20]:
| System | User(ms) | System(ms) | Idle(ms) | Elapsed |
|---|---|---|---|---|
| i2pn2.org | 2.472 | 0.304 | 3.817 | 00:00:17 |
| 107.170.197.60 | 0.060 | 0.004 | 0.000 | 00:00:09 |
| scan-141.security.ipip.net | 0.044 | 0.004 | 0.000 | 00:00:00 |
| worker-18.sfj.corp.censys.io | 0.044 | 0.004 | 0.000 | 00:00:00 |
| TOTAL: 4 | 2.620 | 0.316 | 3.817 | 00:00:27 |
Curious NNRP server explorers [Top 20]:
| System | Conn |
|---|---|
| 107.170.197.60 | 1 |
| scan-141.security.ipip.net | 1 |
| worker-18.sfj.corp.censys.io | 1 |
| TOTAL: 3 | 3 |
NNRP unrecognized commands (by host):
| System | Conn |
|---|---|
| scan-141.security.ipip.net | 4 |
| TOTAL: 1 | 4 |
NNRP unrecognized commands (by command):
| Command | Count |
|---|---|
| User-Agent: HTTP Banner Detection (https... | 1 |
| GET / HTTP/1.1 | 1 |
| Host: 157.230.63.40:119 | 1 |
| Connection: close | 1 |
| TOTAL: 4 | 4 |
NNRP client timeouts [Top 20]:
| System | Conn | Peer |
|---|---|---|
| worker-18.sfj.corp.censys.io | 1 | 1 |
| TOTAL: 1 | 1 | 1 |
Newsgroup request counts (by category):
| Category | Count | Pct | |
|---|---|---|---|
| 1 | rocksolid | 3 | 100.0% |
| TOTAL: 1 | 3 | 100.0% | |
Newsgroup request counts (by newsgroup) [Top 100]:
| Newsgroup | Count | |
|---|---|---|
| 1 | rocksolid.shared.news | 3 |
| TOTAL: 1 | 3 | |
