Log entries by program:
| Program name | Lines | %Lines | Size | %Size |
|---|---|---|---|---|
| inn | 14235 | 88.7% | 1.2 MB | 83.3% |
| innd | 1037 | 6.5% | 152.5 KB | 10.6% |
| innfeed | 600 | 3.7% | 71.3 KB | 4.9% |
| nnrpd | 108 | 0.7% | 8.6 KB | 0.6% |
| nocem | 64 | 0.4% | 6.7 KB | 0.5% |
| controlchan | 12 | 0.1% | 2.2 KB | 0.2% |
| pgpverify | 1 | 0.0% | 0.1 KB | 0.0% |
| TOTAL: 7 | 16057 | 100.0% | 1.4 MB | 100.0% |
History cache:
| Reason | Count | %Count |
|---|---|---|
| Do not exist | 13763 | 97.5% |
| Negative hits | 290 | 2.1% |
| Positive hits | 50 | 0.4% |
| Cache misses | 20 | 0.1% |
| TOTAL: 4 | 14123 | 100.0% |
INND timer:
| Code region | Time | Pct | Invoked | Min(ms) | Avg(ms) | Max(ms) |
|---|---|---|---|---|---|---|
| article cancel | 00:00:00.045 | 0.0% | 114 | 0.000 | 0.395 | 2.000 |
| article cleanup | 00:00:00.093 | 0.0% | 13748 | 0.000 | 0.007 | 0.041 |
| article logging | 00:00:00.461 | 0.0% | 14129 | 0.000 | 0.033 | 0.089 |
| article parse | 00:00:00.193 | 0.0% | 16167 | 0.000 | 0.012 | 0.049 |
| article write | 00:00:03.860 | 0.0% | 13743 | 0.077 | 0.281 | 1.559 |
| artlog/artcncl | 00:00:00.003 | 0.0% | 111 | 0.000 | 0.027 | 0.250 |
| data move | 00:00:00.017 | 0.0% | 18600 | 0.000 | 0.001 | 0.014 |
| hisgrep/artcncl | 00:00:00.004 | 0.0% | 75 | 0.000 | 0.053 | 0.500 |
| hishave/artcncl | 00:00:00.000 | 0.0% | 114 | 0.000 | 0.000 | 0.000 |
| history grep | 00:00:00.000 | 0.0% | 0 | 0.000 | 0.000 | 0.000 |
| history lookup | 00:00:00.080 | 0.0% | 14049 | 0.000 | 0.006 | 0.071 |
| history sync | 00:00:00.009 | 0.0% | 304 | 0.000 | 0.030 | 0.500 |
| history write | 00:00:00.476 | 0.0% | 13748 | 0.000 | 0.035 | 0.268 |
| hiswrite/artcncl | 00:00:00.002 | 0.0% | 39 | 0.000 | 0.051 | 0.333 |
| idle | 23:59:53.651 | 100.0% | 16819 | 2476.847 | 5136.670 | 15002.075 |
| nntp read | 00:00:00.394 | 0.0% | 16563 | 0.000 | 0.024 | 0.060 |
| overview write | 00:00:02.279 | 0.0% | 13743 | 0.020 | 0.166 | 1.393 |
| perl filter | 00:00:20.310 | 0.0% | 13748 | 0.926 | 1.477 | 2.085 |
| python filter | 00:00:00.000 | 0.0% | 0 | 0.000 | 0.000 | 0.000 |
| site send | 00:00:00.555 | 0.0% | 13804 | 0.000 | 0.040 | 0.137 |
| TOTAL: 24:00:24.775 | 24:00:22.432 | 100.0% | - | - | - | - |
INNfeed timer:
| Code region | Time | Pct | Invoked | Min(ms) | Avg(ms) | Max(ms) |
|---|---|---|---|---|---|---|
| article new | 00:00:00.022 | 0.0% | 13741 | 0.000 | 0.002 | 0.019 |
| article prepare | 00:00:00.000 | 0.0% | 156 | 0.000 | 0.000 | 0.000 |
| article read | 00:00:00.027 | 0.0% | 39 | 0.000 | 0.692 | 25.000 |
| backlog stats | 00:00:00.009 | 0.0% | 45602 | 0.000 | 0.000 | 0.006 |
| callbacks | 00:00:00.000 | 0.0% | 0 | 0.000 | 0.000 | 0.000 |
| data read | 00:00:00.208 | 0.0% | 27484 | 0.000 | 0.008 | 0.032 |
| data write | 00:00:00.245 | 0.0% | 13794 | 0.000 | 0.018 | 0.070 |
| idle | 23:59:41.922 | 100.0% | 45602 | 905.792 | 1894.257 | 4459.193 |
| status file | 00:00:00.043 | 0.0% | 152 | 0.000 | 0.283 | 1.000 |
| TOTAL: 23:59:42.938 | 23:59:42.476 | 100.0% | - | - | - | - |
nnrpd timer:
| Code region | Time | Pct | Invoked | Min(ms) | Avg(ms) | Max(ms) |
|---|---|---|---|---|---|---|
| idle | 00:00:02.492 | 30.8% | 159 | 7.000 | 15.673 | 42.000 |
| newnews | 00:00:00.000 | 0.0% | 0 | 0.000 | 0.000 | 0.000 |
| nntpwrite | 00:00:00.005 | 0.1% | 538 | 0.000 | 0.009 | 0.048 |
| TOTAL: 00:00:08.078 | 00:00:02.497 | 30.9% | - | - | - | - |
Control commands to INND:
| Command | Number |
|---|---|
| L | 1 |
| flush | 3 |
| flushlogs | 2 |
| go | 2 |
| logmode | 2 |
| mode | 149 |
| name | 2 |
| pause | 2 |
| paused | 2 |
| reload | 2 |
| reserve | 2 |
| TOTAL: 11 | 169 |
Control Channel:
| Sender | newgroup | rmgroup | Other | Bad PGP | DoIt | OK |
|---|---|---|---|---|---|---|
| moderator@dana.de | 0 | 0 | 1 | 1 | 0 | 1 |
| TOTAL | 0 | 0 | 1 | 1 | 0 | 1 |
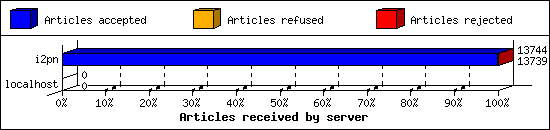
Incoming Feeds (INN):
| Server | Connects | Offered | Taken | Refused | Reject | %Accpt | Elapsed | |
|---|---|---|---|---|---|---|---|---|
| 1 | i2pn | 6 | 13744 | 13739 | 0 | 5 | 99% | 24:30:01 |
| 2 | localhost | 29 | 0 | 0 | 0 | 0 | 0% | 00:00:00 |
| TOTAL: 2 | 35 | 13744 | 13739 | 0 | 5 | 99% | 24:30:01 | |
Incoming Volume (INN):
| Server | AcceptVol | DupVol | RejVol | TotalVol | %Acc | Vol/Art | |
|---|---|---|---|---|---|---|---|
| 1 | i2pn | 41.0 MB | 0.0 KB | 14.7 KB | 41.0 MB | 99% | 3.1 KB |
| 2 | localhost | 0.0 KB | 0.0 KB | 0.0 KB | 0.0 KB | 0% | 0 |
| TOTAL: 2 | 41.0 MB | 0.0 KB | 14.7 KB | 41.0 MB | 99% | 3.1 KB | |

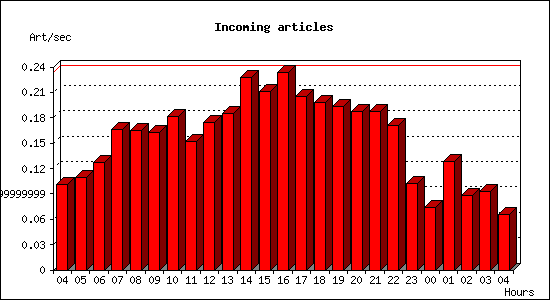
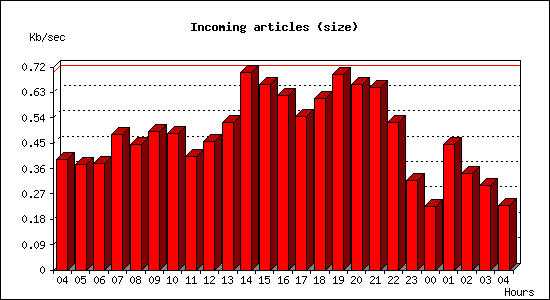
Incoming articles:
| Date | Articles | %Arts | Art/sec | Size | %Size | KB/sec |
|---|---|---|---|---|---|---|
| Jul 6 04:15:01 - 04:59:59 | 274 | 2.0% | 0.10 | 1.0 MB | 2.5% | 0.39 |
| Jul 6 05:00:00 - 05:59:59 | 395 | 2.9% | 0.11 | 1.3 MB | 3.2% | 0.37 |
| Jul 6 06:00:00 - 06:59:59 | 457 | 3.3% | 0.13 | 1.3 MB | 3.2% | 0.38 |
| Jul 6 07:00:00 - 07:59:59 | 599 | 4.4% | 0.17 | 1.7 MB | 4.1% | 0.48 |
| Jul 6 08:00:00 - 08:59:59 | 592 | 4.3% | 0.16 | 1.6 MB | 3.8% | 0.44 |
| Jul 6 09:00:00 - 09:59:59 | 586 | 4.3% | 0.16 | 1.7 MB | 4.2% | 0.49 |
| Jul 6 10:00:00 - 10:59:59 | 654 | 4.8% | 0.18 | 1.7 MB | 4.2% | 0.49 |
| Jul 6 11:00:00 - 11:59:59 | 548 | 4.0% | 0.15 | 1.4 MB | 3.4% | 0.40 |
| Jul 6 12:00:00 - 12:59:59 | 629 | 4.6% | 0.17 | 1.6 MB | 3.9% | 0.46 |
| Jul 6 13:00:00 - 13:59:59 | 666 | 4.8% | 0.18 | 1.8 MB | 4.5% | 0.52 |
| Jul 6 14:00:00 - 14:59:59 | 821 | 6.0% | 0.23 | 2.5 MB | 6.0% | 0.70 |
| Jul 6 15:00:00 - 15:59:59 | 758 | 5.5% | 0.21 | 2.3 MB | 5.6% | 0.66 |
| Jul 6 16:00:00 - 16:59:59 | 840 | 6.1% | 0.23 | 2.2 MB | 5.3% | 0.62 |
| Jul 6 17:00:00 - 17:59:59 | 738 | 5.4% | 0.20 | 1.9 MB | 4.7% | 0.54 |
| Jul 6 18:00:00 - 18:59:59 | 713 | 5.2% | 0.20 | 2.1 MB | 5.2% | 0.61 |
| Jul 6 19:00:00 - 19:59:59 | 698 | 5.1% | 0.19 | 2.4 MB | 5.9% | 0.69 |
| Jul 6 20:00:00 - 20:59:59 | 673 | 4.9% | 0.19 | 2.3 MB | 5.6% | 0.66 |
| Jul 6 21:00:00 - 21:59:59 | 675 | 4.9% | 0.19 | 2.3 MB | 5.5% | 0.65 |
| Jul 6 22:00:00 - 22:59:59 | 617 | 4.5% | 0.17 | 1.8 MB | 4.5% | 0.52 |
| Jul 6 23:00:00 - 23:59:59 | 367 | 2.7% | 0.10 | 1.1 MB | 2.7% | 0.32 |
| Jul 7 00:00:00 - 00:59:59 | 268 | 2.0% | 0.07 | 805.9 KB | 1.9% | 0.22 |
| Jul 7 01:00:00 - 01:59:59 | 462 | 3.4% | 0.13 | 1.6 MB | 3.8% | 0.44 |
| Jul 7 02:00:00 - 02:59:59 | 316 | 2.3% | 0.09 | 1.2 MB | 2.9% | 0.34 |
| Jul 7 03:00:00 - 03:59:59 | 334 | 2.4% | 0.09 | 1.1 MB | 2.6% | 0.30 |
| Jul 7 04:00:00 - 04:15:02 | 59 | 0.4% | 0.07 | 206.1 KB | 0.5% | 0.23 |
| TOTAL: 24:00:01 | 13739 | 100.0% | 0.16 | 41.0 MB | 100.0% | 0.49 |
Sites sending bad articles:
| Server | Total | Group | Dist | Duplic | Unapp | TooOld | Site | Line | Other | |
|---|---|---|---|---|---|---|---|---|---|---|
| 1 | i2pn | 385 | 2 | 0 | 0 | 0 | 0 | 0 | 0 | 383 |
| TOTAL: 1 | 385 | 2 | 0 | 0 | 0 | 0 | 0 | 0 | 383 | |
Unwanted newsgroups [Top 20]:
| Newsgroup | Count |
|---|---|
| hk.politics | 2 |
| TOTAL: 1 | 2 |
INND Perl filter [Top 20]:
| Reason | Count |
|---|---|
| EMP (phn nph) | 3 |
| TOTAL: 1 | 3 |
NoCeM on Spool:
| Id | Good | Bad | Unique | Total |
|---|---|---|---|---|
| bleachbot@httrack.com | 52 | 0 | 59 | 59 |
| TOTAL: 1 | 52 | 8 | 59 | 59 |
Miscellaneous innd statistics [Top 10]:
| Event | Server | Number |
|---|---|---|
| Including strange strings | ||
| i2pn | 380 | |
| TOTAL: 1 | 380 | |
| TOTAL: 1 | 380 | |
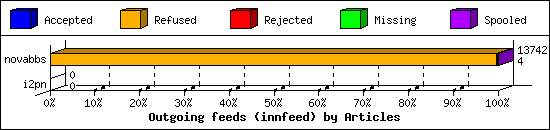
Outgoing Feeds (innfeed) by Articles:
| Server | Offered | Taken | Refused | Reject | Miss | Spool | %Took | Elapsed | |
|---|---|---|---|---|---|---|---|---|---|
| 1 | novabbs | 13761 | 4 | 13700 | 35 | 0 | 3 | 0% | 23:59:59 |
| 2 | i2pn | 0 | 0 | 0 | 0 | 0 | 0 | 0% | 00:10:00 |
| TOTAL: 2 | 13761 | 4 | 13700 | 35 | 0 | 3 | 0% | 24:09:59 | |
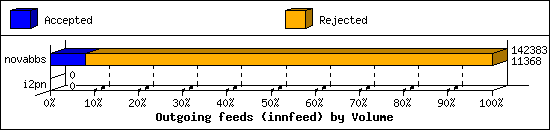
Outgoing Feeds (innfeed) by Volume:
| Server | AcceptVol | RejectVol | TotalVol | Volume/sec | Vol/Art | Elapsed | |
|---|---|---|---|---|---|---|---|
| 1 | novabbs | 11.1 KB | 127.9 KB | 139.0 KB | 0.0 KB/s | 3.6 KB | 23:59:59 |
| 2 | i2pn | 0.0 KB | 0.0 KB | 0.0 KB | 0.0 KB/s | 0 | 00:10:00 |
| TOTAL: 2 | 11.1 KB | 127.9 KB | 139.0 KB | 0.0 KB/s | 3.6 KB | 24:09:59 | |
NNRP readership statistics:
| System | Conn | Arts | Size | Groups | Post | Rej | Elapsed | |
|---|---|---|---|---|---|---|---|---|
| 1 | i2pn2.org | 16 | 0 | 0.0 KB | 0 | 0 | 0 | 00:00:07 |
| 2 | 163.172.106.112 | 2 | 0 | 0.0 KB | 0 | 0 | 0 | 00:00:00 |
| TOTAL: 2 | 18 | 0 | 0.0 KB | 0 | 0 | 0 | 00:00:08 | |
NNRP readership statistics (by domain):
| System | Conn | Arts | Size | Groups | Post | Rej | Elapsed | |
|---|---|---|---|---|---|---|---|---|
| 1 | *.org | 16 | 0 | 0.0 KB | 0 | 0 | 0 | 00:00:07 |
| 2 | unresolved | 2 | 0 | 0.0 KB | 0 | 0 | 0 | 00:00:00 |
| TOTAL: 2 | 18 | 0 | 0.0 KB | 0 | 0 | 0 | 00:00:08 | |
NNRP auth users [Top 20]:
| User | Conn |
|---|---|
| i2pn2user | 16 |
| TOTAL: 1 | 16 |
NNRP total resource statistics [Top 20]:
| System | User(ms) | System(ms) | Idle(ms) | Elapsed |
|---|---|---|---|---|
| i2pn2.org | 0.864 | 0.144 | 1.510 | 00:00:07 |
| 163.172.106.112 | 0.116 | 0.012 | 0.000 | 00:00:00 |
| TOTAL: 2 | 0.980 | 0.156 | 1.510 | 00:00:08 |
