Log entries by program:
| Program name | Lines | %Lines | Size | %Size |
|---|---|---|---|---|
| inn | 17516 | 90.2% | 1.4 MB | 85.4% |
| innd | 1082 | 5.6% | 159.2 KB | 9.4% |
| innfeed | 600 | 3.1% | 68.8 KB | 4.0% |
| nnrpd | 144 | 0.7% | 11.8 KB | 0.7% |
| nocem | 83 | 0.4% | 9.3 KB | 0.5% |
| controlchan | 1 | 0.0% | 0.1 KB | 0.0% |
| TOTAL: 6 | 19426 | 100.0% | 1.7 MB | 100.0% |
History cache:
| Reason | Count | %Count |
|---|---|---|
| Do not exist | 17133 | 98.8% |
| Negative hits | 132 | 0.8% |
| Positive hits | 60 | 0.3% |
| Cache misses | 22 | 0.1% |
| TOTAL: 4 | 17347 | 100.0% |
INND timer:
| Code region | Time | Pct | Invoked | Min(ms) | Avg(ms) | Max(ms) |
|---|---|---|---|---|---|---|
| article cancel | 00:00:00.058 | 0.0% | 132 | 0.000 | 0.439 | 1.500 |
| article cleanup | 00:00:00.089 | 0.0% | 17114 | 0.000 | 0.005 | 0.039 |
| article logging | 00:00:00.449 | 0.0% | 17386 | 0.000 | 0.026 | 0.096 |
| article parse | 00:00:00.272 | 0.0% | 19261 | 0.000 | 0.014 | 0.042 |
| article write | 00:00:09.981 | 0.0% | 17111 | 0.138 | 0.583 | 4.968 |
| artlog/artcncl | 00:00:00.003 | 0.0% | 127 | 0.000 | 0.024 | 0.500 |
| data move | 00:00:00.004 | 0.0% | 21538 | 0.000 | 0.000 | 0.006 |
| hisgrep/artcncl | 00:00:00.002 | 0.0% | 86 | 0.000 | 0.023 | 0.250 |
| hishave/artcncl | 00:00:00.008 | 0.0% | 132 | 0.000 | 0.061 | 0.500 |
| history grep | 00:00:00.000 | 0.0% | 0 | 0.000 | 0.000 | 0.000 |
| history lookup | 00:00:03.471 | 0.0% | 17266 | 0.000 | 0.201 | 0.878 |
| history sync | 00:00:00.011 | 0.0% | 308 | 0.000 | 0.036 | 0.500 |
| history write | 00:00:04.022 | 0.0% | 17114 | 0.000 | 0.235 | 1.168 |
| hiswrite/artcncl | 00:00:00.010 | 0.0% | 46 | 0.000 | 0.217 | 1.200 |
| idle | 23:59:32.874 | 99.9% | 19762 | 2606.130 | 4370.654 | 11537.192 |
| nntp read | 00:00:00.546 | 0.0% | 19497 | 0.000 | 0.028 | 0.076 |
| overview write | 00:00:03.783 | 0.0% | 17111 | 0.033 | 0.221 | 2.300 |
| perl filter | 00:00:24.494 | 0.0% | 17114 | 1.169 | 1.431 | 2.316 |
| python filter | 00:00:00.000 | 0.0% | 0 | 0.000 | 0.000 | 0.000 |
| site send | 00:00:01.238 | 0.0% | 17187 | 0.000 | 0.072 | 0.152 |
| TOTAL: 24:00:23.905 | 24:00:21.315 | 100.0% | - | - | - | - |
INNfeed timer:
| Code region | Time | Pct | Invoked | Min(ms) | Avg(ms) | Max(ms) |
|---|---|---|---|---|---|---|
| article new | 00:00:00.016 | 0.0% | 17096 | 0.000 | 0.001 | 0.019 |
| article prepare | 00:00:00.000 | 0.0% | 416 | 0.000 | 0.000 | 0.000 |
| article read | 00:00:00.034 | 0.0% | 104 | 0.000 | 0.327 | 14.500 |
| backlog stats | 00:00:00.015 | 0.0% | 55800 | 0.000 | 0.000 | 0.005 |
| callbacks | 00:00:00.000 | 0.0% | 0 | 0.000 | 0.000 | 0.000 |
| data read | 00:00:00.273 | 0.0% | 34280 | 0.000 | 0.008 | 0.040 |
| data write | 00:00:00.389 | 0.0% | 17204 | 0.000 | 0.023 | 0.075 |
| idle | 23:57:20.379 | 100.0% | 55800 | 918.758 | 1545.527 | 3984.444 |
| status file | 00:00:00.034 | 0.0% | 152 | 0.000 | 0.224 | 1.000 |
| TOTAL: 23:57:21.673 | 23:57:21.140 | 100.0% | - | - | - | - |
nnrpd timer:
| Code region | Time | Pct | Invoked | Min(ms) | Avg(ms) | Max(ms) |
|---|---|---|---|---|---|---|
| idle | 00:00:14.299 | 66.9% | 225 | 7.333 | 63.551 | 10050.000 |
| newnews | 00:00:00.000 | 0.0% | 0 | 0.000 | 0.000 | 0.000 |
| nntpwrite | 00:00:00.010 | 0.0% | 770 | 0.000 | 0.013 | 0.048 |
| TOTAL: 00:00:21.374 | 00:00:14.309 | 66.9% | - | - | - | - |
Control commands to INND:
| Command | Number |
|---|---|
| L | 1 |
| flush | 3 |
| flushlogs | 2 |
| go | 2 |
| logmode | 2 |
| mode | 149 |
| name | 2 |
| pause | 2 |
| paused | 2 |
| reload | 2 |
| reserve | 2 |
| TOTAL: 11 | 169 |
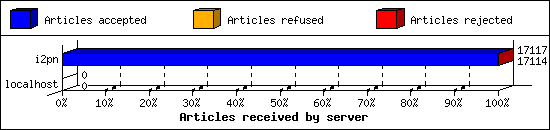
Incoming Feeds (INN):
| Server | Connects | Offered | Taken | Refused | Reject | %Accpt | Elapsed | |
|---|---|---|---|---|---|---|---|---|
| 1 | i2pn | 7 | 17117 | 17114 | 0 | 3 | 99% | 24:40:46 |
| 2 | localhost | 32 | 0 | 0 | 0 | 0 | 0% | 00:00:00 |
| TOTAL: 2 | 39 | 17117 | 17114 | 0 | 3 | 99% | 24:40:46 | |
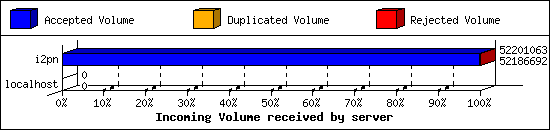
Incoming Volume (INN):
| Server | AcceptVol | DupVol | RejVol | TotalVol | %Acc | Vol/Art | |
|---|---|---|---|---|---|---|---|
| 1 | i2pn | 49.8 MB | 0.0 KB | 14.0 KB | 49.8 MB | 99% | 3.0 KB |
| 2 | localhost | 0.0 KB | 0.0 KB | 0.0 KB | 0.0 KB | 0% | 0 |
| TOTAL: 2 | 49.8 MB | 0.0 KB | 14.0 KB | 49.8 MB | 99% | 3.0 KB | |
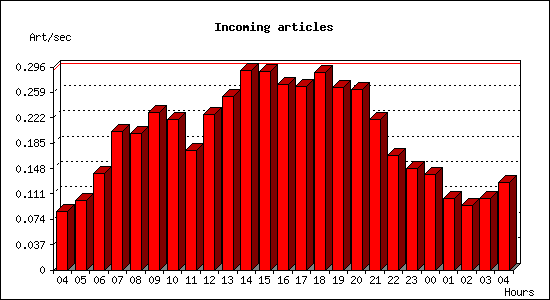
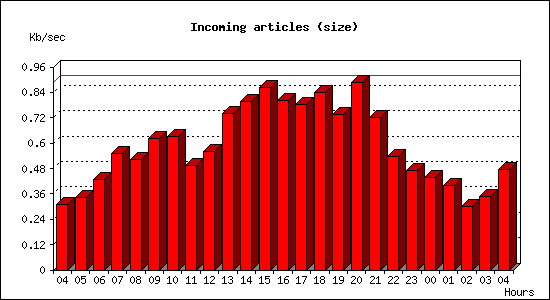
Incoming articles:
| Date | Articles | %Arts | Art/sec | Size | %Size | KB/sec |
|---|---|---|---|---|---|---|
| Jul 8 04:15:02 - 04:59:59 | 231 | 1.3% | 0.09 | 833.9 KB | 1.6% | 0.31 |
| Jul 8 05:00:00 - 05:59:59 | 366 | 2.1% | 0.10 | 1.2 MB | 2.4% | 0.34 |
| Jul 8 06:00:00 - 06:59:59 | 504 | 2.9% | 0.14 | 1.5 MB | 3.0% | 0.43 |
| Jul 8 07:00:00 - 07:59:59 | 725 | 4.2% | 0.20 | 1.9 MB | 3.9% | 0.55 |
| Jul 8 08:00:00 - 08:59:59 | 719 | 4.2% | 0.20 | 1.8 MB | 3.7% | 0.52 |
| Jul 8 09:00:00 - 09:59:59 | 825 | 4.8% | 0.23 | 2.2 MB | 4.4% | 0.62 |
| Jul 8 10:00:00 - 10:59:59 | 790 | 4.6% | 0.22 | 2.2 MB | 4.5% | 0.63 |
| Jul 8 11:00:00 - 11:59:59 | 625 | 3.7% | 0.17 | 1.7 MB | 3.5% | 0.49 |
| Jul 8 12:00:00 - 12:59:59 | 816 | 4.8% | 0.23 | 2.0 MB | 4.0% | 0.56 |
| Jul 8 13:00:00 - 13:59:59 | 910 | 5.3% | 0.25 | 2.6 MB | 5.2% | 0.74 |
| Jul 8 14:00:00 - 14:59:59 | 1047 | 6.1% | 0.29 | 2.8 MB | 5.6% | 0.80 |
| Jul 8 15:00:00 - 15:59:59 | 1041 | 6.1% | 0.29 | 3.0 MB | 6.1% | 0.87 |
| Jul 8 16:00:00 - 16:59:59 | 976 | 5.7% | 0.27 | 2.8 MB | 5.7% | 0.80 |
| Jul 8 17:00:00 - 17:59:59 | 961 | 5.6% | 0.27 | 2.8 MB | 5.5% | 0.78 |
| Jul 8 18:00:00 - 18:59:59 | 1039 | 6.1% | 0.29 | 3.0 MB | 5.9% | 0.84 |
| Jul 8 19:00:00 - 19:59:59 | 960 | 5.6% | 0.27 | 2.6 MB | 5.2% | 0.74 |
| Jul 8 20:00:00 - 20:59:59 | 950 | 5.6% | 0.26 | 3.1 MB | 6.3% | 0.89 |
| Jul 8 21:00:00 - 21:59:59 | 789 | 4.6% | 0.22 | 2.5 MB | 5.1% | 0.72 |
| Jul 8 22:00:00 - 22:59:59 | 600 | 3.5% | 0.17 | 1.9 MB | 3.8% | 0.54 |
| Jul 8 23:00:00 - 23:59:59 | 534 | 3.1% | 0.15 | 1.6 MB | 3.3% | 0.47 |
| Jul 9 00:00:00 - 00:59:59 | 499 | 2.9% | 0.14 | 1.5 MB | 3.1% | 0.44 |
| Jul 9 01:00:00 - 01:59:59 | 377 | 2.2% | 0.10 | 1.4 MB | 2.8% | 0.40 |
| Jul 9 02:00:00 - 02:59:59 | 341 | 2.0% | 0.09 | 1.0 MB | 2.1% | 0.30 |
| Jul 9 03:00:00 - 03:59:59 | 374 | 2.2% | 0.10 | 1.2 MB | 2.4% | 0.35 |
| Jul 9 04:00:00 - 04:15:01 | 115 | 0.7% | 0.13 | 430.0 KB | 0.8% | 0.48 |
| TOTAL: 23:59:59 | 17114 | 100.0% | 0.20 | 49.8 MB | 100.0% | 0.59 |
Sites sending bad articles:
| Server | Total | Group | Dist | Duplic | Unapp | TooOld | Site | Line | Other | |
|---|---|---|---|---|---|---|---|---|---|---|
| 1 | i2pn | 275 | 3 | 0 | 0 | 0 | 0 | 0 | 0 | 272 |
| TOTAL: 1 | 275 | 3 | 0 | 0 | 0 | 0 | 0 | 0 | 272 | |
Unwanted newsgroups [Top 20]:
| Newsgroup | Count |
|---|---|
| 24hoursupport.helpdesk | 2 |
| alt.pl.nieruchomosci.gielda | 1 |
| TOTAL: 2 | 3 |
NoCeM on Spool:
| Id | Good | Bad | Unique | Total |
|---|---|---|---|---|
| bleachbot@httrack.com | 55 | 0 | 56 | 56 |
| TOTAL: 1 | 55 | 21 | 56 | 56 |
Miscellaneous innd statistics [Top 10]:
| Event | Server | Number |
|---|---|---|
| Including strange strings | ||
| i2pn | 272 | |
| TOTAL: 1 | 272 | |
| TOTAL: 1 | 272 | |
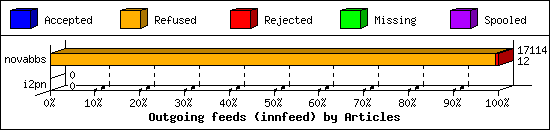
Outgoing Feeds (innfeed) by Articles:
| Server | Offered | Taken | Refused | Reject | Miss | Spool | %Took | Elapsed | |
|---|---|---|---|---|---|---|---|---|---|
| 1 | novabbs | 17129 | 12 | 17010 | 92 | 0 | 0 | 0% | 23:59:57 |
| 2 | i2pn | 0 | 0 | 0 | 0 | 0 | 0 | 0% | 00:10:00 |
| TOTAL: 2 | 17129 | 12 | 17010 | 92 | 0 | 0 | 0% | 24:09:57 | |
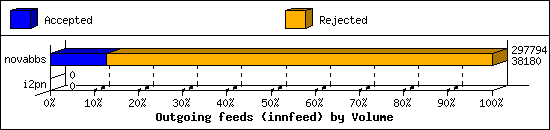
Outgoing Feeds (innfeed) by Volume:
| Server | AcceptVol | RejectVol | TotalVol | Volume/sec | Vol/Art | Elapsed | |
|---|---|---|---|---|---|---|---|
| 1 | novabbs | 37.3 KB | 253.5 KB | 290.8 KB | 0.0 KB/s | 2.8 KB | 23:59:57 |
| 2 | i2pn | 0.0 KB | 0.0 KB | 0.0 KB | 0.0 KB/s | 0 | 00:10:00 |
| TOTAL: 2 | 37.3 KB | 253.5 KB | 290.8 KB | 0.0 KB/s | 2.8 KB | 24:09:57 | |
NNRP readership statistics:
| System | Conn | Arts | Size | Groups | Post | Rej | Elapsed | |
|---|---|---|---|---|---|---|---|---|
| 1 | i2pn2.org | 17 | 0 | 0.0 KB | 0 | 0 | 0 | 00:00:08 |
| 2 | 78.128.113.18 | 1 | 0 | 0.0 KB | 0 | 0 | 0 | 00:00:00 |
| 3 | scan-141.security.ipip.net | 1 | 0 | 0.0 KB | 0 | 0 | 0 | 00:00:02 |
| 4 | 139.59.42.211 | 1 | 0 | 0.0 KB | 0 | 0 | 0 | 00:00:10 |
| TOTAL: 4 | 20 | 0 | 0.0 KB | 0 | 0 | 0 | 00:00:21 | |
NNRP readership statistics (by domain):
| System | Conn | Arts | Size | Groups | Post | Rej | Elapsed | |
|---|---|---|---|---|---|---|---|---|
| 1 | unresolved | 2 | 0 | 0.0 KB | 0 | 0 | 0 | 00:00:10 |
| 2 | *.security.ipip.net | 1 | 0 | 0.0 KB | 0 | 0 | 0 | 00:00:02 |
| 3 | *.org | 17 | 0 | 0.0 KB | 0 | 0 | 0 | 00:00:08 |
| TOTAL: 3 | 20 | 0 | 0.0 KB | 0 | 0 | 0 | 00:00:21 | |
NNRP auth users [Top 20]:
| User | Conn |
|---|---|
| i2pn2user | 17 |
| TOTAL: 1 | 17 |
NNRP total resource statistics [Top 20]:
| System | User(ms) | System(ms) | Idle(ms) | Elapsed |
|---|---|---|---|---|
| 139.59.42.211 | 0.048 | 0.000 | 0.000 | 00:00:10 |
| i2pn2.org | 1.084 | 0.124 | 1.620 | 00:00:08 |
| scan-141.security.ipip.net | 0.052 | 0.008 | 0.000 | 00:00:02 |
| 78.128.113.18 | 0.052 | 0.008 | 0.000 | 00:00:00 |
| TOTAL: 4 | 1.236 | 0.140 | 1.620 | 00:00:21 |
NNRP unrecognized commands (by host):
| System | Conn |
|---|---|
| scan-141.security.ipip.net | 4 |
| 78.128.113.18 | 1 |
| TOTAL: 2 | 5 |
NNRP unrecognized commands (by command):
| Command | Count |
|---|---|
| #003 | 1 |
| GET / HTTP/1.1 | 1 |
| Connection: close | 1 |
| User-Agent: HTTP Banner Detection (https... | 1 |
| Host: 157.230.63.40:119 | 1 |
| TOTAL: 5 | 5 |
NNRP client timeouts [Top 20]:
| System | Conn | Peer |
|---|---|---|
| 78.128.113.18 | 1 | 1 |
| TOTAL: 1 | 1 | 1 |
