Log entries by program:
| Program name | Lines | %Lines | Size | %Size |
|---|---|---|---|---|
| inn | 17596 | 90.5% | 1.4 MB | 85.8% |
| innd | 1076 | 5.5% | 158.6 KB | 9.3% |
| innfeed | 598 | 3.1% | 68.4 KB | 4.0% |
| nnrpd | 103 | 0.5% | 8.5 KB | 0.5% |
| nocem | 60 | 0.3% | 6.1 KB | 0.4% |
| controlchan | 1 | 0.0% | 0.1 KB | 0.0% |
| TOTAL: 6 | 19434 | 100.0% | 1.7 MB | 100.0% |
History cache:
| Reason | Count | %Count |
|---|---|---|
| Do not exist | 17020 | 98.1% |
| Negative hits | 288 | 1.7% |
| Positive hits | 32 | 0.2% |
| Cache misses | 13 | 0.1% |
| TOTAL: 4 | 17353 | 100.0% |
INND timer:
| Code region | Time | Pct | Invoked | Min(ms) | Avg(ms) | Max(ms) |
|---|---|---|---|---|---|---|
| article cancel | 00:00:00.082 | 0.0% | 77 | 0.000 | 1.065 | 7.375 |
| article cleanup | 00:00:00.096 | 0.0% | 17011 | 0.000 | 0.006 | 0.041 |
| article logging | 00:00:00.532 | 0.0% | 17523 | 0.000 | 0.030 | 0.070 |
| article parse | 00:00:00.276 | 0.0% | 19627 | 0.000 | 0.014 | 0.057 |
| article write | 00:00:06.367 | 0.0% | 17009 | 0.138 | 0.374 | 1.597 |
| artlog/artcncl | 00:00:00.002 | 0.0% | 77 | 0.000 | 0.026 | 1.000 |
| data move | 00:00:00.012 | 0.0% | 22347 | 0.000 | 0.001 | 0.016 |
| hisgrep/artcncl | 00:00:00.003 | 0.0% | 46 | 0.000 | 0.065 | 0.500 |
| hishave/artcncl | 00:00:00.002 | 0.0% | 77 | 0.000 | 0.026 | 1.000 |
| history grep | 00:00:00.000 | 0.0% | 0 | 0.000 | 0.000 | 0.000 |
| history lookup | 00:00:00.586 | 0.0% | 17311 | 0.000 | 0.034 | 0.180 |
| history sync | 00:00:00.018 | 0.0% | 306 | 0.000 | 0.059 | 0.500 |
| history write | 00:00:02.540 | 0.0% | 17011 | 0.000 | 0.149 | 1.271 |
| hiswrite/artcncl | 00:00:00.011 | 0.0% | 31 | 0.000 | 0.355 | 1.000 |
| idle | 23:59:41.489 | 100.0% | 20279 | 2297.621 | 4259.652 | 10345.948 |
| nntp read | 00:00:00.543 | 0.0% | 20013 | 0.000 | 0.027 | 0.067 |
| overview write | 00:00:03.025 | 0.0% | 17009 | 0.000 | 0.178 | 3.605 |
| perl filter | 00:00:24.888 | 0.0% | 17011 | 1.116 | 1.463 | 2.610 |
| python filter | 00:00:00.000 | 0.0% | 0 | 0.000 | 0.000 | 0.000 |
| site send | 00:00:01.183 | 0.0% | 17051 | 0.013 | 0.069 | 0.151 |
| TOTAL: 24:00:24.399 | 24:00:21.655 | 100.0% | - | - | - | - |
INNfeed timer:
| Code region | Time | Pct | Invoked | Min(ms) | Avg(ms) | Max(ms) |
|---|---|---|---|---|---|---|
| article new | 00:00:00.033 | 0.0% | 16979 | 0.000 | 0.002 | 0.024 |
| article prepare | 00:00:00.000 | 0.0% | 400 | 0.000 | 0.000 | 0.000 |
| article read | 00:00:00.029 | 0.0% | 100 | 0.000 | 0.290 | 11.500 |
| backlog stats | 00:00:00.011 | 0.0% | 55462 | 0.000 | 0.000 | 0.004 |
| callbacks | 00:00:00.000 | 0.0% | 0 | 0.000 | 0.000 | 0.000 |
| data read | 00:00:00.275 | 0.0% | 34048 | 0.000 | 0.008 | 0.037 |
| data write | 00:00:00.396 | 0.0% | 17092 | 0.000 | 0.023 | 0.059 |
| idle | 23:57:49.443 | 100.0% | 55462 | 894.195 | 1555.469 | 3824.382 |
| status file | 00:00:00.041 | 0.0% | 152 | 0.000 | 0.270 | 2.000 |
| TOTAL: 23:57:50.718 | 23:57:50.228 | 100.0% | - | - | - | - |
nnrpd timer:
| Code region | Time | Pct | Invoked | Min(ms) | Avg(ms) | Max(ms) |
|---|---|---|---|---|---|---|
| idle | 00:00:00.960 | 14.6% | 121 | 7.167 | 7.934 | 13.857 |
| newnews | 00:00:00.000 | 0.0% | 0 | 0.000 | 0.000 | 0.000 |
| nntpwrite | 00:00:00.007 | 0.1% | 425 | 0.000 | 0.016 | 0.095 |
| TOTAL: 00:00:06.575 | 00:00:00.967 | 14.7% | - | - | - | - |
Control commands to INND:
| Command | Number |
|---|---|
| L | 1 |
| flush | 3 |
| flushlogs | 2 |
| go | 2 |
| logmode | 2 |
| mode | 149 |
| name | 2 |
| pause | 2 |
| paused | 2 |
| reload | 2 |
| reserve | 2 |
| TOTAL: 11 | 169 |
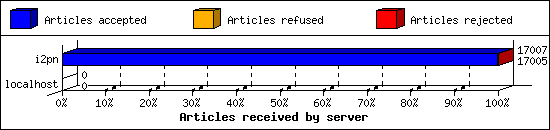
Incoming Feeds (INN):
| Server | Connects | Offered | Taken | Refused | Reject | %Accpt | Elapsed | |
|---|---|---|---|---|---|---|---|---|
| 1 | i2pn | 8 | 17007 | 17005 | 0 | 2 | 99% | 24:46:12 |
| 2 | localhost | 32 | 0 | 0 | 0 | 0 | 0% | 00:00:00 |
| TOTAL: 2 | 40 | 17007 | 17005 | 0 | 2 | 99% | 24:46:12 | |
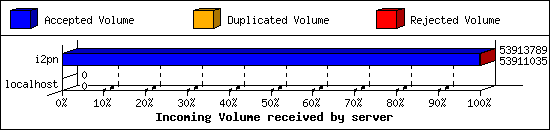
Incoming Volume (INN):
| Server | AcceptVol | DupVol | RejVol | TotalVol | %Acc | Vol/Art | |
|---|---|---|---|---|---|---|---|
| 1 | i2pn | 51.4 MB | 0.0 KB | 2.7 KB | 51.4 MB | 99% | 3.1 KB |
| 2 | localhost | 0.0 KB | 0.0 KB | 0.0 KB | 0.0 KB | 0% | 0 |
| TOTAL: 2 | 51.4 MB | 0.0 KB | 2.7 KB | 51.4 MB | 99% | 3.1 KB | |
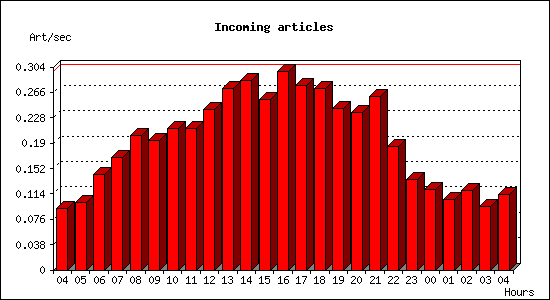
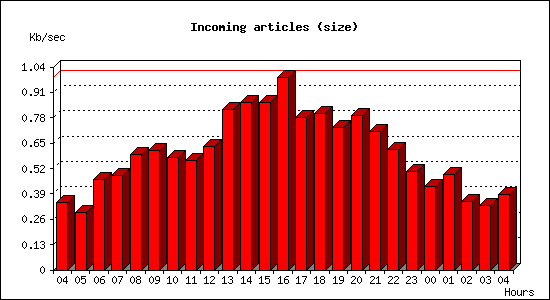
Incoming articles:
| Date | Articles | %Arts | Art/sec | Size | %Size | KB/sec |
|---|---|---|---|---|---|---|
| Jul 9 04:15:01 - 04:59:59 | 248 | 1.5% | 0.09 | 934.9 KB | 1.8% | 0.35 |
| Jul 9 05:00:00 - 05:59:59 | 365 | 2.1% | 0.10 | 1.0 MB | 2.0% | 0.29 |
| Jul 9 06:00:00 - 06:59:59 | 516 | 3.0% | 0.14 | 1.6 MB | 3.2% | 0.46 |
| Jul 9 07:00:00 - 07:59:59 | 607 | 3.6% | 0.17 | 1.7 MB | 3.3% | 0.48 |
| Jul 9 08:00:00 - 08:59:59 | 723 | 4.3% | 0.20 | 2.1 MB | 4.0% | 0.59 |
| Jul 9 09:00:00 - 09:59:59 | 699 | 4.1% | 0.19 | 2.2 MB | 4.2% | 0.61 |
| Jul 9 10:00:00 - 10:59:59 | 763 | 4.5% | 0.21 | 2.0 MB | 3.9% | 0.58 |
| Jul 9 11:00:00 - 11:59:59 | 762 | 4.5% | 0.21 | 2.0 MB | 3.8% | 0.56 |
| Jul 9 12:00:00 - 12:59:59 | 866 | 5.1% | 0.24 | 2.2 MB | 4.3% | 0.63 |
| Jul 9 13:00:00 - 13:59:59 | 976 | 5.7% | 0.27 | 2.9 MB | 5.6% | 0.82 |
| Jul 9 14:00:00 - 14:59:59 | 1019 | 6.0% | 0.28 | 3.0 MB | 5.9% | 0.86 |
| Jul 9 15:00:00 - 15:59:59 | 919 | 5.4% | 0.26 | 3.0 MB | 5.9% | 0.86 |
| Jul 9 16:00:00 - 16:59:59 | 1072 | 6.3% | 0.30 | 3.5 MB | 6.7% | 0.99 |
| Jul 9 17:00:00 - 17:59:59 | 992 | 5.8% | 0.28 | 2.7 MB | 5.3% | 0.78 |
| Jul 9 18:00:00 - 18:59:59 | 981 | 5.8% | 0.27 | 2.8 MB | 5.5% | 0.80 |
| Jul 9 19:00:00 - 19:59:59 | 872 | 5.1% | 0.24 | 2.6 MB | 5.0% | 0.73 |
| Jul 9 20:00:00 - 20:59:59 | 849 | 5.0% | 0.24 | 2.8 MB | 5.4% | 0.79 |
| Jul 9 21:00:00 - 21:59:59 | 937 | 5.5% | 0.26 | 2.5 MB | 4.8% | 0.71 |
| Jul 9 22:00:00 - 22:59:59 | 665 | 3.9% | 0.18 | 2.2 MB | 4.2% | 0.62 |
| Jul 9 23:00:00 - 23:59:59 | 489 | 2.9% | 0.14 | 1.8 MB | 3.4% | 0.50 |
| Jul 10 00:00:00 - 00:59:59 | 434 | 2.6% | 0.12 | 1.5 MB | 2.9% | 0.43 |
| Jul 10 01:00:00 - 01:59:59 | 378 | 2.2% | 0.10 | 1.7 MB | 3.4% | 0.49 |
| Jul 10 02:00:00 - 02:59:59 | 426 | 2.5% | 0.12 | 1.2 MB | 2.4% | 0.35 |
| Jul 10 03:00:00 - 03:59:59 | 345 | 2.0% | 0.10 | 1.2 MB | 2.2% | 0.33 |
| Jul 10 04:00:00 - 04:15:01 | 102 | 0.6% | 0.11 | 347.3 KB | 0.7% | 0.39 |
| TOTAL: 24:00:00 | 17005 | 100.0% | 0.20 | 51.4 MB | 100.0% | 0.61 |
Sites sending bad articles:
| Server | Total | Group | Dist | Duplic | Unapp | TooOld | Site | Line | Other | |
|---|---|---|---|---|---|---|---|---|---|---|
| 1 | i2pn | 514 | 2 | 0 | 0 | 0 | 0 | 0 | 0 | 512 |
| TOTAL: 1 | 514 | 2 | 0 | 0 | 0 | 0 | 0 | 0 | 512 | |
Unwanted newsgroups [Top 20]:
| Newsgroup | Count |
|---|---|
| 24hoursupport.helpdesk | 1 |
| biz.mlm | 1 |
| TOTAL: 2 | 2 |
NoCeM on Spool:
| Id | Good | Bad | Unique | Total |
|---|---|---|---|---|
| bleachbot@httrack.com | 39 | 0 | 39 | 39 |
| TOTAL: 1 | 39 | 14 | 39 | 39 |
Miscellaneous innd statistics [Top 10]:
| Event | Server | Number |
|---|---|---|
| Including strange strings | ||
| i2pn | 512 | |
| TOTAL: 1 | 512 | |
| TOTAL: 1 | 512 | |
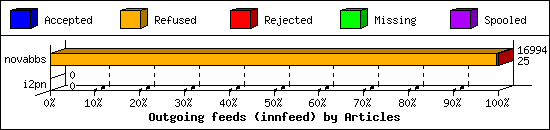
Outgoing Feeds (innfeed) by Articles:
| Server | Offered | Taken | Refused | Reject | Miss | Spool | %Took | Elapsed | |
|---|---|---|---|---|---|---|---|---|---|
| 1 | novabbs | 17013 | 25 | 16894 | 75 | 0 | 0 | 0% | 23:59:58 |
| 2 | i2pn | 0 | 0 | 0 | 0 | 0 | 0 | 0% | 00:10:00 |
| TOTAL: 2 | 17013 | 25 | 16894 | 75 | 0 | 0 | 0% | 24:09:58 | |
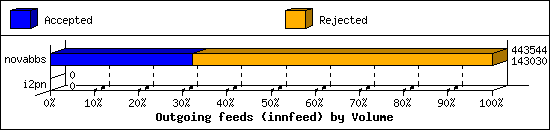
Outgoing Feeds (innfeed) by Volume:
| Server | AcceptVol | RejectVol | TotalVol | Volume/sec | Vol/Art | Elapsed | |
|---|---|---|---|---|---|---|---|
| 1 | novabbs | 139.7 KB | 293.5 KB | 433.1 KB | 0.0 KB/s | 4.3 KB | 23:59:58 |
| 2 | i2pn | 0.0 KB | 0.0 KB | 0.0 KB | 0.0 KB/s | 0 | 00:10:00 |
| TOTAL: 2 | 139.7 KB | 293.5 KB | 433.1 KB | 0.0 KB/s | 4.3 KB | 24:09:58 | |
NNRP readership statistics:
| System | Conn | Arts | Size | Groups | Post | Rej | Elapsed | |
|---|---|---|---|---|---|---|---|---|
| 1 | i2pn2.org | 20 | 0 | 0.0 KB | 0 | 0 | 0 | 00:00:06 |
| TOTAL: 1 | 20 | 0 | 0.0 KB | 0 | 0 | 0 | 00:00:06 | |
NNRP readership statistics (by domain):
| System | Conn | Arts | Size | Groups | Post | Rej | Elapsed | |
|---|---|---|---|---|---|---|---|---|
| 1 | *.org | 20 | 0 | 0.0 KB | 0 | 0 | 0 | 00:00:06 |
| TOTAL: 1 | 20 | 0 | 0.0 KB | 0 | 0 | 0 | 00:00:06 | |
NNRP auth users [Top 20]:
| User | Conn |
|---|---|
| i2pn2user | 20 |
| TOTAL: 1 | 20 |
NNRP total resource statistics [Top 20]:
| System | User(ms) | System(ms) | Idle(ms) | Elapsed |
|---|---|---|---|---|
| i2pn2.org | 1.016 | 0.156 | 1.927 | 00:00:06 |
| ? | 0.064 | 0.000 | 0.000 | 00:00:00 |
| TOTAL: 2 | 1.080 | 0.156 | 1.927 | 00:00:06 |
