Log entries by program:
| Program name | Lines | %Lines | Size | %Size |
|---|---|---|---|---|
| inn | 16987 | 89.9% | 1.4 MB | 85.0% |
| innd | 1067 | 5.6% | 162.9 KB | 9.9% |
| innfeed | 607 | 3.2% | 57.6 KB | 3.5% |
| nnrpd | 155 | 0.8% | 14.6 KB | 0.9% |
| nocem | 83 | 0.4% | 11.9 KB | 0.7% |
| controlchan | 1 | 0.0% | 0.1 KB | 0.0% |
| TOTAL: 6 | 18900 | 100.0% | 1.6 MB | 100.0% |
History cache:
| Reason | Count | %Count |
|---|---|---|
| Do not exist | 16533 | 98.8% |
| Negative hits | 140 | 0.8% |
| Positive hits | 47 | 0.3% |
| Cache misses | 21 | 0.1% |
| TOTAL: 4 | 16741 | 100.0% |
INND timer:
| Code region | Time | Pct | Invoked | Min(ms) | Avg(ms) | Max(ms) |
|---|---|---|---|---|---|---|
| article cancel | 00:00:00.070 | 0.0% | 112 | 0.000 | 0.625 | 4.000 |
| article cleanup | 00:00:00.103 | 0.0% | 16507 | 0.000 | 0.006 | 0.035 |
| article logging | 00:00:00.475 | 0.0% | 16882 | 0.000 | 0.028 | 0.079 |
| article parse | 00:00:00.239 | 0.0% | 18873 | 0.000 | 0.013 | 0.053 |
| article write | 00:00:06.653 | 0.0% | 16505 | 0.100 | 0.403 | 1.794 |
| artlog/artcncl | 00:00:00.004 | 0.0% | 111 | 0.000 | 0.036 | 0.250 |
| data move | 00:00:00.028 | 0.0% | 21201 | 0.000 | 0.001 | 0.021 |
| hisgrep/artcncl | 00:00:00.008 | 0.0% | 69 | 0.000 | 0.116 | 2.000 |
| hishave/artcncl | 00:00:00.011 | 0.0% | 112 | 0.000 | 0.098 | 0.429 |
| history grep | 00:00:00.000 | 0.0% | 0 | 0.000 | 0.000 | 0.000 |
| history lookup | 00:00:02.592 | 0.0% | 16657 | 0.000 | 0.156 | 0.675 |
| history sync | 00:00:00.014 | 0.0% | 309 | 0.000 | 0.045 | 0.500 |
| history write | 00:00:03.006 | 0.0% | 16507 | 0.008 | 0.182 | 0.523 |
| hiswrite/artcncl | 00:00:00.012 | 0.0% | 43 | 0.000 | 0.279 | 1.000 |
| idle | 23:59:39.896 | 99.9% | 19399 | 2360.720 | 4452.801 | 15791.711 |
| nntp read | 00:00:00.515 | 0.0% | 19111 | 0.000 | 0.027 | 0.087 |
| overview write | 00:00:03.529 | 0.0% | 16505 | 0.035 | 0.214 | 2.016 |
| perl filter | 00:00:23.805 | 0.0% | 16507 | 1.159 | 1.442 | 2.500 |
| python filter | 00:00:00.000 | 0.0% | 0 | 0.000 | 0.000 | 0.000 |
| site send | 00:00:00.851 | 0.0% | 16580 | 0.000 | 0.051 | 0.123 |
| TOTAL: 24:00:24.372 | 24:00:21.811 | 100.0% | - | - | - | - |
INNfeed timer:
| Code region | Time | Pct | Invoked | Min(ms) | Avg(ms) | Max(ms) |
|---|---|---|---|---|---|---|
| article new | 00:00:00.030 | 0.0% | 16498 | 0.000 | 0.002 | 0.020 |
| article prepare | 00:00:00.000 | 0.0% | 492 | 0.000 | 0.000 | 0.000 |
| article read | 00:00:00.031 | 0.0% | 123 | 0.000 | 0.252 | 24.000 |
| backlog stats | 00:00:00.019 | 0.0% | 54147 | 0.000 | 0.000 | 0.005 |
| callbacks | 00:00:00.000 | 0.0% | 0 | 0.000 | 0.000 | 0.000 |
| data read | 00:00:00.278 | 0.0% | 33143 | 0.000 | 0.008 | 0.031 |
| data write | 00:00:00.317 | 0.0% | 16664 | 0.000 | 0.019 | 0.111 |
| idle | 23:59:21.884 | 100.0% | 54147 | 898.482 | 1594.952 | 4861.984 |
| status file | 00:00:00.048 | 0.0% | 156 | 0.000 | 0.308 | 2.000 |
| TOTAL: 23:59:23.108 | 23:59:22.607 | 100.0% | - | - | - | - |
nnrpd timer:
| Code region | Time | Pct | Invoked | Min(ms) | Avg(ms) | Max(ms) |
|---|---|---|---|---|---|---|
| idle | 00:00:11.160 | 57.1% | 182 | 7.167 | 61.319 | 9751.000 |
| newnews | 00:00:00.000 | 0.0% | 0 | 0.000 | 0.000 | 0.000 |
| nntpwrite | 00:00:00.006 | 0.0% | 636 | 0.000 | 0.009 | 0.048 |
| TOTAL: 00:00:19.548 | 00:00:11.166 | 57.1% | - | - | - | - |
Control commands to INND:
| Command | Number |
|---|---|
| L | 1 |
| flush | 3 |
| flushlogs | 2 |
| go | 2 |
| logmode | 2 |
| mode | 149 |
| name | 2 |
| pause | 2 |
| paused | 2 |
| reload | 2 |
| reserve | 2 |
| TOTAL: 11 | 169 |
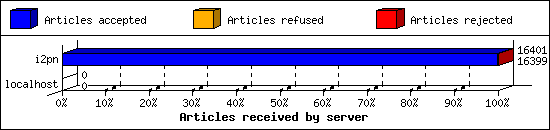
Incoming Feeds (INN):
| Server | Connects | Offered | Taken | Refused | Reject | %Accpt | Elapsed | |
|---|---|---|---|---|---|---|---|---|
| 1 | i2pn | 6 | 16401 | 16399 | 0 | 2 | 99% | 24:18:14 |
| 2 | localhost | 32 | 0 | 0 | 0 | 0 | 0% | 00:00:00 |
| TOTAL: 2 | 38 | 16401 | 16399 | 0 | 2 | 99% | 24:18:14 | |
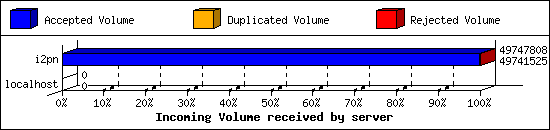
Incoming Volume (INN):
| Server | AcceptVol | DupVol | RejVol | TotalVol | %Acc | Vol/Art | |
|---|---|---|---|---|---|---|---|
| 1 | i2pn | 47.4 MB | 0.0 KB | 6.1 KB | 47.4 MB | 99% | 3.0 KB |
| 2 | localhost | 0.0 KB | 0.0 KB | 0.0 KB | 0.0 KB | 0% | 0 |
| TOTAL: 2 | 47.4 MB | 0.0 KB | 6.1 KB | 47.4 MB | 99% | 3.0 KB | |
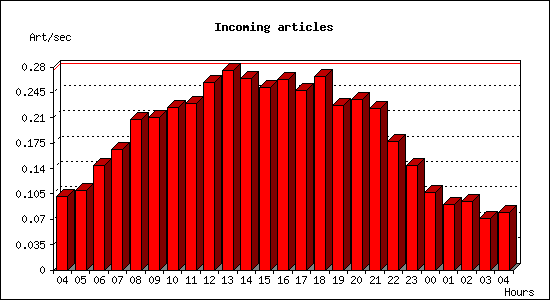
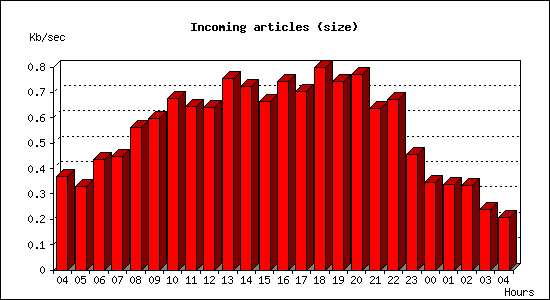
Incoming articles:
| Date | Articles | %Arts | Art/sec | Size | %Size | KB/sec |
|---|---|---|---|---|---|---|
| Jul 10 04:15:01 - 04:59:59 | 272 | 1.6% | 0.10 | 998.7 KB | 2.0% | 0.37 |
| Jul 10 05:00:00 - 05:59:59 | 395 | 2.4% | 0.11 | 1.2 MB | 2.4% | 0.33 |
| Jul 10 06:00:00 - 06:59:59 | 517 | 3.1% | 0.14 | 1.5 MB | 3.2% | 0.43 |
| Jul 10 07:00:00 - 07:59:59 | 600 | 3.6% | 0.17 | 1.6 MB | 3.3% | 0.45 |
| Jul 10 08:00:00 - 08:59:59 | 748 | 4.5% | 0.21 | 2.0 MB | 4.1% | 0.56 |
| Jul 10 09:00:00 - 09:59:59 | 757 | 4.6% | 0.21 | 2.1 MB | 4.4% | 0.60 |
| Jul 10 10:00:00 - 10:59:59 | 808 | 4.9% | 0.22 | 2.4 MB | 5.0% | 0.67 |
| Jul 10 11:00:00 - 11:59:59 | 827 | 5.0% | 0.23 | 2.3 MB | 4.7% | 0.64 |
| Jul 10 12:00:00 - 12:59:59 | 930 | 5.6% | 0.26 | 2.3 MB | 4.7% | 0.64 |
| Jul 10 13:00:00 - 13:59:59 | 990 | 6.0% | 0.28 | 2.7 MB | 5.6% | 0.75 |
| Jul 10 14:00:00 - 14:59:59 | 953 | 5.8% | 0.26 | 2.5 MB | 5.3% | 0.72 |
| Jul 10 15:00:00 - 15:59:59 | 907 | 5.5% | 0.25 | 2.3 MB | 4.9% | 0.66 |
| Jul 10 16:00:00 - 16:59:59 | 948 | 5.7% | 0.26 | 2.6 MB | 5.5% | 0.74 |
| Jul 10 17:00:00 - 17:59:59 | 890 | 5.4% | 0.25 | 2.5 MB | 5.2% | 0.70 |
| Jul 10 18:00:00 - 18:59:59 | 960 | 5.8% | 0.27 | 2.8 MB | 5.9% | 0.80 |
| Jul 10 19:00:00 - 19:59:59 | 818 | 5.0% | 0.23 | 2.6 MB | 5.5% | 0.74 |
| Jul 10 20:00:00 - 20:59:59 | 847 | 5.1% | 0.24 | 2.7 MB | 5.7% | 0.77 |
| Jul 10 21:00:00 - 21:59:59 | 804 | 4.9% | 0.22 | 2.2 MB | 4.7% | 0.64 |
| Jul 10 22:00:00 - 22:59:59 | 636 | 3.9% | 0.18 | 2.4 MB | 4.9% | 0.67 |
| Jul 10 23:00:00 - 23:59:59 | 518 | 3.1% | 0.14 | 1.6 MB | 3.4% | 0.45 |
| Jul 11 00:00:00 - 00:59:59 | 384 | 2.3% | 0.11 | 1.2 MB | 2.5% | 0.35 |
| Jul 11 01:00:00 - 01:59:59 | 326 | 2.0% | 0.09 | 1.2 MB | 2.5% | 0.34 |
| Jul 11 02:00:00 - 02:59:59 | 340 | 2.1% | 0.09 | 1.2 MB | 2.5% | 0.33 |
| Jul 11 03:00:00 - 03:59:59 | 254 | 1.5% | 0.07 | 852.4 KB | 1.7% | 0.24 |
| Jul 11 04:00:00 - 04:15:01 | 71 | 0.4% | 0.08 | 186.1 KB | 0.4% | 0.21 |
| TOTAL: 24:00:00 | 16500 | 100.0% | 0.19 | 47.7 MB | 100.0% | 0.57 |
Sites sending bad articles:
| Server | Total | Group | Dist | Duplic | Unapp | TooOld | Site | Line | Other | |
|---|---|---|---|---|---|---|---|---|---|---|
| 1 | i2pn | 377 | 2 | 0 | 0 | 0 | 0 | 0 | 0 | 375 |
| TOTAL: 1 | 377 | 2 | 0 | 0 | 0 | 0 | 0 | 0 | 375 | |
Unwanted newsgroups [Top 20]:
| Newsgroup | Count |
|---|---|
| alt.sex.girl | 1 |
| hk.politics | 1 |
| TOTAL: 2 | 2 |
NoCeM on Spool:
| Id | Good | Bad | Unique | Total |
|---|---|---|---|---|
| bleachbot@httrack.com | 45 | 0 | 49 | 49 |
| TOTAL: 1 | 45 | 31 | 49 | 49 |
Miscellaneous innd statistics [Top 10]:
| Event | Server | Number |
|---|---|---|
| Including strange strings | ||
| i2pn | 375 | |
| TOTAL: 1 | 375 | |
| TOTAL: 1 | 375 | |
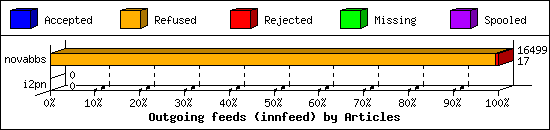
Outgoing Feeds (innfeed) by Articles:
| Server | Offered | Taken | Refused | Reject | Miss | Spool | %Took | Elapsed | |
|---|---|---|---|---|---|---|---|---|---|
| 1 | novabbs | 16539 | 17 | 16376 | 106 | 0 | 0 | 0% | 23:59:09 |
| 2 | i2pn | 0 | 0 | 0 | 0 | 0 | 0 | 0% | 00:10:00 |
| TOTAL: 2 | 16539 | 17 | 16376 | 106 | 0 | 0 | 0% | 24:09:09 | |
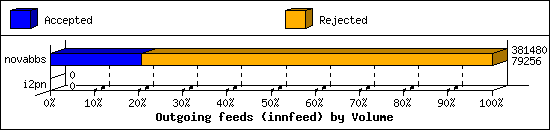
Outgoing Feeds (innfeed) by Volume:
| Server | AcceptVol | RejectVol | TotalVol | Volume/sec | Vol/Art | Elapsed | |
|---|---|---|---|---|---|---|---|
| 1 | novabbs | 77.4 KB | 295.1 KB | 372.5 KB | 0.0 KB/s | 3.0 KB | 23:59:09 |
| 2 | i2pn | 0.0 KB | 0.0 KB | 0.0 KB | 0.0 KB/s | 0 | 00:10:00 |
| TOTAL: 2 | 77.4 KB | 295.1 KB | 372.5 KB | 0.0 KB/s | 3.0 KB | 24:09:09 | |
NNRP readership statistics:
| System | Conn | Arts | Size | Groups | Post | Rej | Elapsed | |
|---|---|---|---|---|---|---|---|---|
| 1 | i2pn2.org | 30 | 0 | 0.0 KB | 0 | 0 | 0 | 00:00:09 |
| 2 | 162.243.149.170 | 1 | 0 | 0.0 KB | 0 | 0 | 0 | 00:00:09 |
| TOTAL: 2 | 31 | 0 | 0.0 KB | 0 | 0 | 0 | 00:00:19 | |
NNRP readership statistics (by domain):
| System | Conn | Arts | Size | Groups | Post | Rej | Elapsed | |
|---|---|---|---|---|---|---|---|---|
| 1 | unresolved | 1 | 0 | 0.0 KB | 0 | 0 | 0 | 00:00:09 |
| 2 | *.org | 30 | 0 | 0.0 KB | 0 | 0 | 0 | 00:00:09 |
| TOTAL: 2 | 31 | 0 | 0.0 KB | 0 | 0 | 0 | 00:00:19 | |
NNRP auth users [Top 20]:
| User | Conn |
|---|---|
| i2pn2user | 30 |
| TOTAL: 1 | 30 |
NNRP total resource statistics [Top 20]:
| System | User(ms) | System(ms) | Idle(ms) | Elapsed |
|---|---|---|---|---|
| 162.243.149.170 | 0.032 | 0.012 | 0.000 | 00:00:09 |
| i2pn2.org | 1.500 | 0.144 | 2.914 | 00:00:09 |
| TOTAL: 2 | 1.532 | 0.156 | 2.914 | 00:00:19 |
