Log entries by program:
| Program name | Lines | %Lines | Size | %Size |
|---|---|---|---|---|
| inn | 16936 | 89.5% | 1.4 MB | 84.7% |
| innd | 1098 | 5.8% | 169.1 KB | 10.1% |
| innfeed | 600 | 3.2% | 55.8 KB | 3.3% |
| nnrpd | 220 | 1.2% | 21.1 KB | 1.3% |
| nocem | 66 | 0.3% | 8.7 KB | 0.5% |
| controlchan | 1 | 0.0% | 0.1 KB | 0.0% |
| TOTAL: 6 | 18921 | 100.0% | 1.6 MB | 100.0% |
History cache:
| Reason | Count | %Count |
|---|---|---|
| Do not exist | 16379 | 98.6% |
| Negative hits | 140 | 0.8% |
| Positive hits | 64 | 0.4% |
| Cache misses | 26 | 0.2% |
| TOTAL: 4 | 16609 | 100.0% |
INND timer:
| Code region | Time | Pct | Invoked | Min(ms) | Avg(ms) | Max(ms) |
|---|---|---|---|---|---|---|
| article cancel | 00:00:00.055 | 0.0% | 111 | 0.000 | 0.495 | 3.000 |
| article cleanup | 00:00:00.102 | 0.0% | 16376 | 0.000 | 0.006 | 0.029 |
| article logging | 00:00:00.494 | 0.0% | 16826 | 0.000 | 0.029 | 0.100 |
| article parse | 00:00:00.260 | 0.0% | 18525 | 0.000 | 0.014 | 0.074 |
| article write | 00:00:08.664 | 0.0% | 16372 | 0.170 | 0.529 | 4.085 |
| artlog/artcncl | 00:00:00.003 | 0.0% | 111 | 0.000 | 0.027 | 0.500 |
| data move | 00:00:00.019 | 0.0% | 20556 | 0.000 | 0.001 | 0.011 |
| hisgrep/artcncl | 00:00:00.004 | 0.0% | 93 | 0.000 | 0.043 | 1.000 |
| hishave/artcncl | 00:00:00.004 | 0.0% | 111 | 0.000 | 0.036 | 0.200 |
| history grep | 00:00:00.000 | 0.0% | 0 | 0.000 | 0.000 | 0.000 |
| history lookup | 00:00:03.785 | 0.0% | 16527 | 0.000 | 0.229 | 1.397 |
| history sync | 00:00:00.017 | 0.0% | 302 | 0.000 | 0.056 | 0.500 |
| history write | 00:00:04.200 | 0.0% | 16376 | 0.015 | 0.256 | 0.866 |
| hiswrite/artcncl | 00:00:00.004 | 0.0% | 18 | 0.000 | 0.222 | 0.500 |
| idle | 23:59:36.604 | 99.9% | 19056 | 2245.296 | 4532.777 | 13955.140 |
| nntp read | 00:00:00.493 | 0.0% | 18761 | 0.000 | 0.026 | 0.064 |
| overview write | 00:00:03.149 | 0.0% | 16372 | 0.022 | 0.192 | 1.796 |
| perl filter | 00:00:23.389 | 0.0% | 16376 | 1.181 | 1.428 | 2.229 |
| python filter | 00:00:00.000 | 0.0% | 0 | 0.000 | 0.000 | 0.000 |
| site send | 00:00:00.767 | 0.0% | 16426 | 0.000 | 0.047 | 0.149 |
| TOTAL: 24:00:24.680 | 24:00:22.013 | 100.0% | - | - | - | - |
INNfeed timer:
| Code region | Time | Pct | Invoked | Min(ms) | Avg(ms) | Max(ms) |
|---|---|---|---|---|---|---|
| article new | 00:00:00.024 | 0.0% | 16359 | 0.000 | 0.001 | 0.017 |
| article prepare | 00:00:00.001 | 0.0% | 512 | 0.000 | 0.002 | 0.250 |
| article read | 00:00:00.045 | 0.0% | 128 | 0.000 | 0.352 | 32.000 |
| backlog stats | 00:00:00.012 | 0.0% | 53721 | 0.000 | 0.000 | 0.005 |
| callbacks | 00:00:00.000 | 0.0% | 0 | 0.000 | 0.000 | 0.000 |
| data read | 00:00:00.259 | 0.0% | 32856 | 0.000 | 0.008 | 0.034 |
| data write | 00:00:00.364 | 0.0% | 16524 | 0.000 | 0.022 | 0.063 |
| idle | 23:58:34.059 | 100.0% | 53721 | 1022.966 | 1606.710 | 3758.205 |
| status file | 00:00:00.032 | 0.0% | 152 | 0.000 | 0.211 | 1.000 |
| TOTAL: 23:58:35.303 | 23:58:34.796 | 100.0% | - | - | - | - |
nnrpd timer:
| Code region | Time | Pct | Invoked | Min(ms) | Avg(ms) | Max(ms) |
|---|---|---|---|---|---|---|
| idle | 00:00:44.791 | 83.0% | 266 | 7.167 | 168.387 | 19862.000 |
| newnews | 00:00:00.000 | 0.0% | 0 | 0.000 | 0.000 | 0.000 |
| nntpwrite | 00:00:00.011 | 0.0% | 935 | 0.000 | 0.012 | 0.048 |
| TOTAL: 00:00:53.950 | 00:00:44.802 | 83.0% | - | - | - | - |
Control commands to INND:
| Command | Number |
|---|---|
| L | 1 |
| flush | 3 |
| flushlogs | 2 |
| go | 2 |
| logmode | 2 |
| mode | 149 |
| name | 2 |
| pause | 2 |
| paused | 2 |
| reload | 2 |
| reserve | 2 |
| TOTAL: 11 | 169 |
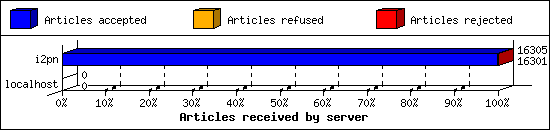
Incoming Feeds (INN):
| Server | Connects | Offered | Taken | Refused | Reject | %Accpt | Elapsed | |
|---|---|---|---|---|---|---|---|---|
| 1 | i2pn | 6 | 16305 | 16301 | 0 | 4 | 99% | 24:31:27 |
| 2 | localhost | 33 | 0 | 0 | 0 | 0 | 0% | 00:00:00 |
| TOTAL: 2 | 39 | 16305 | 16301 | 0 | 4 | 99% | 24:31:27 | |
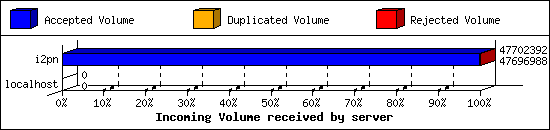
Incoming Volume (INN):
| Server | AcceptVol | DupVol | RejVol | TotalVol | %Acc | Vol/Art | |
|---|---|---|---|---|---|---|---|
| 1 | i2pn | 45.5 MB | 0.0 KB | 5.3 KB | 45.5 MB | 99% | 2.9 KB |
| 2 | localhost | 0.0 KB | 0.0 KB | 0.0 KB | 0.0 KB | 0% | 0 |
| TOTAL: 2 | 45.5 MB | 0.0 KB | 5.3 KB | 45.5 MB | 99% | 2.9 KB | |
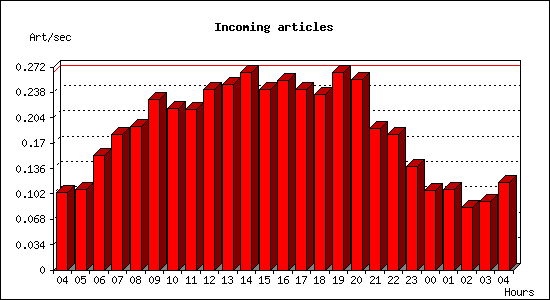
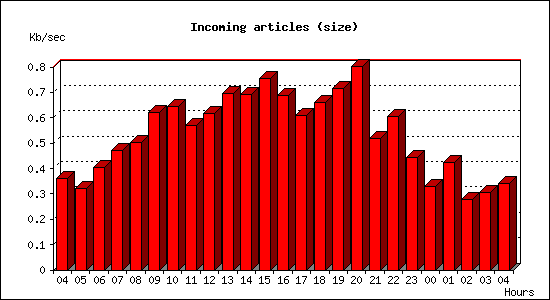
Incoming articles:
| Date | Articles | %Arts | Art/sec | Size | %Size | KB/sec |
|---|---|---|---|---|---|---|
| Jul 11 04:15:01 - 04:59:59 | 280 | 1.7% | 0.10 | 972.6 KB | 2.1% | 0.36 |
| Jul 11 05:00:00 - 05:59:59 | 388 | 2.4% | 0.11 | 1.1 MB | 2.5% | 0.32 |
| Jul 11 06:00:00 - 06:59:59 | 552 | 3.4% | 0.15 | 1.4 MB | 3.1% | 0.40 |
| Jul 11 07:00:00 - 07:59:59 | 654 | 4.0% | 0.18 | 1.7 MB | 3.6% | 0.47 |
| Jul 11 08:00:00 - 08:59:59 | 693 | 4.2% | 0.19 | 1.8 MB | 3.9% | 0.50 |
| Jul 11 09:00:00 - 09:59:59 | 821 | 5.0% | 0.23 | 2.2 MB | 4.8% | 0.62 |
| Jul 11 10:00:00 - 10:59:59 | 777 | 4.7% | 0.22 | 2.3 MB | 5.0% | 0.65 |
| Jul 11 11:00:00 - 11:59:59 | 775 | 4.7% | 0.22 | 2.0 MB | 4.4% | 0.57 |
| Jul 11 12:00:00 - 12:59:59 | 869 | 5.3% | 0.24 | 2.2 MB | 4.7% | 0.62 |
| Jul 11 13:00:00 - 13:59:59 | 893 | 5.5% | 0.25 | 2.4 MB | 5.3% | 0.69 |
| Jul 11 14:00:00 - 14:59:59 | 951 | 5.8% | 0.26 | 2.4 MB | 5.3% | 0.69 |
| Jul 11 15:00:00 - 15:59:59 | 872 | 5.3% | 0.24 | 2.7 MB | 5.8% | 0.76 |
| Jul 11 16:00:00 - 16:59:59 | 914 | 5.6% | 0.25 | 2.4 MB | 5.3% | 0.69 |
| Jul 11 17:00:00 - 17:59:59 | 870 | 5.3% | 0.24 | 2.1 MB | 4.7% | 0.61 |
| Jul 11 18:00:00 - 18:59:59 | 846 | 5.2% | 0.23 | 2.3 MB | 5.1% | 0.66 |
| Jul 11 19:00:00 - 19:59:59 | 952 | 5.8% | 0.26 | 2.5 MB | 5.5% | 0.71 |
| Jul 11 20:00:00 - 20:59:59 | 920 | 5.6% | 0.26 | 2.8 MB | 6.1% | 0.80 |
| Jul 11 21:00:00 - 21:59:59 | 681 | 4.2% | 0.19 | 1.8 MB | 4.0% | 0.52 |
| Jul 11 22:00:00 - 22:59:59 | 653 | 4.0% | 0.18 | 2.1 MB | 4.7% | 0.61 |
| Jul 11 23:00:00 - 23:59:59 | 499 | 3.0% | 0.14 | 1.6 MB | 3.4% | 0.44 |
| Jul 12 00:00:00 - 00:59:59 | 383 | 2.3% | 0.11 | 1.2 MB | 2.5% | 0.33 |
| Jul 12 01:00:00 - 01:59:59 | 388 | 2.4% | 0.11 | 1.5 MB | 3.3% | 0.42 |
| Jul 12 02:00:00 - 02:59:59 | 303 | 1.9% | 0.08 | 994.3 KB | 2.1% | 0.28 |
| Jul 12 03:00:00 - 03:59:59 | 331 | 2.0% | 0.09 | 1.1 MB | 2.3% | 0.31 |
| Jul 12 04:00:00 - 04:15:01 | 106 | 0.6% | 0.12 | 308.5 KB | 0.7% | 0.34 |
| TOTAL: 24:00:00 | 16371 | 100.0% | 0.19 | 45.8 MB | 100.0% | 0.54 |
Sites sending bad articles:
| Server | Total | Group | Dist | Duplic | Unapp | TooOld | Site | Line | Other | |
|---|---|---|---|---|---|---|---|---|---|---|
| 1 | i2pn | 454 | 4 | 0 | 0 | 0 | 0 | 0 | 0 | 450 |
| TOTAL: 1 | 454 | 4 | 0 | 0 | 0 | 0 | 0 | 0 | 450 | |
Unwanted newsgroups [Top 20]:
| Newsgroup | Count |
|---|---|
| 24hoursupport.helpdesk | 3 |
| alt.fr.outil.thunderbird | 1 |
| TOTAL: 2 | 4 |
NoCeM on Spool:
| Id | Good | Bad | Unique | Total |
|---|---|---|---|---|
| bleachbot@httrack.com | 38 | 0 | 43 | 43 |
| TOTAL: 1 | 38 | 20 | 43 | 43 |
Miscellaneous innd statistics [Top 10]:
| Event | Server | Number |
|---|---|---|
| Including strange strings | ||
| i2pn | 450 | |
| TOTAL: 1 | 450 | |
| TOTAL: 1 | 450 | |
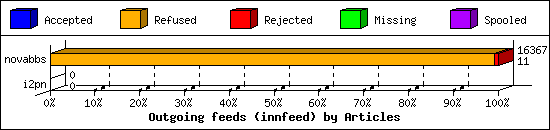
Outgoing Feeds (innfeed) by Articles:
| Server | Offered | Taken | Refused | Reject | Miss | Spool | %Took | Elapsed | |
|---|---|---|---|---|---|---|---|---|---|
| 1 | novabbs | 16407 | 11 | 16239 | 117 | 0 | 0 | 0% | 23:59:58 |
| 2 | i2pn | 0 | 0 | 0 | 0 | 0 | 0 | 0% | 00:10:00 |
| TOTAL: 2 | 16407 | 11 | 16239 | 117 | 0 | 0 | 0% | 24:09:58 | |
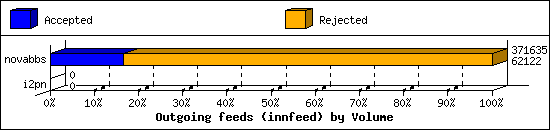
Outgoing Feeds (innfeed) by Volume:
| Server | AcceptVol | RejectVol | TotalVol | Volume/sec | Vol/Art | Elapsed | |
|---|---|---|---|---|---|---|---|
| 1 | novabbs | 60.7 KB | 302.3 KB | 362.9 KB | 0.0 KB/s | 2.8 KB | 23:59:58 |
| 2 | i2pn | 0.0 KB | 0.0 KB | 0.0 KB | 0.0 KB/s | 0 | 00:10:00 |
| TOTAL: 2 | 60.7 KB | 302.3 KB | 362.9 KB | 0.0 KB/s | 2.8 KB | 24:09:58 | |
NNRP readership statistics:
| System | Conn | Arts | Size | Groups | Post | Rej | Elapsed | |
|---|---|---|---|---|---|---|---|---|
| 1 | i2pn2.org | 33 | 0 | 0.0 KB | 0 | 0 | 0 | 00:00:10 |
| 2 | scan-141.security.ipip.net | 1 | 0 | 0.0 KB | 0 | 0 | 0 | 00:00:00 |
| 3 | static.254.108.9.5.clients.your-server.de | 2 | 0 | 0.0 KB | 0 | 0 | 0 | 00:00:40 |
| 4 | min-do-in-05-21-82193-v-prod.binaryedge.ninja | 1 | 0 | 0.0 KB | 0 | 0 | 0 | 00:00:02 |
| 5 | worker-18.sfj.corp.censys.io | 1 | 0 | 0.0 KB | 0 | 0 | 0 | 00:00:00 |
| TOTAL: 5 | 38 | 0 | 0.0 KB | 0 | 0 | 0 | 00:00:53 | |
NNRP readership statistics (by domain):
| System | Conn | Arts | Size | Groups | Post | Rej | Elapsed | |
|---|---|---|---|---|---|---|---|---|
| 1 | *.security.ipip.net | 1 | 0 | 0.0 KB | 0 | 0 | 0 | 00:00:00 |
| 2 | *.org | 33 | 0 | 0.0 KB | 0 | 0 | 0 | 00:00:10 |
| 3 | *.binaryedge.ninja | 1 | 0 | 0.0 KB | 0 | 0 | 0 | 00:00:02 |
| 4 | *.254.108.9.5.clients.your-server.de | 2 | 0 | 0.0 KB | 0 | 0 | 0 | 00:00:40 |
| 5 | *.sfj.corp.censys.io | 1 | 0 | 0.0 KB | 0 | 0 | 0 | 00:00:00 |
| TOTAL: 5 | 38 | 0 | 0.0 KB | 0 | 0 | 0 | 00:00:53 | |
NNRP auth users [Top 20]:
| User | Conn |
|---|---|
| i2pn2user | 33 |
| TOTAL: 1 | 33 |
NNRP total resource statistics [Top 20]:
| System | User(ms) | System(ms) | Idle(ms) | Elapsed |
|---|---|---|---|---|
| static.254.108.9.5.clients.your-server.de | 0.096 | 0.008 | 0.000 | 00:00:40 |
| i2pn2.org | 1.764 | 0.216 | 3.238 | 00:00:10 |
| min-do-in-05-21-82193-v-prod.binaryedge.ninja | 0.048 | 0.000 | 0.000 | 00:00:02 |
| scan-141.security.ipip.net | 0.060 | 0.008 | 0.000 | 00:00:00 |
| ? | 0.108 | 0.012 | 0.000 | 00:00:00 |
| worker-18.sfj.corp.censys.io | 0.052 | 0.004 | 0.000 | 00:00:00 |
| TOTAL: 6 | 2.128 | 0.248 | 3.238 | 00:00:53 |
NNRP unrecognized commands (by host):
| System | Conn |
|---|---|
| static.254.108.9.5.clients.your-server.de | 10 |
| scan-141.security.ipip.net | 4 |
| TOTAL: 2 | 14 |
NNRP unrecognized commands (by command):
| Command | Count |
|---|---|
| Accept: */* | 2 |
| Connection: close | 2 |
| User-Agent: Mozilla/5.0 (compatible; MJ1... | 2 |
| Host: news.i2pn2.org:119 | 1 |
| Host: 157.230.63.40:119 | 1 |
| Host: news.i2pn2.org | 1 |
| GET / HTTP/1.1 | 1 |
| GET /robots.txt HTTP/1.0 | 1 |
| User-Agent: HTTP Banner Detection (https... | 1 |
| Connection: keep-alive | 1 |
| GET /robots.txt HTTP/1.1 | 1 |
| TOTAL: 11 | 14 |
NNRP client timeouts [Top 20]:
| System | Conn | Peer |
|---|---|---|
| worker-18.sfj.corp.censys.io | 1 | 1 |
| TOTAL: 1 | 1 | 1 |
