Log entries by program:
| Program name | Lines | %Lines | Size | %Size |
|---|---|---|---|---|
| inn | 17165 | 89.9% | 1.4 MB | 85.1% |
| innd | 1043 | 5.5% | 161.6 KB | 9.7% |
| innfeed | 605 | 3.2% | 60.5 KB | 3.6% |
| nnrpd | 220 | 1.2% | 19.3 KB | 1.2% |
| nocem | 55 | 0.3% | 7.0 KB | 0.4% |
| controlchan | 1 | 0.0% | 0.0 KB | 0.0% |
| TOTAL: 6 | 19089 | 100.0% | 1.6 MB | 100.0% |
History cache:
| Reason | Count | %Count |
|---|---|---|
| Do not exist | 16635 | 98.9% |
| Negative hits | 142 | 0.8% |
| Positive hits | 38 | 0.2% |
| Cache misses | 5 | 0.0% |
| TOTAL: 4 | 16820 | 100.0% |
INND timer:
| Code region | Time | Pct | Invoked | Min(ms) | Avg(ms) | Max(ms) |
|---|---|---|---|---|---|---|
| article cancel | 00:00:00.024 | 0.0% | 62 | 0.000 | 0.387 | 3.000 |
| article cleanup | 00:00:00.098 | 0.0% | 16626 | 0.000 | 0.006 | 0.034 |
| article logging | 00:00:00.468 | 0.0% | 17041 | 0.000 | 0.027 | 0.079 |
| article parse | 00:00:00.259 | 0.0% | 18756 | 0.000 | 0.014 | 0.046 |
| article write | 00:00:08.778 | 0.0% | 16625 | 0.182 | 0.528 | 1.315 |
| artlog/artcncl | 00:00:00.002 | 0.0% | 62 | 0.000 | 0.032 | 0.333 |
| data move | 00:00:00.018 | 0.0% | 20775 | 0.000 | 0.001 | 0.014 |
| hisgrep/artcncl | 00:00:00.003 | 0.0% | 43 | 0.000 | 0.070 | 1.000 |
| hishave/artcncl | 00:00:00.001 | 0.0% | 62 | 0.000 | 0.016 | 1.000 |
| history grep | 00:00:00.000 | 0.0% | 0 | 0.000 | 0.000 | 0.000 |
| history lookup | 00:00:03.639 | 0.0% | 16776 | 0.000 | 0.217 | 1.478 |
| history sync | 00:00:00.020 | 0.0% | 302 | 0.000 | 0.066 | 1.000 |
| history write | 00:00:04.120 | 0.0% | 16626 | 0.013 | 0.248 | 0.694 |
| hiswrite/artcncl | 00:00:00.005 | 0.0% | 19 | 0.000 | 0.263 | 1.000 |
| idle | 23:49:36.091 | 99.9% | 19268 | 2529.228 | 4451.738 | 11765.961 |
| nntp read | 00:00:00.531 | 0.0% | 18969 | 0.000 | 0.028 | 0.081 |
| overview write | 00:00:03.550 | 0.0% | 16625 | 0.065 | 0.214 | 1.750 |
| perl filter | 00:00:23.693 | 0.0% | 16626 | 1.185 | 1.425 | 2.417 |
| python filter | 00:00:00.000 | 0.0% | 0 | 0.000 | 0.000 | 0.000 |
| site send | 00:00:00.717 | 0.0% | 16662 | 0.000 | 0.043 | 0.102 |
| TOTAL: 23:50:24.765 | 23:50:22.017 | 100.0% | - | - | - | - |
INNfeed timer:
| Code region | Time | Pct | Invoked | Min(ms) | Avg(ms) | Max(ms) |
|---|---|---|---|---|---|---|
| article new | 00:00:00.028 | 0.0% | 16659 | 0.000 | 0.002 | 0.028 |
| article prepare | 00:00:00.000 | 0.0% | 560 | 0.000 | 0.000 | 0.000 |
| article read | 00:00:00.033 | 0.0% | 140 | 0.000 | 0.236 | 23.000 |
| backlog stats | 00:00:00.021 | 0.0% | 54686 | 0.000 | 0.000 | 0.006 |
| callbacks | 00:00:00.000 | 0.0% | 0 | 0.000 | 0.000 | 0.000 |
| data read | 00:00:00.267 | 0.0% | 33491 | 0.000 | 0.008 | 0.029 |
| data write | 00:00:00.338 | 0.0% | 16846 | 0.000 | 0.020 | 0.062 |
| idle | 23:58:42.437 | 100.0% | 54686 | 906.431 | 1578.511 | 3855.811 |
| status file | 00:00:00.050 | 0.0% | 156 | 0.000 | 0.321 | 2.000 |
| TOTAL: 23:58:43.688 | 23:58:43.174 | 100.0% | - | - | - | - |
nnrpd timer:
| Code region | Time | Pct | Invoked | Min(ms) | Avg(ms) | Max(ms) |
|---|---|---|---|---|---|---|
| idle | 00:00:05.805 | 34.7% | 296 | 7.167 | 19.611 | 2301.000 |
| newnews | 00:00:00.000 | 0.0% | 0 | 0.000 | 0.000 | 0.000 |
| nntpwrite | 00:00:00.014 | 0.1% | 1027 | 0.000 | 0.014 | 0.095 |
| TOTAL: 00:00:16.734 | 00:00:05.819 | 34.8% | - | - | - | - |
Control commands to INND:
| Command | Number |
|---|---|
| L | 1 |
| flush | 3 |
| flushlogs | 2 |
| go | 2 |
| logmode | 2 |
| mode | 148 |
| name | 2 |
| pause | 2 |
| paused | 2 |
| reload | 2 |
| reserve | 2 |
| TOTAL: 11 | 168 |
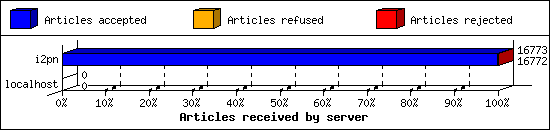
Incoming Feeds (INN):
| Server | Connects | Offered | Taken | Refused | Reject | %Accpt | Elapsed | |
|---|---|---|---|---|---|---|---|---|
| 1 | i2pn | 6 | 16773 | 16772 | 0 | 1 | 99% | 24:52:04 |
| 2 | localhost | 31 | 0 | 0 | 0 | 0 | 0% | 00:00:00 |
| TOTAL: 2 | 37 | 16773 | 16772 | 0 | 1 | 99% | 24:52:04 | |
Incoming Volume (INN):
| Server | AcceptVol | DupVol | RejVol | TotalVol | %Acc | Vol/Art | |
|---|---|---|---|---|---|---|---|
| 1 | i2pn | 46.7 MB | 0.0 KB | 3.4 KB | 46.7 MB | 99% | 2.8 KB |
| 2 | localhost | 0.0 KB | 0.0 KB | 0.0 KB | 0.0 KB | 0% | 0 |
| TOTAL: 2 | 46.7 MB | 0.0 KB | 3.4 KB | 46.7 MB | 99% | 2.8 KB | |

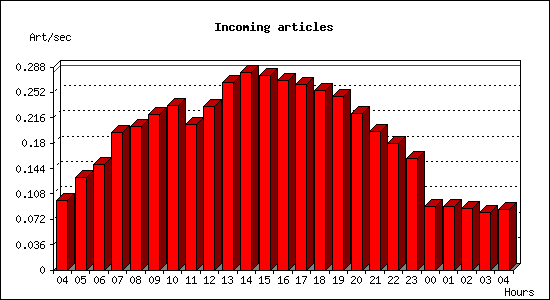
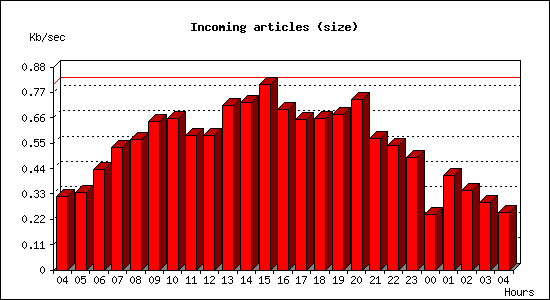
Incoming articles:
| Date | Articles | %Arts | Art/sec | Size | %Size | KB/sec |
|---|---|---|---|---|---|---|
| Jul 12 04:15:01 - 04:59:59 | 268 | 1.6% | 0.10 | 855.5 KB | 1.8% | 0.32 |
| Jul 12 05:00:00 - 05:59:59 | 472 | 2.8% | 0.13 | 1.2 MB | 2.6% | 0.34 |
| Jul 12 06:00:00 - 06:59:59 | 538 | 3.2% | 0.15 | 1.5 MB | 3.3% | 0.43 |
| Jul 12 07:00:00 - 07:59:59 | 704 | 4.2% | 0.20 | 1.9 MB | 4.0% | 0.53 |
| Jul 12 08:00:00 - 08:59:59 | 735 | 4.4% | 0.20 | 2.0 MB | 4.3% | 0.57 |
| Jul 12 09:00:00 - 09:59:59 | 795 | 4.8% | 0.22 | 2.3 MB | 4.9% | 0.65 |
| Jul 12 10:00:00 - 10:59:59 | 840 | 5.0% | 0.23 | 2.3 MB | 5.0% | 0.66 |
| Jul 12 11:00:00 - 11:59:59 | 744 | 4.5% | 0.21 | 2.1 MB | 4.4% | 0.58 |
| Jul 12 12:00:00 - 12:59:59 | 835 | 5.0% | 0.23 | 2.1 MB | 4.4% | 0.58 |
| Jul 12 13:00:00 - 13:59:59 | 958 | 5.7% | 0.27 | 2.5 MB | 5.4% | 0.71 |
| Jul 12 14:00:00 - 14:59:59 | 1011 | 6.1% | 0.28 | 2.5 MB | 5.5% | 0.72 |
| Jul 12 15:00:00 - 15:59:59 | 995 | 6.0% | 0.28 | 2.8 MB | 6.1% | 0.80 |
| Jul 12 16:00:00 - 16:59:59 | 969 | 5.8% | 0.27 | 2.4 MB | 5.3% | 0.69 |
| Jul 12 17:00:00 - 17:59:59 | 949 | 5.7% | 0.26 | 2.3 MB | 4.9% | 0.65 |
| Jul 12 18:00:00 - 18:59:59 | 917 | 5.5% | 0.25 | 2.3 MB | 5.0% | 0.66 |
| Jul 12 19:00:00 - 19:59:59 | 888 | 5.3% | 0.25 | 2.4 MB | 5.1% | 0.67 |
| Jul 12 20:00:00 - 20:59:59 | 800 | 4.8% | 0.22 | 2.6 MB | 5.6% | 0.74 |
| Jul 12 21:00:00 - 21:59:59 | 707 | 4.2% | 0.20 | 2.0 MB | 4.3% | 0.57 |
| Jul 12 22:00:00 - 22:59:59 | 648 | 3.9% | 0.18 | 1.9 MB | 4.1% | 0.54 |
| Jul 12 23:00:00 - 23:59:59 | 572 | 3.4% | 0.16 | 1.7 MB | 3.7% | 0.49 |
| Jul 13 00:00:00 - 00:59:59 | 323 | 1.9% | 0.09 | 860.2 KB | 1.8% | 0.24 |
| Jul 13 01:00:00 - 01:59:59 | 325 | 1.9% | 0.09 | 1.4 MB | 3.1% | 0.41 |
| Jul 13 02:00:00 - 02:59:59 | 316 | 1.9% | 0.09 | 1.2 MB | 2.6% | 0.34 |
| Jul 13 03:00:00 - 03:59:59 | 292 | 1.8% | 0.08 | 1.0 MB | 2.2% | 0.29 |
| Jul 13 04:00:00 - 04:15:01 | 77 | 0.5% | 0.09 | 225.2 KB | 0.5% | 0.25 |
| TOTAL: 24:00:00 | 16678 | 100.0% | 0.19 | 46.3 MB | 100.0% | 0.55 |
Sites sending bad articles:
| Server | Total | Group | Dist | Duplic | Unapp | TooOld | Site | Line | Other | |
|---|---|---|---|---|---|---|---|---|---|---|
| 1 | i2pn | 416 | 1 | 0 | 0 | 0 | 0 | 0 | 0 | 415 |
| TOTAL: 1 | 416 | 1 | 0 | 0 | 0 | 0 | 0 | 0 | 415 | |
Unwanted newsgroups [Top 20]:
| Newsgroup | Count |
|---|---|
| hk.politics | 1 |
| TOTAL: 1 | 1 |
NoCeM on Spool:
| Id | Good | Bad | Unique | Total |
|---|---|---|---|---|
| bleachbot@httrack.com | 28 | 0 | 28 | 28 |
| TOTAL: 1 | 28 | 21 | 28 | 28 |
Miscellaneous innd statistics [Top 10]:
| Event | Server | Number |
|---|---|---|
| Including strange strings | ||
| i2pn | 415 | |
| TOTAL: 1 | 415 | |
| TOTAL: 1 | 415 | |
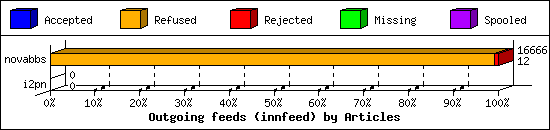
Outgoing Feeds (innfeed) by Articles:
| Server | Offered | Taken | Refused | Reject | Miss | Spool | %Took | Elapsed | |
|---|---|---|---|---|---|---|---|---|---|
| 1 | novabbs | 16705 | 12 | 16526 | 128 | 0 | 0 | 0% | 23:59:40 |
| 2 | i2pn | 0 | 0 | 0 | 0 | 0 | 0 | 0% | 00:10:00 |
| TOTAL: 2 | 16705 | 12 | 16526 | 128 | 0 | 0 | 0% | 24:09:40 | |
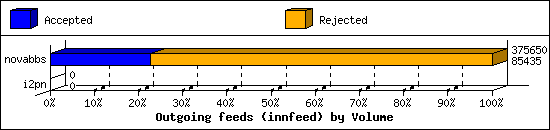
Outgoing Feeds (innfeed) by Volume:
| Server | AcceptVol | RejectVol | TotalVol | Volume/sec | Vol/Art | Elapsed | |
|---|---|---|---|---|---|---|---|
| 1 | novabbs | 83.4 KB | 283.4 KB | 366.8 KB | 0.0 KB/s | 2.6 KB | 23:59:40 |
| 2 | i2pn | 0.0 KB | 0.0 KB | 0.0 KB | 0.0 KB/s | 0 | 00:10:00 |
| TOTAL: 2 | 83.4 KB | 283.4 KB | 366.8 KB | 0.0 KB/s | 2.6 KB | 24:09:40 | |
NNRP readership statistics:
| System | Conn | Arts | Size | Groups | Post | Rej | Elapsed | |
|---|---|---|---|---|---|---|---|---|
| 1 | i2pn2.org | 39 | 0 | 0.0 KB | 0 | 0 | 0 | 00:00:14 |
| 2 | census8.shodan.io | 1 | 0 | 0.0 KB | 0 | 0 | 0 | 00:00:02 |
| TOTAL: 2 | 40 | 0 | 0.0 KB | 0 | 0 | 0 | 00:00:16 | |
NNRP readership statistics (by domain):
| System | Conn | Arts | Size | Groups | Post | Rej | Elapsed | |
|---|---|---|---|---|---|---|---|---|
| 1 | *.shodan.io | 1 | 0 | 0.0 KB | 0 | 0 | 0 | 00:00:02 |
| 2 | *.org | 39 | 0 | 0.0 KB | 0 | 0 | 0 | 00:00:14 |
| TOTAL: 2 | 40 | 0 | 0.0 KB | 0 | 0 | 0 | 00:00:16 | |
NNRP auth users [Top 20]:
| User | Conn |
|---|---|
| i2pn2user | 39 |
| TOTAL: 1 | 39 |
NNRP total resource statistics [Top 20]:
| System | User(ms) | System(ms) | Idle(ms) | Elapsed |
|---|---|---|---|---|
| i2pn2.org | 2.136 | 0.232 | 3.800 | 00:00:14 |
| census8.shodan.io | 0.044 | 0.004 | 0.000 | 00:00:02 |
| TOTAL: 2 | 2.180 | 0.236 | 3.800 | 00:00:16 |
