Log entries by program:
| Program name | Lines | %Lines | Size | %Size |
|---|---|---|---|---|
| inn | 15183 | 87.9% | 1.2 MB | 82.8% |
| innd | 1060 | 6.1% | 145.9 KB | 9.5% |
| innfeed | 606 | 3.5% | 79.6 KB | 5.2% |
| nnrpd | 331 | 1.9% | 27.5 KB | 1.8% |
| nocem | 98 | 0.6% | 11.4 KB | 0.7% |
| controlchan | 1 | 0.0% | 0.1 KB | 0.0% |
| TOTAL: 6 | 17279 | 100.0% | 1.5 MB | 100.0% |
History cache:
| Reason | Count | %Count |
|---|---|---|
| Do not exist | 14788 | 97.2% |
| Negative hits | 293 | 1.9% |
| Cache misses | 70 | 0.5% |
| Positive hits | 63 | 0.4% |
| TOTAL: 4 | 15214 | 100.0% |
INND timer:
| Code region | Time | Pct | Invoked | Min(ms) | Avg(ms) | Max(ms) |
|---|---|---|---|---|---|---|
| article cancel | 00:00:00.115 | 0.0% | 217 | 0.000 | 0.530 | 3.000 |
| article cleanup | 00:00:00.068 | 0.0% | 14774 | 0.000 | 0.005 | 0.030 |
| article logging | 00:00:00.497 | 0.0% | 15062 | 0.000 | 0.033 | 0.088 |
| article parse | 00:00:00.200 | 0.0% | 16883 | 0.000 | 0.012 | 0.060 |
| article write | 00:00:04.873 | 0.0% | 14769 | 0.075 | 0.330 | 1.237 |
| artlog/artcncl | 00:00:00.004 | 0.0% | 154 | 0.000 | 0.026 | 0.500 |
| data move | 00:00:00.018 | 0.0% | 19083 | 0.000 | 0.001 | 0.017 |
| hisgrep/artcncl | 00:00:00.033 | 0.0% | 144 | 0.000 | 0.229 | 0.778 |
| hishave/artcncl | 00:00:00.032 | 0.0% | 217 | 0.000 | 0.147 | 1.000 |
| history grep | 00:00:00.000 | 0.0% | 0 | 0.000 | 0.000 | 0.000 |
| history lookup | 00:00:01.392 | 0.0% | 15074 | 0.000 | 0.092 | 1.026 |
| history sync | 00:00:00.009 | 0.0% | 418 | 0.000 | 0.022 | 0.667 |
| history write | 00:00:01.770 | 0.0% | 14774 | 0.000 | 0.120 | 0.963 |
| hiswrite/artcncl | 00:00:00.008 | 0.0% | 73 | 0.000 | 0.110 | 1.000 |
| idle | 24:00:18.300 | 100.0% | 17738 | 1835.012 | 4871.930 | 12508.979 |
| nntp read | 00:00:00.451 | 0.0% | 17316 | 0.000 | 0.026 | 0.071 |
| overview write | 00:00:02.930 | 0.0% | 14769 | 0.037 | 0.198 | 2.211 |
| perl filter | 00:00:21.434 | 0.0% | 14774 | 1.062 | 1.451 | 2.015 |
| python filter | 00:00:00.000 | 0.0% | 0 | 0.000 | 0.000 | 0.000 |
| site send | 00:00:00.549 | 0.0% | 14860 | 0.000 | 0.037 | 0.104 |
| TOTAL: 24:00:55.156 | 24:00:52.683 | 100.0% | - | - | - | - |
INNfeed timer:
| Code region | Time | Pct | Invoked | Min(ms) | Avg(ms) | Max(ms) |
|---|---|---|---|---|---|---|
| article new | 00:00:00.036 | 0.0% | 14707 | 0.000 | 0.002 | 0.032 |
| article prepare | 00:00:00.000 | 0.0% | 512 | 0.000 | 0.000 | 0.000 |
| article read | 00:00:00.035 | 0.0% | 128 | 0.000 | 0.273 | 15.000 |
| backlog stats | 00:00:00.021 | 0.0% | 48698 | 0.000 | 0.000 | 0.007 |
| callbacks | 00:00:00.000 | 0.0% | 0 | 0.000 | 0.000 | 0.000 |
| data read | 00:00:00.214 | 0.0% | 29551 | 0.000 | 0.007 | 0.038 |
| data write | 00:00:00.241 | 0.0% | 14850 | 0.000 | 0.016 | 0.060 |
| idle | 23:49:57.748 | 100.0% | 48698 | 626.309 | 1761.833 | 4099.510 |
| status file | 00:00:00.042 | 0.0% | 155 | 0.000 | 0.271 | 1.000 |
| TOTAL: 23:49:58.844 | 23:49:58.337 | 100.0% | - | - | - | - |
nnrpd timer:
| Code region | Time | Pct | Invoked | Min(ms) | Avg(ms) | Max(ms) |
|---|---|---|---|---|---|---|
| idle | 00:00:20.394 | 62.6% | 565 | 7.000 | 36.096 | 9823.000 |
| newnews | 00:00:00.000 | 0.0% | 0 | 0.000 | 0.000 | 0.000 |
| nntpwrite | 00:00:00.021 | 0.1% | 1929 | 0.000 | 0.011 | 0.048 |
| readart | 00:00:00.022 | 0.1% | 1 | 22.000 | 22.000 | 22.000 |
| TOTAL: 00:00:32.569 | 00:00:20.437 | 62.7% | - | - | - | - |
Control commands to INND:
| Command | Number |
|---|---|
| L | 1 |
| flush | 3 |
| flushlogs | 2 |
| go | 2 |
| logmode | 2 |
| mode | 148 |
| name | 2 |
| pause | 2 |
| paused | 2 |
| reload | 2 |
| reserve | 2 |
| TOTAL: 11 | 168 |
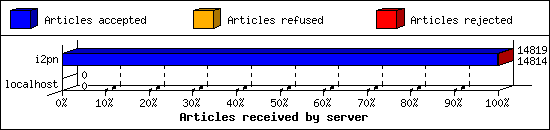
Incoming Feeds (INN):
| Server | Connects | Offered | Taken | Refused | Reject | %Accpt | Elapsed | |
|---|---|---|---|---|---|---|---|---|
| 1 | i2pn | 7 | 14819 | 14814 | 0 | 5 | 99% | 24:55:27 |
| 2 | localhost | 29 | 0 | 0 | 0 | 0 | 0% | 00:00:00 |
| TOTAL: 2 | 36 | 14819 | 14814 | 0 | 5 | 99% | 24:55:27 | |
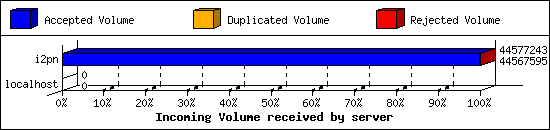
Incoming Volume (INN):
| Server | AcceptVol | DupVol | RejVol | TotalVol | %Acc | Vol/Art | |
|---|---|---|---|---|---|---|---|
| 1 | i2pn | 42.5 MB | 0.0 KB | 9.4 KB | 42.5 MB | 99% | 2.9 KB |
| 2 | localhost | 0.0 KB | 0.0 KB | 0.0 KB | 0.0 KB | 0% | 0 |
| TOTAL: 2 | 42.5 MB | 0.0 KB | 9.4 KB | 42.5 MB | 99% | 2.9 KB | |
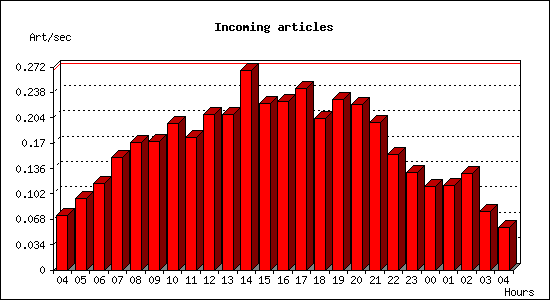
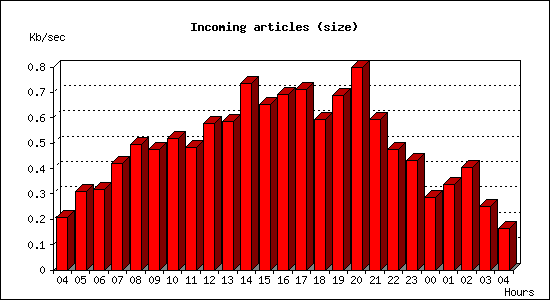
Incoming articles:
| Date | Articles | %Arts | Art/sec | Size | %Size | KB/sec |
|---|---|---|---|---|---|---|
| Jul 13 04:15:01 - 04:59:59 | 198 | 1.3% | 0.07 | 554.5 KB | 1.3% | 0.21 |
| Jul 13 05:00:00 - 05:59:59 | 346 | 2.3% | 0.10 | 1.1 MB | 2.6% | 0.31 |
| Jul 13 06:00:00 - 06:59:59 | 419 | 2.8% | 0.12 | 1.1 MB | 2.7% | 0.32 |
| Jul 13 07:00:00 - 07:59:59 | 542 | 3.7% | 0.15 | 1.5 MB | 3.5% | 0.42 |
| Jul 13 08:00:00 - 08:59:59 | 613 | 4.2% | 0.17 | 1.7 MB | 4.1% | 0.49 |
| Jul 13 09:00:00 - 09:59:59 | 620 | 4.2% | 0.17 | 1.7 MB | 3.9% | 0.47 |
| Jul 13 10:00:00 - 10:59:59 | 706 | 4.8% | 0.20 | 1.8 MB | 4.3% | 0.52 |
| Jul 13 11:00:00 - 11:59:59 | 639 | 4.3% | 0.18 | 1.7 MB | 4.0% | 0.48 |
| Jul 13 12:00:00 - 12:59:59 | 751 | 5.1% | 0.21 | 2.0 MB | 4.8% | 0.58 |
| Jul 13 13:00:00 - 13:59:59 | 752 | 5.1% | 0.21 | 2.1 MB | 4.9% | 0.59 |
| Jul 13 14:00:00 - 14:59:59 | 963 | 6.5% | 0.27 | 2.6 MB | 6.1% | 0.74 |
| Jul 13 15:00:00 - 15:59:59 | 804 | 5.5% | 0.22 | 2.3 MB | 5.4% | 0.65 |
| Jul 13 16:00:00 - 16:59:59 | 811 | 5.5% | 0.23 | 2.4 MB | 5.7% | 0.69 |
| Jul 13 17:00:00 - 17:59:59 | 877 | 6.0% | 0.24 | 2.5 MB | 5.9% | 0.71 |
| Jul 13 18:00:00 - 18:59:59 | 731 | 5.0% | 0.20 | 2.1 MB | 4.9% | 0.59 |
| Jul 13 19:00:00 - 19:59:59 | 824 | 5.6% | 0.23 | 2.4 MB | 5.7% | 0.69 |
| Jul 13 20:00:00 - 20:59:59 | 797 | 5.4% | 0.22 | 2.8 MB | 6.6% | 0.80 |
| Jul 13 21:00:00 - 21:59:59 | 711 | 4.8% | 0.20 | 2.1 MB | 4.9% | 0.59 |
| Jul 13 22:00:00 - 22:59:59 | 557 | 3.8% | 0.15 | 1.7 MB | 4.0% | 0.48 |
| Jul 13 23:00:00 - 23:59:59 | 469 | 3.2% | 0.13 | 1.5 MB | 3.6% | 0.43 |
| Jul 14 00:00:00 - 00:59:59 | 402 | 2.7% | 0.11 | 1.0 MB | 2.4% | 0.28 |
| Jul 14 01:00:00 - 01:59:59 | 406 | 2.8% | 0.11 | 1.2 MB | 2.8% | 0.34 |
| Jul 14 02:00:00 - 02:59:59 | 465 | 3.2% | 0.13 | 1.4 MB | 3.4% | 0.41 |
| Jul 14 03:00:00 - 03:59:59 | 283 | 1.9% | 0.08 | 904.0 KB | 2.1% | 0.25 |
| Jul 14 04:00:00 - 04:15:01 | 51 | 0.3% | 0.06 | 146.9 KB | 0.3% | 0.16 |
| TOTAL: 24:00:00 | 14737 | 100.0% | 0.17 | 42.3 MB | 100.0% | 0.50 |
Sites sending bad articles:
| Server | Total | Group | Dist | Duplic | Unapp | TooOld | Site | Line | Other | |
|---|---|---|---|---|---|---|---|---|---|---|
| 1 | i2pn | 293 | 0 | 0 | 0 | 0 | 0 | 0 | 0 | 293 |
| TOTAL: 1 | 293 | 0 | 0 | 0 | 0 | 0 | 0 | 0 | 293 | |
INND Perl filter [Top 20]:
| Reason | Count |
|---|---|
| EMP (phn nph) | 4 |
| EMP (phn path) | 1 |
| TOTAL: 2 | 5 |
NoCeM on Spool:
| Id | Good | Bad | Unique | Total |
|---|---|---|---|---|
| bleachbot@httrack.com | 80 | 0 | 92 | 92 |
| TOTAL: 1 | 80 | 14 | 92 | 92 |
Miscellaneous innd statistics [Top 10]:
| Event | Server | Number |
|---|---|---|
| Including strange strings | ||
| i2pn | 288 | |
| TOTAL: 1 | 288 | |
| TOTAL: 1 | 288 | |
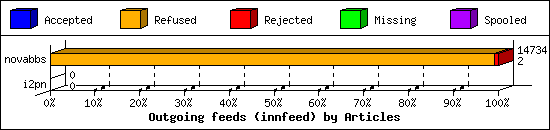
Outgoing Feeds (innfeed) by Articles:
| Server | Offered | Taken | Refused | Reject | Miss | Spool | %Took | Elapsed | |
|---|---|---|---|---|---|---|---|---|---|
| 1 | novabbs | 14741 | 2 | 14606 | 126 | 0 | 0 | 0% | 23:59:56 |
| 2 | i2pn | 0 | 0 | 0 | 0 | 0 | 0 | 0% | 00:10:00 |
| TOTAL: 2 | 14741 | 2 | 14606 | 126 | 0 | 0 | 0% | 24:09:56 | |
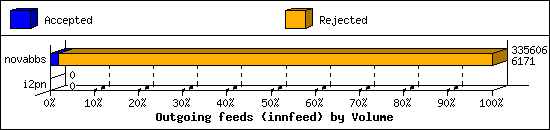
Outgoing Feeds (innfeed) by Volume:
| Server | AcceptVol | RejectVol | TotalVol | Volume/sec | Vol/Art | Elapsed | |
|---|---|---|---|---|---|---|---|
| 1 | novabbs | 6.0 KB | 321.7 KB | 327.7 KB | 0.0 KB/s | 2.6 KB | 23:59:56 |
| 2 | i2pn | 0.0 KB | 0.0 KB | 0.0 KB | 0.0 KB/s | 0 | 00:10:00 |
| TOTAL: 2 | 6.0 KB | 321.7 KB | 327.7 KB | 0.0 KB/s | 2.6 KB | 24:09:56 | |
NNRP readership statistics:
| System | Conn | Arts | Size | Groups | Post | Rej | Elapsed | |
|---|---|---|---|---|---|---|---|---|
| 1 | i2pn2.org | 44 | 1 | 1.7 KB | 1 | 0 | 0 | 00:00:22 |
| TOTAL: 1 | 44 | 1 | 1.7 KB | 1 | 0 | 0 | 00:00:32 | |
NNRP readership statistics (by domain):
| System | Conn | Arts | Size | Groups | Post | Rej | Elapsed | |
|---|---|---|---|---|---|---|---|---|
| 1 | *.org | 44 | 1 | 1.7 KB | 1 | 0 | 0 | 00:00:22 |
| 2 | unresolved | 1 | 0 | 0.0 KB | 0 | 0 | 0 | 00:00:09 |
| TOTAL: 2 | 45 | 1 | 1.7 KB | 1 | 0 | 0 | 00:00:32 | |
NNRP auth users [Top 20]:
| User | Conn |
|---|---|
| i2pn2user | 44 |
| TOTAL: 1 | 44 |
NNRP total resource statistics [Top 20]:
| System | User(ms) | System(ms) | Idle(ms) | Elapsed |
|---|---|---|---|---|
| i2pn2.org | 2.876 | 0.388 | 4.360 | 00:00:22 |
| 107.170.237.161 | 0.040 | 0.012 | 0.000 | 00:00:09 |
| TOTAL: 2 | 2.916 | 0.400 | 4.360 | 00:00:32 |
Curious NNRP server explorers [Top 20]:
| System | Conn |
|---|---|
| 107.170.237.161 | 1 |
| TOTAL: 1 | 1 |
Newsgroup request counts (by category):
| Category | Count | Pct | |
|---|---|---|---|
| 1 | rocksolid | 1 | 100.0% |
| TOTAL: 1 | 1 | 100.0% | |
Newsgroup request counts (by newsgroup) [Top 100]:
| Newsgroup | Count | |
|---|---|---|
| 1 | rocksolid.shared.i2p | 1 |
| TOTAL: 1 | 1 | |
