Log entries by program:
| Program name | Lines | %Lines | Size | %Size |
|---|---|---|---|---|
| inn | 14794 | 89.2% | 1.2 MB | 84.0% |
| innd | 991 | 6.0% | 139.0 KB | 9.5% |
| innfeed | 607 | 3.7% | 78.9 KB | 5.4% |
| nnrpd | 180 | 1.1% | 14.8 KB | 1.0% |
| nocem | 18 | 0.1% | 2.0 KB | 0.1% |
| controlchan | 1 | 0.0% | 0.1 KB | 0.0% |
| TOTAL: 6 | 16591 | 100.0% | 1.4 MB | 100.0% |
History cache:
| Reason | Count | %Count |
|---|---|---|
| Do not exist | 14338 | 98.7% |
| Negative hits | 147 | 1.0% |
| Positive hits | 25 | 0.2% |
| Cache misses | 14 | 0.1% |
| TOTAL: 4 | 14524 | 100.0% |
INND timer:
| Code region | Time | Pct | Invoked | Min(ms) | Avg(ms) | Max(ms) |
|---|---|---|---|---|---|---|
| article cancel | 00:00:00.046 | 0.0% | 50 | 0.000 | 0.920 | 4.000 |
| article cleanup | 00:00:00.107 | 0.0% | 14362 | 0.000 | 0.007 | 0.049 |
| article logging | 00:00:00.399 | 0.0% | 14696 | 0.000 | 0.027 | 0.075 |
| article parse | 00:00:00.197 | 0.0% | 16809 | 0.000 | 0.012 | 0.091 |
| article write | 00:00:05.915 | 0.0% | 14353 | 0.146 | 0.412 | 6.419 |
| artlog/artcncl | 00:00:00.001 | 0.0% | 50 | 0.000 | 0.020 | 0.100 |
| data move | 00:00:00.012 | 0.0% | 19030 | 0.000 | 0.001 | 0.011 |
| hisgrep/artcncl | 00:00:00.007 | 0.0% | 48 | 0.000 | 0.146 | 1.000 |
| hishave/artcncl | 00:00:00.002 | 0.0% | 50 | 0.000 | 0.040 | 0.200 |
| history grep | 00:00:00.000 | 0.0% | 0 | 0.000 | 0.000 | 0.000 |
| history lookup | 00:00:01.315 | 0.0% | 14514 | 0.000 | 0.091 | 0.960 |
| history sync | 00:00:00.018 | 0.0% | 413 | 0.000 | 0.044 | 0.333 |
| history write | 00:00:03.088 | 0.0% | 14362 | 0.000 | 0.215 | 0.829 |
| hiswrite/artcncl | 00:00:00.000 | 0.0% | 2 | 0.000 | 0.000 | 0.000 |
| idle | 24:00:28.954 | 100.0% | 17395 | 2653.363 | 4968.609 | 15394.590 |
| nntp read | 00:00:00.440 | 0.0% | 17005 | 0.000 | 0.026 | 0.090 |
| overview write | 00:00:02.196 | 0.0% | 14353 | 0.022 | 0.153 | 2.162 |
| perl filter | 00:00:20.430 | 0.0% | 14362 | 1.108 | 1.423 | 2.263 |
| python filter | 00:00:00.000 | 0.0% | 0 | 0.000 | 0.000 | 0.000 |
| site send | 00:00:00.507 | 0.0% | 14366 | 0.000 | 0.035 | 0.099 |
| TOTAL: 24:01:06.031 | 24:01:03.634 | 100.0% | - | - | - | - |
INNfeed timer:
| Code region | Time | Pct | Invoked | Min(ms) | Avg(ms) | Max(ms) |
|---|---|---|---|---|---|---|
| article new | 00:00:00.025 | 0.0% | 14387 | 0.000 | 0.002 | 0.019 |
| article prepare | 00:00:00.000 | 0.0% | 136 | 0.000 | 0.000 | 0.000 |
| article read | 00:00:00.031 | 0.0% | 34 | 0.000 | 0.912 | 14.500 |
| backlog stats | 00:00:00.018 | 0.0% | 47614 | 0.000 | 0.000 | 0.009 |
| callbacks | 00:00:00.000 | 0.0% | 0 | 0.000 | 0.000 | 0.000 |
| data read | 00:00:00.229 | 0.0% | 28827 | 0.000 | 0.008 | 0.031 |
| data write | 00:00:00.269 | 0.0% | 14452 | 0.000 | 0.019 | 0.064 |
| idle | 23:59:06.056 | 100.0% | 47614 | 972.710 | 1813.459 | 5365.643 |
| status file | 00:00:00.048 | 0.0% | 156 | 0.000 | 0.308 | 1.000 |
| TOTAL: 23:59:07.136 | 23:59:06.676 | 100.0% | - | - | - | - |
nnrpd timer:
| Code region | Time | Pct | Invoked | Min(ms) | Avg(ms) | Max(ms) |
|---|---|---|---|---|---|---|
| idle | 00:00:03.054 | 25.1% | 251 | 7.167 | 12.167 | 25.046 |
| newnews | 00:00:00.000 | 0.0% | 0 | 0.000 | 0.000 | 0.000 |
| nntpwrite | 00:00:00.021 | 0.2% | 870 | 0.000 | 0.024 | 0.238 |
| TOTAL: 00:00:12.182 | 00:00:03.075 | 25.2% | - | - | - | - |
Control commands to INND:
| Command | Number |
|---|---|
| L | 1 |
| flush | 3 |
| flushlogs | 2 |
| go | 2 |
| logmode | 2 |
| mode | 148 |
| name | 2 |
| pause | 2 |
| paused | 2 |
| reload | 2 |
| reserve | 2 |
| TOTAL: 11 | 168 |
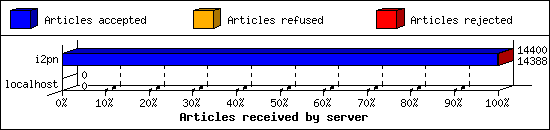
Incoming Feeds (INN):
| Server | Connects | Offered | Taken | Refused | Reject | %Accpt | Elapsed | |
|---|---|---|---|---|---|---|---|---|
| 1 | i2pn | 7 | 14400 | 14388 | 0 | 12 | 99% | 24:38:21 |
| 2 | localhost | 28 | 0 | 0 | 0 | 0 | 0% | 00:00:00 |
| TOTAL: 2 | 35 | 14400 | 14388 | 0 | 12 | 99% | 24:38:21 | |
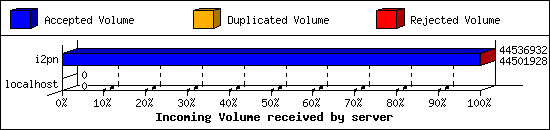
Incoming Volume (INN):
| Server | AcceptVol | DupVol | RejVol | TotalVol | %Acc | Vol/Art | |
|---|---|---|---|---|---|---|---|
| 1 | i2pn | 42.4 MB | 0.0 KB | 34.2 KB | 42.5 MB | 99% | 3.0 KB |
| 2 | localhost | 0.0 KB | 0.0 KB | 0.0 KB | 0.0 KB | 0% | 0 |
| TOTAL: 2 | 42.4 MB | 0.0 KB | 34.2 KB | 42.5 MB | 99% | 3.0 KB | |
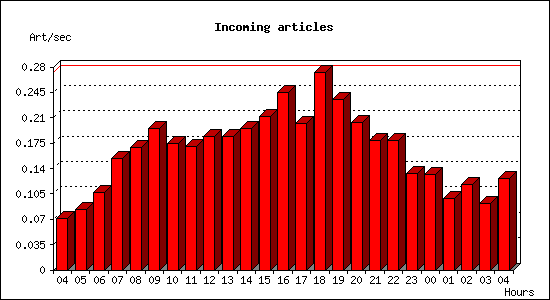
Incoming articles:
| Date | Articles | %Arts | Art/sec | Size | %Size | KB/sec |
|---|---|---|---|---|---|---|
| Jul 14 04:15:01 - 04:59:59 | 190 | 1.3% | 0.07 | 605.4 KB | 1.4% | 0.22 |
| Jul 14 05:00:00 - 05:59:59 | 298 | 2.1% | 0.08 | 1.0 MB | 2.5% | 0.30 |
| Jul 14 06:00:00 - 06:59:59 | 384 | 2.7% | 0.11 | 1.1 MB | 2.6% | 0.32 |
| Jul 14 07:00:00 - 07:59:59 | 555 | 3.9% | 0.15 | 1.3 MB | 3.1% | 0.38 |
| Jul 14 08:00:00 - 08:59:59 | 606 | 4.2% | 0.17 | 1.6 MB | 3.9% | 0.47 |
| Jul 14 09:00:00 - 09:59:59 | 705 | 4.9% | 0.20 | 2.3 MB | 5.4% | 0.66 |
| Jul 14 10:00:00 - 10:59:59 | 626 | 4.3% | 0.17 | 1.9 MB | 4.6% | 0.55 |
| Jul 14 11:00:00 - 11:59:59 | 611 | 4.2% | 0.17 | 1.6 MB | 3.8% | 0.46 |
| Jul 14 12:00:00 - 12:59:59 | 661 | 4.6% | 0.18 | 2.0 MB | 4.7% | 0.57 |
| Jul 14 13:00:00 - 13:59:59 | 662 | 4.6% | 0.18 | 2.1 MB | 4.9% | 0.59 |
| Jul 14 14:00:00 - 14:59:59 | 705 | 4.9% | 0.20 | 1.8 MB | 4.2% | 0.50 |
| Jul 14 15:00:00 - 15:59:59 | 763 | 5.3% | 0.21 | 2.3 MB | 5.5% | 0.66 |
| Jul 14 16:00:00 - 16:59:59 | 881 | 6.1% | 0.24 | 2.2 MB | 5.2% | 0.63 |
| Jul 14 17:00:00 - 17:59:59 | 725 | 5.0% | 0.20 | 2.0 MB | 4.8% | 0.58 |
| Jul 14 18:00:00 - 18:59:59 | 982 | 6.8% | 0.27 | 2.7 MB | 6.4% | 0.78 |
| Jul 14 19:00:00 - 19:59:59 | 845 | 5.9% | 0.23 | 2.2 MB | 5.2% | 0.63 |
| Jul 14 20:00:00 - 20:59:59 | 734 | 5.1% | 0.20 | 2.5 MB | 5.9% | 0.72 |
| Jul 14 21:00:00 - 21:59:59 | 645 | 4.5% | 0.18 | 1.8 MB | 4.2% | 0.51 |
| Jul 14 22:00:00 - 22:59:59 | 642 | 4.5% | 0.18 | 2.0 MB | 4.8% | 0.58 |
| Jul 14 23:00:00 - 23:59:59 | 478 | 3.3% | 0.13 | 1.4 MB | 3.4% | 0.41 |
| Jul 15 00:00:00 - 00:59:59 | 474 | 3.3% | 0.13 | 1.5 MB | 3.5% | 0.42 |
| Jul 15 01:00:00 - 01:59:59 | 354 | 2.5% | 0.10 | 1.1 MB | 2.5% | 0.30 |
| Jul 15 02:00:00 - 02:59:59 | 427 | 3.0% | 0.12 | 1.7 MB | 4.1% | 0.50 |
| Jul 15 03:00:00 - 03:59:59 | 328 | 2.3% | 0.09 | 1.1 MB | 2.5% | 0.31 |
| Jul 15 04:00:00 - 04:15:01 | 114 | 0.8% | 0.13 | 372.3 KB | 0.9% | 0.41 |
| TOTAL: 24:00:00 | 14395 | 100.0% | 0.17 | 42.5 MB | 100.0% | 0.50 |

Sites sending bad articles:
| Server | Total | Group | Dist | Duplic | Unapp | TooOld | Site | Line | Other | |
|---|---|---|---|---|---|---|---|---|---|---|
| 1 | i2pn | 350 | 12 | 0 | 0 | 0 | 0 | 0 | 0 | 338 |
| TOTAL: 1 | 350 | 12 | 0 | 0 | 0 | 0 | 0 | 0 | 338 | |
Unwanted newsgroups [Top 20]:
| Newsgroup | Count |
|---|---|
| alt.pl.nieruchomosci.gielda | 11 |
| biz.mlm | 1 |
| TOTAL: 2 | 12 |
NoCeM on Spool:
| Id | Good | Bad | Unique | Total |
|---|---|---|---|---|
| bleachbot@httrack.com | 10 | 0 | 10 | 10 |
| TOTAL: 1 | 10 | 5 | 10 | 10 |
Miscellaneous innd statistics [Top 10]:
| Event | Server | Number |
|---|---|---|
| Including strange strings | ||
| i2pn | 338 | |
| TOTAL: 1 | 338 | |
| TOTAL: 1 | 338 | |
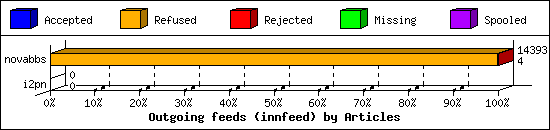
Outgoing Feeds (innfeed) by Articles:
| Server | Offered | Taken | Refused | Reject | Miss | Spool | %Took | Elapsed | |
|---|---|---|---|---|---|---|---|---|---|
| 1 | novabbs | 14414 | 4 | 14358 | 31 | 0 | 0 | 0% | 23:59:57 |
| 2 | i2pn | 0 | 0 | 0 | 0 | 0 | 0 | 0% | 00:10:00 |
| TOTAL: 2 | 14414 | 4 | 14358 | 31 | 0 | 0 | 0% | 24:09:57 | |
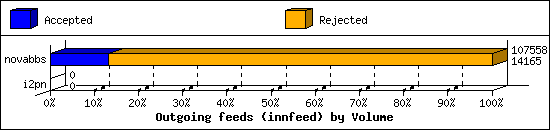
Outgoing Feeds (innfeed) by Volume:
| Server | AcceptVol | RejectVol | TotalVol | Volume/sec | Vol/Art | Elapsed | |
|---|---|---|---|---|---|---|---|
| 1 | novabbs | 13.8 KB | 91.2 KB | 105.0 KB | 0.0 KB/s | 3.0 KB | 23:59:57 |
| 2 | i2pn | 0.0 KB | 0.0 KB | 0.0 KB | 0.0 KB/s | 0 | 00:10:00 |
| TOTAL: 2 | 13.8 KB | 91.2 KB | 105.0 KB | 0.0 KB/s | 3.0 KB | 24:09:57 | |
NNRP readership statistics:
| System | Conn | Arts | Size | Groups | Post | Rej | Elapsed | |
|---|---|---|---|---|---|---|---|---|
| 1 | i2pn2.org | 32 | 0 | 0.0 KB | 0 | 0 | 0 | 00:00:12 |
| TOTAL: 1 | 32 | 0 | 0.0 KB | 0 | 0 | 0 | 00:00:12 | |
NNRP readership statistics (by domain):
| System | Conn | Arts | Size | Groups | Post | Rej | Elapsed | |
|---|---|---|---|---|---|---|---|---|
| 1 | *.org | 32 | 0 | 0.0 KB | 0 | 0 | 0 | 00:00:12 |
| TOTAL: 1 | 32 | 0 | 0.0 KB | 0 | 0 | 0 | 00:00:12 | |
NNRP auth users [Top 20]:
| User | Conn |
|---|---|
| i2pn2user | 32 |
| TOTAL: 1 | 32 |
NNRP total resource statistics [Top 20]:
| System | User(ms) | System(ms) | Idle(ms) | Elapsed |
|---|---|---|---|---|
| i2pn2.org | 1.640 | 0.216 | 2.989 | 00:00:12 |
| TOTAL: 1 | 1.640 | 0.216 | 2.989 | 00:00:12 |
