
Log entries by program:
| Program name | Lines | %Lines | Size | %Size |
|---|---|---|---|---|
| inn | 16659 | 89.6% | 1.4 MB | 84.8% |
| innd | 1062 | 5.7% | 153.3 KB | 9.3% |
| innfeed | 607 | 3.3% | 74.0 KB | 4.5% |
| nnrpd | 193 | 1.0% | 15.6 KB | 1.0% |
| nocem | 65 | 0.3% | 6.4 KB | 0.4% |
| controlchan | 1 | 0.0% | 0.1 KB | 0.0% |
| TOTAL: 6 | 18587 | 100.0% | 1.6 MB | 100.0% |
History cache:
| Reason | Count | %Count |
|---|---|---|
| Do not exist | 16233 | 98.5% |
| Negative hits | 198 | 1.2% |
| Positive hits | 39 | 0.2% |
| Cache misses | 13 | 0.1% |
| TOTAL: 4 | 16483 | 100.0% |
INND timer:
| Code region | Time | Pct | Invoked | Min(ms) | Avg(ms) | Max(ms) |
|---|---|---|---|---|---|---|
| article cancel | 00:00:00.038 | 0.0% | 102 | 0.000 | 0.373 | 2.000 |
| article cleanup | 00:00:00.095 | 0.0% | 16277 | 0.000 | 0.006 | 0.035 |
| article logging | 00:00:00.452 | 0.0% | 16571 | 0.000 | 0.027 | 0.073 |
| article parse | 00:00:00.238 | 0.0% | 18639 | 0.000 | 0.013 | 0.069 |
| article write | 00:00:06.387 | 0.0% | 16276 | 0.145 | 0.392 | 3.460 |
| artlog/artcncl | 00:00:00.002 | 0.0% | 101 | 0.000 | 0.020 | 0.250 |
| data move | 00:00:00.012 | 0.0% | 21165 | 0.000 | 0.001 | 0.010 |
| hisgrep/artcncl | 00:00:00.002 | 0.0% | 61 | 0.000 | 0.033 | 0.500 |
| hishave/artcncl | 00:00:00.001 | 0.0% | 102 | 0.000 | 0.010 | 0.100 |
| history grep | 00:00:00.000 | 0.0% | 0 | 0.000 | 0.000 | 0.000 |
| history lookup | 00:00:00.497 | 0.0% | 16502 | 0.000 | 0.030 | 0.290 |
| history sync | 00:00:00.011 | 0.0% | 418 | 0.000 | 0.026 | 0.500 |
| history write | 00:00:03.422 | 0.0% | 16277 | 0.000 | 0.210 | 4.123 |
| hiswrite/artcncl | 00:00:00.008 | 0.0% | 41 | 0.000 | 0.195 | 1.000 |
| idle | 24:00:30.850 | 100.0% | 19368 | 2301.077 | 4462.559 | 11775.137 |
| nntp read | 00:00:00.451 | 0.0% | 18966 | 0.000 | 0.024 | 0.069 |
| overview write | 00:00:02.575 | 0.0% | 16276 | 0.016 | 0.158 | 1.605 |
| perl filter | 00:00:22.879 | 0.0% | 16277 | 1.127 | 1.406 | 2.000 |
| python filter | 00:00:00.000 | 0.0% | 0 | 0.000 | 0.000 | 0.000 |
| site send | 00:00:00.592 | 0.0% | 16333 | 0.000 | 0.036 | 0.097 |
| TOTAL: 24:01:11.133 | 24:01:08.512 | 100.0% | - | - | - | - |
INNfeed timer:
| Code region | Time | Pct | Invoked | Min(ms) | Avg(ms) | Max(ms) |
|---|---|---|---|---|---|---|
| article new | 00:00:00.021 | 0.0% | 16243 | 0.000 | 0.001 | 0.018 |
| article prepare | 00:00:00.000 | 0.0% | 124 | 0.000 | 0.000 | 0.000 |
| article read | 00:00:00.031 | 0.0% | 31 | 0.000 | 1.000 | 29.000 |
| backlog stats | 00:00:00.013 | 0.0% | 53209 | 0.000 | 0.000 | 0.005 |
| callbacks | 00:00:00.000 | 0.0% | 0 | 0.000 | 0.000 | 0.000 |
| data read | 00:00:00.232 | 0.0% | 32556 | 0.000 | 0.007 | 0.030 |
| data write | 00:00:00.289 | 0.0% | 16317 | 0.000 | 0.018 | 0.085 |
| idle | 23:57:52.234 | 100.0% | 53209 | 987.092 | 1621.384 | 3338.072 |
| status file | 00:00:00.033 | 0.0% | 156 | 0.000 | 0.212 | 1.000 |
| TOTAL: 23:57:53.323 | 23:57:52.853 | 100.0% | - | - | - | - |
nnrpd timer:
| Code region | Time | Pct | Invoked | Min(ms) | Avg(ms) | Max(ms) |
|---|---|---|---|---|---|---|
| idle | 00:00:12.296 | 63.1% | 218 | 7.000 | 56.404 | 9688.000 |
| newnews | 00:00:00.000 | 0.0% | 0 | 0.000 | 0.000 | 0.000 |
| nntpwrite | 00:00:00.009 | 0.0% | 704 | 0.000 | 0.013 | 0.079 |
| readart | 00:00:00.163 | 0.8% | 16 | 4.600 | 10.188 | 24.000 |
| TOTAL: 00:00:19.484 | 00:00:12.468 | 64.0% | - | - | - | - |
Control commands to INND:
| Command | Number |
|---|---|
| L | 1 |
| flush | 3 |
| flushlogs | 2 |
| go | 2 |
| logmode | 2 |
| mode | 148 |
| name | 2 |
| pause | 2 |
| paused | 2 |
| reload | 2 |
| reserve | 2 |
| TOTAL: 11 | 168 |
Incoming Feeds (INN):
| Server | Connects | Offered | Taken | Refused | Reject | %Accpt | Elapsed | |
|---|---|---|---|---|---|---|---|---|
| 1 | i2pn | 6 | 16266 | 16265 | 0 | 1 | 99% | 24:32:43 |
| 2 | localhost | 31 | 0 | 0 | 0 | 0 | 0% | 00:00:00 |
| TOTAL: 2 | 37 | 16266 | 16265 | 0 | 1 | 99% | 24:32:43 | |
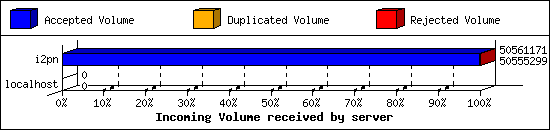
Incoming Volume (INN):
| Server | AcceptVol | DupVol | RejVol | TotalVol | %Acc | Vol/Art | |
|---|---|---|---|---|---|---|---|
| 1 | i2pn | 48.2 MB | 0.0 KB | 5.7 KB | 48.2 MB | 99% | 3.0 KB |
| 2 | localhost | 0.0 KB | 0.0 KB | 0.0 KB | 0.0 KB | 0% | 0 |
| TOTAL: 2 | 48.2 MB | 0.0 KB | 5.7 KB | 48.2 MB | 99% | 3.0 KB | |
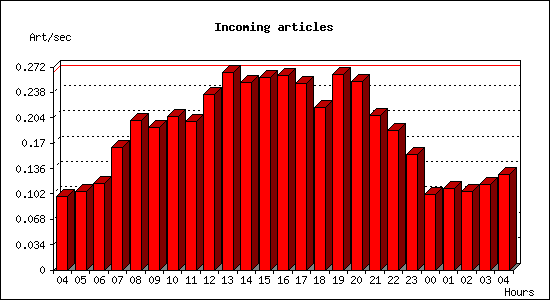
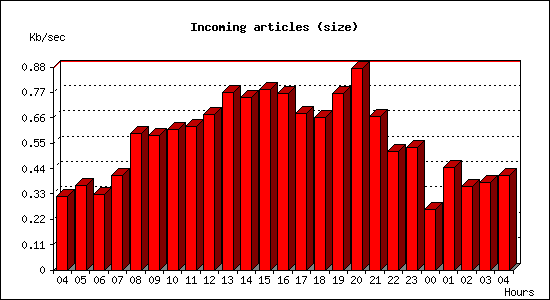
Incoming articles:
| Date | Articles | %Arts | Art/sec | Size | %Size | KB/sec |
|---|---|---|---|---|---|---|
| Jul 16 04:15:01 - 04:59:59 | 265 | 1.6% | 0.10 | 864.7 KB | 1.8% | 0.32 |
| Jul 16 05:00:00 - 05:59:59 | 379 | 2.3% | 0.11 | 1.3 MB | 2.7% | 0.37 |
| Jul 16 06:00:00 - 06:59:59 | 415 | 2.6% | 0.12 | 1.1 MB | 2.4% | 0.33 |
| Jul 16 07:00:00 - 07:59:59 | 590 | 3.6% | 0.16 | 1.4 MB | 3.0% | 0.41 |
| Jul 16 08:00:00 - 08:59:59 | 723 | 4.4% | 0.20 | 2.1 MB | 4.3% | 0.59 |
| Jul 16 09:00:00 - 09:59:59 | 689 | 4.2% | 0.19 | 2.1 MB | 4.3% | 0.58 |
| Jul 16 10:00:00 - 10:59:59 | 742 | 4.6% | 0.21 | 2.1 MB | 4.4% | 0.61 |
| Jul 16 11:00:00 - 11:59:59 | 716 | 4.4% | 0.20 | 2.2 MB | 4.5% | 0.62 |
| Jul 16 12:00:00 - 12:59:59 | 848 | 5.2% | 0.24 | 2.4 MB | 4.9% | 0.67 |
| Jul 16 13:00:00 - 13:59:59 | 953 | 5.9% | 0.26 | 2.7 MB | 5.6% | 0.77 |
| Jul 16 14:00:00 - 14:59:59 | 906 | 5.6% | 0.25 | 2.6 MB | 5.5% | 0.75 |
| Jul 16 15:00:00 - 15:59:59 | 927 | 5.7% | 0.26 | 2.8 MB | 5.7% | 0.78 |
| Jul 16 16:00:00 - 16:59:59 | 938 | 5.8% | 0.26 | 2.7 MB | 5.6% | 0.76 |
| Jul 16 17:00:00 - 17:59:59 | 898 | 5.5% | 0.25 | 2.4 MB | 4.9% | 0.68 |
| Jul 16 18:00:00 - 18:59:59 | 786 | 4.8% | 0.22 | 2.3 MB | 4.8% | 0.66 |
| Jul 16 19:00:00 - 19:59:59 | 942 | 5.8% | 0.26 | 2.7 MB | 5.6% | 0.77 |
| Jul 16 20:00:00 - 20:59:59 | 907 | 5.6% | 0.25 | 3.1 MB | 6.4% | 0.87 |
| Jul 16 21:00:00 - 21:59:59 | 746 | 4.6% | 0.21 | 2.3 MB | 4.8% | 0.66 |
| Jul 16 22:00:00 - 22:59:59 | 671 | 4.1% | 0.19 | 1.8 MB | 3.7% | 0.51 |
| Jul 16 23:00:00 - 23:59:59 | 557 | 3.4% | 0.15 | 1.9 MB | 3.9% | 0.53 |
| Jul 17 00:00:00 - 00:59:59 | 364 | 2.2% | 0.10 | 942.4 KB | 1.9% | 0.26 |
| Jul 17 01:00:00 - 01:59:59 | 393 | 2.4% | 0.11 | 1.6 MB | 3.2% | 0.44 |
| Jul 17 02:00:00 - 02:59:59 | 381 | 2.3% | 0.11 | 1.3 MB | 2.6% | 0.36 |
| Jul 17 03:00:00 - 03:59:59 | 414 | 2.5% | 0.12 | 1.3 MB | 2.8% | 0.38 |
| Jul 17 04:00:00 - 04:15:01 | 115 | 0.7% | 0.13 | 370.4 KB | 0.8% | 0.41 |
| TOTAL: 24:00:00 | 16265 | 100.0% | 0.19 | 48.2 MB | 100.0% | 0.57 |
Sites sending bad articles:
| Server | Total | Group | Dist | Duplic | Unapp | TooOld | Site | Line | Other | |
|---|---|---|---|---|---|---|---|---|---|---|
| 1 | i2pn | 294 | 1 | 0 | 0 | 0 | 0 | 0 | 0 | 293 |
| TOTAL: 1 | 294 | 1 | 0 | 0 | 0 | 0 | 0 | 0 | 293 | |
Unwanted newsgroups [Top 20]:
| Newsgroup | Count |
|---|---|
| 24hoursupport.helpdesk | 1 |
| TOTAL: 1 | 1 |
NoCeM on Spool:
| Id | Good | Bad | Unique | Total |
|---|---|---|---|---|
| bleachbot@httrack.com | 54 | 0 | 59 | 59 |
| TOTAL: 1 | 54 | 5 | 59 | 59 |
Miscellaneous innd statistics [Top 10]:
| Event | Server | Number |
|---|---|---|
| Including strange strings | ||
| i2pn | 293 | |
| TOTAL: 1 | 293 | |
| TOTAL: 1 | 293 | |
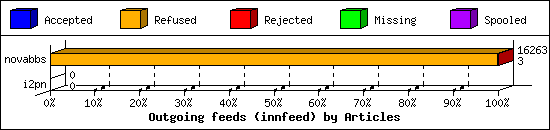
Outgoing Feeds (innfeed) by Articles:
| Server | Offered | Taken | Refused | Reject | Miss | Spool | %Took | Elapsed | |
|---|---|---|---|---|---|---|---|---|---|
| 1 | novabbs | 16296 | 3 | 16232 | 28 | 0 | 0 | 0% | 23:59:49 |
| 2 | i2pn | 0 | 0 | 0 | 0 | 0 | 0 | 0% | 00:10:00 |
| TOTAL: 2 | 16296 | 3 | 16232 | 28 | 0 | 0 | 0% | 24:09:49 | |
Outgoing Feeds (innfeed) by Volume:
| Server | AcceptVol | RejectVol | TotalVol | Volume/sec | Vol/Art | Elapsed | |
|---|---|---|---|---|---|---|---|
| 1 | novabbs | 5.8 KB | 81.0 KB | 86.8 KB | 0.0 KB/s | 2.8 KB | 23:59:49 |
| 2 | i2pn | 0.0 KB | 0.0 KB | 0.0 KB | 0.0 KB/s | 0 | 00:10:00 |
| TOTAL: 2 | 5.8 KB | 81.0 KB | 86.8 KB | 0.0 KB/s | 2.8 KB | 24:09:49 | |

NNRP readership statistics:
| System | Conn | Arts | Size | Groups | Post | Rej | Elapsed | |
|---|---|---|---|---|---|---|---|---|
| 1 | i2pn2.org | 33 | 16 | 20.0 KB | 16 | 0 | 0 | 00:00:09 |
| TOTAL: 1 | 33 | 16 | 20.0 KB | 16 | 0 | 0 | 00:00:19 | |
NNRP readership statistics (by domain):
| System | Conn | Arts | Size | Groups | Post | Rej | Elapsed | |
|---|---|---|---|---|---|---|---|---|
| 1 | *.org | 33 | 16 | 20.0 KB | 16 | 0 | 0 | 00:00:09 |
| 2 | unresolved | 1 | 0 | 0.0 KB | 0 | 0 | 0 | 00:00:09 |
| TOTAL: 2 | 34 | 16 | 20.0 KB | 16 | 0 | 0 | 00:00:19 | |
NNRP auth users [Top 20]:
| User | Conn |
|---|---|
| i2pn2user | 33 |
| TOTAL: 1 | 33 |
NNRP total resource statistics [Top 20]:
| System | User(ms) | System(ms) | Idle(ms) | Elapsed |
|---|---|---|---|---|
| 162.243.142.228 | 0.048 | 0.000 | 0.000 | 00:00:09 |
| i2pn2.org | 1.604 | 0.212 | 3.088 | 00:00:09 |
| TOTAL: 2 | 1.652 | 0.212 | 3.088 | 00:00:19 |
Curious NNRP server explorers [Top 20]:
| System | Conn |
|---|---|
| 162.243.142.228 | 1 |
| TOTAL: 1 | 1 |
Newsgroup request counts (by category):
| Category | Count | Pct | |
|---|---|---|---|
| 1 | rocksolid | 16 | 100.0% |
| TOTAL: 1 | 16 | 100.0% | |
Newsgroup request counts (by newsgroup) [Top 100]:
| Newsgroup | Count | |
|---|---|---|
| 1 | rocksolid.shared.rocksolid | 14 |
| 2 | rocksolid.shared.news | 2 |
| TOTAL: 2 | 16 | |
