Log entries by program:
| Program name | Lines | %Lines | Size | %Size |
|---|---|---|---|---|
| inn | 16001 | 85.4% | 1.3 MB | 81.2% |
| nnrpd | 1055 | 5.6% | 83.6 KB | 5.1% |
| innd | 1020 | 5.4% | 149.0 KB | 9.0% |
| innfeed | 604 | 3.2% | 72.3 KB | 4.4% |
| nocem | 55 | 0.3% | 5.3 KB | 0.3% |
| controlchan | 1 | 0.0% | 0.1 KB | 0.0% |
| TOTAL: 6 | 18736 | 100.0% | 1.6 MB | 100.0% |
History cache:
| Reason | Count | %Count |
|---|---|---|
| Do not exist | 15576 | 98.7% |
| Negative hits | 137 | 0.9% |
| Positive hits | 35 | 0.2% |
| Cache misses | 32 | 0.2% |
| TOTAL: 4 | 15780 | 100.0% |
INND timer:
| Code region | Time | Pct | Invoked | Min(ms) | Avg(ms) | Max(ms) |
|---|---|---|---|---|---|---|
| article cancel | 00:00:00.087 | 0.0% | 105 | 0.000 | 0.829 | 10.500 |
| article cleanup | 00:00:00.099 | 0.0% | 15607 | 0.000 | 0.006 | 0.043 |
| article logging | 00:00:00.444 | 0.0% | 15917 | 0.000 | 0.028 | 0.078 |
| article parse | 00:00:00.230 | 0.0% | 17914 | 0.000 | 0.013 | 0.050 |
| article write | 00:00:07.905 | 0.0% | 15607 | 0.099 | 0.507 | 4.939 |
| artlog/artcncl | 00:00:00.005 | 0.0% | 105 | 0.000 | 0.048 | 1.000 |
| data move | 00:00:00.016 | 0.0% | 20154 | 0.000 | 0.001 | 0.014 |
| hisgrep/artcncl | 00:00:00.006 | 0.0% | 75 | 0.000 | 0.080 | 0.500 |
| hishave/artcncl | 00:00:00.010 | 0.0% | 105 | 0.000 | 0.095 | 1.000 |
| history grep | 00:00:00.000 | 0.0% | 0 | 0.000 | 0.000 | 0.000 |
| history lookup | 00:00:04.094 | 0.0% | 15805 | 0.000 | 0.259 | 3.817 |
| history sync | 00:00:00.013 | 0.0% | 410 | 0.000 | 0.032 | 0.500 |
| history write | 00:00:03.449 | 0.0% | 15607 | 0.000 | 0.221 | 1.439 |
| hiswrite/artcncl | 00:00:00.004 | 0.0% | 30 | 0.000 | 0.133 | 0.400 |
| idle | 24:00:23.771 | 99.9% | 18729 | 2652.726 | 4614.436 | 12245.408 |
| nntp read | 00:00:00.494 | 0.0% | 18185 | 0.000 | 0.027 | 0.073 |
| overview write | 00:00:03.404 | 0.0% | 15607 | 0.053 | 0.218 | 1.557 |
| perl filter | 00:00:21.761 | 0.0% | 15607 | 1.063 | 1.394 | 2.600 |
| python filter | 00:00:00.000 | 0.0% | 0 | 0.000 | 0.000 | 0.000 |
| site send | 00:00:00.592 | 0.0% | 15650 | 0.000 | 0.038 | 0.123 |
| TOTAL: 24:01:09.225 | 24:01:06.384 | 100.0% | - | - | - | - |
INNfeed timer:
| Code region | Time | Pct | Invoked | Min(ms) | Avg(ms) | Max(ms) |
|---|---|---|---|---|---|---|
| article new | 00:00:00.030 | 0.0% | 15516 | 0.000 | 0.002 | 0.021 |
| article prepare | 00:00:00.000 | 0.0% | 224 | 0.000 | 0.000 | 0.000 |
| article read | 00:00:00.025 | 0.0% | 56 | 0.000 | 0.446 | 10.500 |
| backlog stats | 00:00:00.015 | 0.0% | 50998 | 0.000 | 0.000 | 0.005 |
| callbacks | 00:00:00.000 | 0.0% | 0 | 0.000 | 0.000 | 0.000 |
| data read | 00:00:00.224 | 0.0% | 31088 | 0.000 | 0.007 | 0.033 |
| data write | 00:00:00.246 | 0.0% | 15602 | 0.000 | 0.016 | 0.049 |
| idle | 23:49:57.914 | 100.0% | 50998 | 1070.130 | 1682.378 | 3978.935 |
| status file | 00:00:00.080 | 0.0% | 155 | 0.000 | 0.516 | 3.900 |
| TOTAL: 23:49:59.018 | 23:49:58.534 | 100.0% | - | - | - | - |
nnrpd timer:
| Code region | Time | Pct | Invoked | Min(ms) | Avg(ms) | Max(ms) |
|---|---|---|---|---|---|---|
| idle | 00:00:46.252 | 63.2% | 2044 | 7.000 | 22.628 | 1326.000 |
| newnews | 00:00:00.000 | 0.0% | 0 | 0.000 | 0.000 | 0.000 |
| nntpwrite | 00:00:00.070 | 0.1% | 6883 | 0.000 | 0.010 | 0.095 |
| readart | 00:00:00.231 | 0.3% | 25 | 4.143 | 9.240 | 35.000 |
| TOTAL: 00:01:13.197 | 00:00:46.553 | 63.6% | - | - | - | - |
Control commands to INND:
| Command | Number |
|---|---|
| L | 1 |
| flush | 3 |
| flushlogs | 2 |
| go | 2 |
| logmode | 2 |
| mode | 148 |
| name | 2 |
| pause | 2 |
| paused | 2 |
| reload | 2 |
| reserve | 2 |
| TOTAL: 11 | 168 |
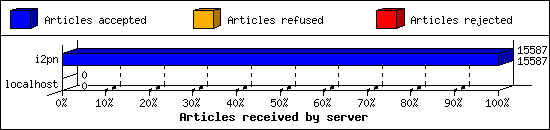
Incoming Feeds (INN):
| Server | Connects | Offered | Taken | Refused | Reject | %Accpt | Elapsed | |
|---|---|---|---|---|---|---|---|---|
| 1 | i2pn | 5 | 15587 | 15587 | 0 | 0 | 100% | 24:32:11 |
| 2 | localhost | 30 | 0 | 0 | 0 | 0 | 0% | 00:00:00 |
| TOTAL: 2 | 35 | 15587 | 15587 | 0 | 0 | 100% | 24:32:11 | |
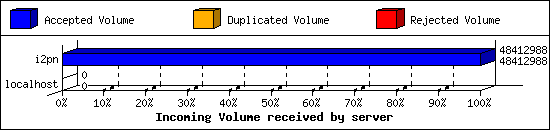
Incoming Volume (INN):
| Server | AcceptVol | DupVol | RejVol | TotalVol | %Acc | Vol/Art | |
|---|---|---|---|---|---|---|---|
| 1 | i2pn | 46.2 MB | 0.0 KB | 0.0 KB | 46.2 MB | 100% | 3.0 KB |
| 2 | localhost | 0.0 KB | 0.0 KB | 0.0 KB | 0.0 KB | 0% | 0 |
| TOTAL: 2 | 46.2 MB | 0.0 KB | 0.0 KB | 46.2 MB | 100% | 3.0 KB | |
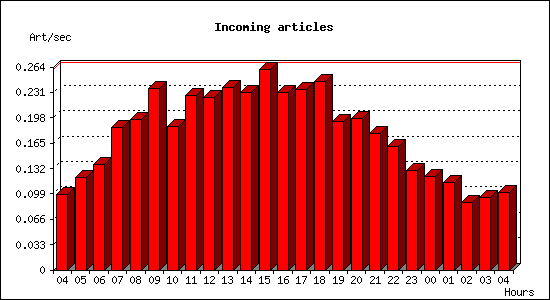
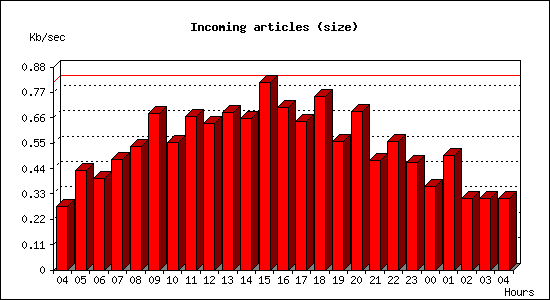
Incoming articles:
| Date | Articles | %Arts | Art/sec | Size | %Size | KB/sec |
|---|---|---|---|---|---|---|
| Jul 17 04:15:01 - 04:59:59 | 265 | 1.7% | 0.10 | 746.4 KB | 1.6% | 0.28 |
| Jul 17 05:00:00 - 05:59:59 | 432 | 2.8% | 0.12 | 1.5 MB | 3.3% | 0.43 |
| Jul 17 06:00:00 - 06:59:59 | 494 | 3.2% | 0.14 | 1.4 MB | 3.0% | 0.40 |
| Jul 17 07:00:00 - 07:59:59 | 668 | 4.3% | 0.19 | 1.7 MB | 3.6% | 0.48 |
| Jul 17 08:00:00 - 08:59:59 | 706 | 4.5% | 0.20 | 1.9 MB | 4.1% | 0.53 |
| Jul 17 09:00:00 - 09:59:59 | 852 | 5.5% | 0.24 | 2.4 MB | 5.2% | 0.68 |
| Jul 17 10:00:00 - 10:59:59 | 670 | 4.3% | 0.19 | 1.9 MB | 4.2% | 0.55 |
| Jul 17 11:00:00 - 11:59:59 | 818 | 5.2% | 0.23 | 2.3 MB | 5.1% | 0.66 |
| Jul 17 12:00:00 - 12:59:59 | 807 | 5.2% | 0.22 | 2.2 MB | 4.8% | 0.64 |
| Jul 17 13:00:00 - 13:59:59 | 854 | 5.5% | 0.24 | 2.4 MB | 5.2% | 0.68 |
| Jul 17 14:00:00 - 14:59:59 | 833 | 5.3% | 0.23 | 2.3 MB | 5.0% | 0.66 |
| Jul 17 15:00:00 - 15:59:59 | 940 | 6.0% | 0.26 | 2.9 MB | 6.2% | 0.81 |
| Jul 17 16:00:00 - 16:59:59 | 832 | 5.3% | 0.23 | 2.5 MB | 5.4% | 0.70 |
| Jul 17 17:00:00 - 17:59:59 | 847 | 5.4% | 0.24 | 2.3 MB | 4.9% | 0.65 |
| Jul 17 18:00:00 - 18:59:59 | 883 | 5.7% | 0.25 | 2.6 MB | 5.7% | 0.75 |
| Jul 17 19:00:00 - 19:59:59 | 697 | 4.5% | 0.19 | 2.0 MB | 4.3% | 0.56 |
| Jul 17 20:00:00 - 20:59:59 | 711 | 4.6% | 0.20 | 2.4 MB | 5.2% | 0.69 |
| Jul 17 21:00:00 - 21:59:59 | 639 | 4.1% | 0.18 | 1.7 MB | 3.6% | 0.48 |
| Jul 17 22:00:00 - 22:59:59 | 579 | 3.7% | 0.16 | 2.0 MB | 4.2% | 0.56 |
| Jul 17 23:00:00 - 23:59:59 | 464 | 3.0% | 0.13 | 1.6 MB | 3.6% | 0.47 |
| Jul 18 00:00:00 - 00:59:59 | 437 | 2.8% | 0.12 | 1.3 MB | 2.8% | 0.36 |
| Jul 18 01:00:00 - 01:59:59 | 410 | 2.6% | 0.11 | 1.7 MB | 3.8% | 0.50 |
| Jul 18 02:00:00 - 02:59:59 | 318 | 2.0% | 0.09 | 1.1 MB | 2.4% | 0.31 |
| Jul 18 03:00:00 - 03:59:59 | 340 | 2.2% | 0.09 | 1.1 MB | 2.4% | 0.31 |
| Jul 18 04:00:00 - 04:15:01 | 91 | 0.6% | 0.10 | 278.5 KB | 0.6% | 0.31 |
| TOTAL: 24:00:00 | 15587 | 100.0% | 0.18 | 46.2 MB | 100.0% | 0.55 |
Sites sending bad articles:
| Server | Total | Group | Dist | Duplic | Unapp | TooOld | Site | Line | Other | |
|---|---|---|---|---|---|---|---|---|---|---|
| 1 | i2pn | 310 | 0 | 0 | 0 | 0 | 0 | 0 | 0 | 310 |
| TOTAL: 1 | 310 | 0 | 0 | 0 | 0 | 0 | 0 | 0 | 310 | |
NoCeM on Spool:
| Id | Good | Bad | Unique | Total |
|---|---|---|---|---|
| bleachbot@httrack.com | 31 | 0 | 37 | 37 |
| TOTAL: 1 | 31 | 19 | 37 | 37 |
Miscellaneous innd statistics [Top 10]:
| Event | Server | Number |
|---|---|---|
| Including strange strings | ||
| i2pn | 310 | |
| TOTAL: 1 | 310 | |
| TOTAL: 1 | 310 | |
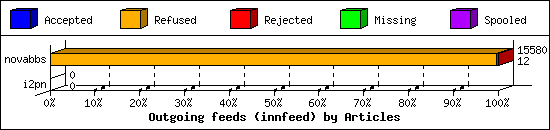
Outgoing Feeds (innfeed) by Articles:
| Server | Offered | Taken | Refused | Reject | Miss | Spool | %Took | Elapsed | |
|---|---|---|---|---|---|---|---|---|---|
| 1 | novabbs | 15608 | 12 | 15524 | 44 | 0 | 0 | 0% | 23:59:50 |
| 2 | i2pn | 0 | 0 | 0 | 0 | 0 | 0 | 0% | 00:10:00 |
| TOTAL: 2 | 15608 | 12 | 15524 | 44 | 0 | 0 | 0% | 24:09:50 | |
Outgoing Feeds (innfeed) by Volume:
| Server | AcceptVol | RejectVol | TotalVol | Volume/sec | Vol/Art | Elapsed | |
|---|---|---|---|---|---|---|---|
| 1 | novabbs | 40.8 KB | 194.7 KB | 235.5 KB | 0.0 KB/s | 4.2 KB | 23:59:50 |
| 2 | i2pn | 0.0 KB | 0.0 KB | 0.0 KB | 0.0 KB/s | 0 | 00:10:00 |
| TOTAL: 2 | 40.8 KB | 194.7 KB | 235.5 KB | 0.0 KB/s | 4.2 KB | 24:09:50 | |

NNRP readership statistics:
| System | Conn | Arts | Size | Groups | Post | Rej | Elapsed | |
|---|---|---|---|---|---|---|---|---|
| 1 | i2pn2.org | 107 | 25 | 37.1 KB | 25 | 0 | 0 | 00:01:09 |
| TOTAL: 1 | 107 | 25 | 37.1 KB | 25 | 0 | 0 | 00:01:12 | |
NNRP readership statistics (by domain):
| System | Conn | Arts | Size | Groups | Post | Rej | Elapsed | |
|---|---|---|---|---|---|---|---|---|
| 1 | *.org | 107 | 25 | 37.1 KB | 25 | 0 | 0 | 00:01:09 |
| 2 | unresolved | 2 | 0 | 0.0 KB | 0 | 0 | 0 | 00:00:01 |
| 3 | *.security.ipip.net | 1 | 0 | 0.0 KB | 0 | 0 | 0 | 00:00:00 |
| 4 | *.census.shodan.io | 1 | 0 | 0.0 KB | 0 | 0 | 0 | 00:00:00 |
| TOTAL: 4 | 111 | 25 | 37.1 KB | 25 | 0 | 0 | 00:01:12 | |
NNRP auth users [Top 20]:
| User | Conn |
|---|---|
| i2pn2user | 107 |
| TOTAL: 1 | 107 |
NNRP total resource statistics [Top 20]:
| System | User(ms) | System(ms) | Idle(ms) | Elapsed |
|---|---|---|---|---|
| i2pn2.org | 8.328 | 0.904 | 10.078 | 00:01:09 |
| 117.50.6.160 | 0.088 | 0.012 | 0.000 | 00:00:01 |
| mason.census.shodan.io | 0.044 | 0.004 | 0.000 | 00:00:00 |
| scan-141.security.ipip.net | 0.048 | 0.000 | 0.000 | 00:00:00 |
| TOTAL: 4 | 8.508 | 0.920 | 10.078 | 00:01:12 |
Curious NNRP server explorers [Top 20]:
| System | Conn |
|---|---|
| 117.50.6.160 | 2 |
| mason.census.shodan.io | 1 |
| scan-141.security.ipip.net | 1 |
| TOTAL: 3 | 4 |
NNRP unrecognized commands (by host):
| System | Conn |
|---|---|
| scan-141.security.ipip.net | 4 |
| TOTAL: 1 | 4 |
NNRP unrecognized commands (by command):
| Command | Count |
|---|---|
| GET / HTTP/1.1 | 1 |
| Host: 157.230.63.40:119 | 1 |
| User-Agent: HTTP Banner Detection (https... | 1 |
| Connection: close | 1 |
| TOTAL: 4 | 4 |
Newsgroup request counts (by category):
| Category | Count | Pct | |
|---|---|---|---|
| 1 | rocksolid | 25 | 100.0% |
| TOTAL: 1 | 25 | 100.0% | |
Newsgroup request counts (by newsgroup) [Top 100]:
| Newsgroup | Count | |
|---|---|---|
| 1 | rocksolid.shared.i2p | 18 |
| 2 | rocksolid.shared.test | 6 |
| 3 | rocksolid.shared.encryption | 1 |
| TOTAL: 3 | 25 | |
