
Log entries by program:
| Program name | Lines | %Lines | Size | %Size |
|---|---|---|---|---|
| inn | 14242 | 87.0% | 1.2 MB | 82.0% |
| innd | 991 | 6.1% | 150.6 KB | 10.3% |
| innfeed | 601 | 3.7% | 67.7 KB | 4.6% |
| nnrpd | 474 | 2.9% | 37.8 KB | 2.6% |
| nocem | 61 | 0.4% | 5.7 KB | 0.4% |
| controlchan | 1 | 0.0% | 0.1 KB | 0.0% |
| TOTAL: 6 | 16370 | 100.0% | 1.4 MB | 100.0% |
History cache:
| Reason | Count | %Count |
|---|---|---|
| Do not exist | 13912 | 98.7% |
| Negative hits | 133 | 0.9% |
| Positive hits | 35 | 0.2% |
| Cache misses | 17 | 0.1% |
| TOTAL: 4 | 14097 | 100.0% |
INND timer:
| Code region | Time | Pct | Invoked | Min(ms) | Avg(ms) | Max(ms) |
|---|---|---|---|---|---|---|
| article cancel | 00:00:00.067 | 0.0% | 105 | 0.000 | 0.638 | 11.000 |
| article cleanup | 00:00:00.076 | 0.0% | 13894 | 0.000 | 0.005 | 0.034 |
| article logging | 00:00:00.411 | 0.0% | 14142 | 0.000 | 0.029 | 0.100 |
| article parse | 00:00:00.220 | 0.0% | 16166 | 0.000 | 0.014 | 0.067 |
| article write | 00:00:05.449 | 0.0% | 13893 | 0.208 | 0.392 | 1.286 |
| artlog/artcncl | 00:00:00.000 | 0.0% | 105 | 0.000 | 0.000 | 0.000 |
| data move | 00:00:00.012 | 0.0% | 18380 | 0.000 | 0.001 | 0.014 |
| hisgrep/artcncl | 00:00:00.008 | 0.0% | 57 | 0.000 | 0.140 | 1.000 |
| hishave/artcncl | 00:00:00.005 | 0.0% | 105 | 0.000 | 0.048 | 1.000 |
| history grep | 00:00:00.000 | 0.0% | 0 | 0.000 | 0.000 | 0.000 |
| history lookup | 00:00:01.073 | 0.0% | 14046 | 0.000 | 0.076 | 0.844 |
| history sync | 00:00:00.015 | 0.0% | 416 | 0.000 | 0.036 | 0.500 |
| history write | 00:00:02.382 | 0.0% | 13894 | 0.000 | 0.171 | 0.562 |
| hiswrite/artcncl | 00:00:00.031 | 0.0% | 48 | 0.000 | 0.646 | 11.000 |
| idle | 24:00:31.942 | 100.0% | 16897 | 2576.785 | 5115.224 | 17157.571 |
| nntp read | 00:00:00.362 | 0.0% | 16407 | 0.000 | 0.022 | 0.061 |
| overview write | 00:00:03.071 | 0.0% | 13893 | 0.048 | 0.221 | 3.123 |
| perl filter | 00:00:19.827 | 0.0% | 13894 | 1.159 | 1.427 | 2.095 |
| python filter | 00:00:00.000 | 0.0% | 0 | 0.000 | 0.000 | 0.000 |
| site send | 00:00:00.632 | 0.0% | 13947 | 0.000 | 0.045 | 0.121 |
| TOTAL: 24:01:08.043 | 24:01:05.583 | 100.0% | - | - | - | - |
INNfeed timer:
| Code region | Time | Pct | Invoked | Min(ms) | Avg(ms) | Max(ms) |
|---|---|---|---|---|---|---|
| article new | 00:00:00.016 | 0.0% | 13886 | 0.000 | 0.001 | 0.028 |
| article prepare | 00:00:00.000 | 0.0% | 88 | 0.000 | 0.000 | 0.000 |
| article read | 00:00:00.025 | 0.0% | 22 | 0.000 | 1.136 | 7.333 |
| backlog stats | 00:00:00.010 | 0.0% | 46083 | 0.000 | 0.000 | 0.005 |
| callbacks | 00:00:00.000 | 0.0% | 0 | 0.000 | 0.000 | 0.000 |
| data read | 00:00:00.210 | 0.0% | 27813 | 0.000 | 0.008 | 0.035 |
| data write | 00:00:00.256 | 0.0% | 13934 | 0.000 | 0.018 | 0.069 |
| idle | 23:59:56.103 | 100.0% | 46083 | 1112.615 | 1874.793 | 4728.481 |
| status file | 00:00:00.059 | 0.0% | 152 | 0.000 | 0.388 | 1.000 |
| TOTAL: 23:59:57.070 | 23:59:56.679 | 100.0% | - | - | - | - |
nnrpd timer:
| Code region | Time | Pct | Invoked | Min(ms) | Avg(ms) | Max(ms) |
|---|---|---|---|---|---|---|
| idle | 00:00:18.513 | 52.2% | 667 | 6.833 | 27.756 | 9832.000 |
| newnews | 00:00:00.000 | 0.0% | 0 | 0.000 | 0.000 | 0.000 |
| nntpwrite | 00:00:00.032 | 0.1% | 2302 | 0.000 | 0.014 | 0.095 |
| readart | 00:00:00.025 | 0.1% | 1 | 25.000 | 25.000 | 25.000 |
| TOTAL: 00:00:35.442 | 00:00:18.570 | 52.4% | - | - | - | - |
Control commands to INND:
| Command | Number |
|---|---|
| L | 1 |
| flush | 3 |
| flushlogs | 2 |
| go | 2 |
| logmode | 2 |
| mode | 149 |
| name | 2 |
| pause | 2 |
| paused | 2 |
| reload | 4 |
| reserve | 2 |
| TOTAL: 11 | 171 |
Incoming Feeds (INN):
| Server | Connects | Offered | Taken | Refused | Reject | %Accpt | Elapsed | |
|---|---|---|---|---|---|---|---|---|
| 1 | i2pn | 4 | 13802 | 13801 | 0 | 1 | 99% | 24:07:44 |
| 2 | localhost | 28 | 0 | 0 | 0 | 0 | 0% | 00:00:00 |
| TOTAL: 2 | 32 | 13802 | 13801 | 0 | 1 | 99% | 24:07:44 | |
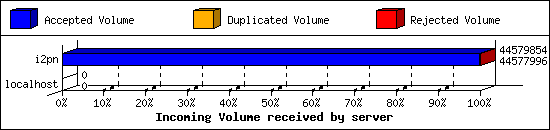
Incoming Volume (INN):
| Server | AcceptVol | DupVol | RejVol | TotalVol | %Acc | Vol/Art | |
|---|---|---|---|---|---|---|---|
| 1 | i2pn | 42.5 MB | 0.0 KB | 1.8 KB | 42.5 MB | 99% | 3.2 KB |
| 2 | localhost | 0.0 KB | 0.0 KB | 0.0 KB | 0.0 KB | 0% | 0 |
| TOTAL: 2 | 42.5 MB | 0.0 KB | 1.8 KB | 42.5 MB | 99% | 3.2 KB | |
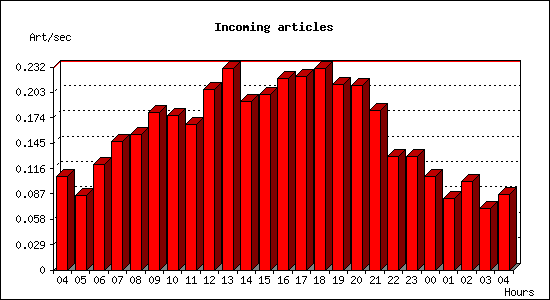
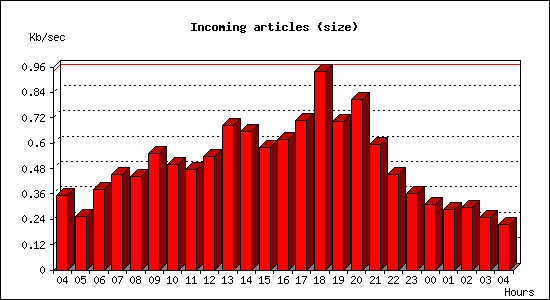
Incoming articles:
| Date | Articles | %Arts | Art/sec | Size | %Size | KB/sec |
|---|---|---|---|---|---|---|
| Jul 20 04:15:01 - 04:59:59 | 289 | 2.1% | 0.11 | 949.1 KB | 2.2% | 0.35 |
| Jul 20 05:00:00 - 05:59:59 | 307 | 2.2% | 0.09 | 911.5 KB | 2.1% | 0.25 |
| Jul 20 06:00:00 - 06:59:59 | 435 | 3.1% | 0.12 | 1.3 MB | 3.1% | 0.38 |
| Jul 20 07:00:00 - 07:59:59 | 528 | 3.8% | 0.15 | 1.6 MB | 3.7% | 0.45 |
| Jul 20 08:00:00 - 08:59:59 | 556 | 4.0% | 0.15 | 1.6 MB | 3.6% | 0.44 |
| Jul 20 09:00:00 - 09:59:59 | 646 | 4.7% | 0.18 | 1.9 MB | 4.5% | 0.55 |
| Jul 20 10:00:00 - 10:59:59 | 637 | 4.6% | 0.18 | 1.8 MB | 4.1% | 0.50 |
| Jul 20 11:00:00 - 11:59:59 | 598 | 4.3% | 0.17 | 1.7 MB | 3.9% | 0.48 |
| Jul 20 12:00:00 - 12:59:59 | 743 | 5.3% | 0.21 | 1.9 MB | 4.4% | 0.54 |
| Jul 20 13:00:00 - 13:59:59 | 831 | 6.0% | 0.23 | 2.4 MB | 5.6% | 0.68 |
| Jul 20 14:00:00 - 14:59:59 | 693 | 5.0% | 0.19 | 2.3 MB | 5.4% | 0.66 |
| Jul 20 15:00:00 - 15:59:59 | 721 | 5.2% | 0.20 | 2.0 MB | 4.8% | 0.58 |
| Jul 20 16:00:00 - 16:59:59 | 787 | 5.7% | 0.22 | 2.2 MB | 5.1% | 0.62 |
| Jul 20 17:00:00 - 17:59:59 | 797 | 5.7% | 0.22 | 2.5 MB | 5.8% | 0.71 |
| Jul 20 18:00:00 - 18:59:59 | 831 | 6.0% | 0.23 | 3.3 MB | 7.7% | 0.94 |
| Jul 20 19:00:00 - 19:59:59 | 765 | 5.5% | 0.21 | 2.5 MB | 5.8% | 0.70 |
| Jul 20 20:00:00 - 20:59:59 | 761 | 5.5% | 0.21 | 2.8 MB | 6.6% | 0.81 |
| Jul 20 21:00:00 - 21:59:59 | 658 | 4.7% | 0.18 | 2.1 MB | 4.9% | 0.59 |
| Jul 20 22:00:00 - 22:59:59 | 468 | 3.4% | 0.13 | 1.6 MB | 3.7% | 0.45 |
| Jul 20 23:00:00 - 23:59:59 | 465 | 3.3% | 0.13 | 1.3 MB | 3.0% | 0.36 |
| Jul 21 00:00:00 - 00:59:59 | 383 | 2.8% | 0.11 | 1.1 MB | 2.5% | 0.31 |
| Jul 21 01:00:00 - 01:59:59 | 293 | 2.1% | 0.08 | 1.0 MB | 2.4% | 0.29 |
| Jul 21 02:00:00 - 02:59:59 | 365 | 2.6% | 0.10 | 1.0 MB | 2.4% | 0.30 |
| Jul 21 03:00:00 - 03:59:59 | 255 | 1.8% | 0.07 | 898.8 KB | 2.1% | 0.25 |
| Jul 21 04:00:00 - 04:15:01 | 78 | 0.6% | 0.09 | 194.4 KB | 0.4% | 0.22 |
| TOTAL: 24:00:00 | 13890 | 100.0% | 0.16 | 42.7 MB | 100.0% | 0.51 |
Sites sending bad articles:
| Server | Total | Group | Dist | Duplic | Unapp | TooOld | Site | Line | Other | |
|---|---|---|---|---|---|---|---|---|---|---|
| 1 | i2pn | 248 | 1 | 0 | 0 | 0 | 0 | 0 | 0 | 247 |
| TOTAL: 1 | 248 | 1 | 0 | 0 | 0 | 0 | 0 | 0 | 247 | |
Unwanted newsgroups [Top 20]:
| Newsgroup | Count |
|---|---|
| 24hoursupport.helpdesk | 1 |
| TOTAL: 1 | 1 |
NoCeM on Spool:
| Id | Good | Bad | Unique | Total |
|---|---|---|---|---|
| bleachbot@httrack.com | 40 | 0 | 56 | 56 |
| TOTAL: 1 | 40 | 18 | 56 | 56 |
Miscellaneous innd statistics [Top 10]:
| Event | Server | Number |
|---|---|---|
| Including strange strings | ||
| i2pn | 247 | |
| TOTAL: 1 | 247 | |
| TOTAL: 1 | 247 | |
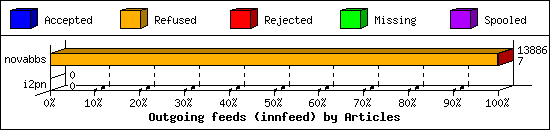
Outgoing Feeds (innfeed) by Articles:
| Server | Offered | Taken | Refused | Reject | Miss | Spool | %Took | Elapsed | |
|---|---|---|---|---|---|---|---|---|---|
| 1 | novabbs | 13906 | 7 | 13864 | 15 | 0 | 0 | 0% | 23:59:57 |
| 2 | i2pn | 0 | 0 | 0 | 0 | 0 | 0 | 0% | 00:10:00 |
| TOTAL: 2 | 13906 | 7 | 13864 | 15 | 0 | 0 | 0% | 24:09:57 | |
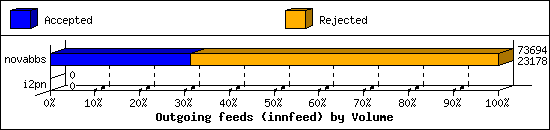
Outgoing Feeds (innfeed) by Volume:
| Server | AcceptVol | RejectVol | TotalVol | Volume/sec | Vol/Art | Elapsed | |
|---|---|---|---|---|---|---|---|
| 1 | novabbs | 22.6 KB | 49.3 KB | 72.0 KB | 0.0 KB/s | 3.3 KB | 23:59:57 |
| 2 | i2pn | 0.0 KB | 0.0 KB | 0.0 KB | 0.0 KB/s | 0 | 00:10:00 |
| TOTAL: 2 | 22.6 KB | 49.3 KB | 72.0 KB | 0.0 KB/s | 3.3 KB | 24:09:57 | |
NNRP readership statistics:
| System | Conn | Arts | Size | Groups | Post | Rej | Elapsed | |
|---|---|---|---|---|---|---|---|---|
| 1 | i2pn2.org | 81 | 1 | 2.0 KB | 1 | 0 | 0 | 00:00:25 |
| TOTAL: 1 | 81 | 1 | 2.0 KB | 1 | 0 | 0 | 00:00:35 | |
NNRP readership statistics (by domain):
| System | Conn | Arts | Size | Groups | Post | Rej | Elapsed | |
|---|---|---|---|---|---|---|---|---|
| 1 | *.org | 81 | 1 | 2.0 KB | 1 | 0 | 0 | 00:00:25 |
| 2 | unresolved | 1 | 0 | 0.0 KB | 0 | 0 | 0 | 00:00:09 |
| TOTAL: 2 | 82 | 1 | 2.0 KB | 1 | 0 | 0 | 00:00:35 | |
NNRP auth users [Top 20]:
| User | Conn |
|---|---|
| i2pn2user | 81 |
| TOTAL: 1 | 81 |
NNRP total resource statistics [Top 20]:
| System | User(ms) | System(ms) | Idle(ms) | Elapsed |
|---|---|---|---|---|
| i2pn2.org | 4.192 | 0.464 | 7.607 | 00:00:25 |
| 162.243.143.136 | 0.044 | 0.000 | 0.000 | 00:00:09 |
| TOTAL: 2 | 4.236 | 0.464 | 7.607 | 00:00:35 |
Curious NNRP server explorers [Top 20]:
| System | Conn |
|---|---|
| 162.243.143.136 | 1 |
| TOTAL: 1 | 1 |
Newsgroup request counts (by category):
| Category | Count | Pct | |
|---|---|---|---|
| 1 | rocksolid | 1 | 100.0% |
| TOTAL: 1 | 1 | 100.0% | |
Newsgroup request counts (by newsgroup) [Top 100]:
| Newsgroup | Count | |
|---|---|---|
| 1 | rocksolid.shared.offtopic | 1 |
| TOTAL: 1 | 1 | |
