Log entries by program:
| Program name | Lines | %Lines | Size | %Size |
|---|---|---|---|---|
| inn | 15207 | 88.3% | 1.2 MB | 83.4% |
| innd | 997 | 5.8% | 145.4 KB | 9.5% |
| innfeed | 607 | 3.5% | 74.1 KB | 4.9% |
| nnrpd | 356 | 2.1% | 29.1 KB | 1.9% |
| nocem | 45 | 0.3% | 4.3 KB | 0.3% |
| controlchan | 1 | 0.0% | 0.1 KB | 0.0% |
| TOTAL: 6 | 17213 | 100.0% | 1.5 MB | 100.0% |
History cache:
| Reason | Count | %Count |
|---|---|---|
| Do not exist | 14748 | 98.6% |
| Negative hits | 148 | 1.0% |
| Positive hits | 45 | 0.3% |
| Cache misses | 9 | 0.1% |
| TOTAL: 4 | 14950 | 100.0% |
INND timer:
| Code region | Time | Pct | Invoked | Min(ms) | Avg(ms) | Max(ms) |
|---|---|---|---|---|---|---|
| article cancel | 00:00:00.022 | 0.0% | 72 | 0.000 | 0.306 | 3.500 |
| article cleanup | 00:00:00.069 | 0.0% | 14801 | 0.000 | 0.005 | 0.030 |
| article logging | 00:00:00.441 | 0.0% | 15148 | 0.000 | 0.029 | 0.078 |
| article parse | 00:00:00.208 | 0.0% | 17019 | 0.000 | 0.012 | 0.057 |
| article write | 00:00:03.215 | 0.0% | 14794 | 0.071 | 0.217 | 1.823 |
| artlog/artcncl | 00:00:00.000 | 0.0% | 72 | 0.000 | 0.000 | 0.000 |
| data move | 00:00:00.012 | 0.0% | 19087 | 0.000 | 0.001 | 0.016 |
| hisgrep/artcncl | 00:00:00.003 | 0.0% | 62 | 0.000 | 0.048 | 1.000 |
| hishave/artcncl | 00:00:00.000 | 0.0% | 72 | 0.000 | 0.000 | 0.000 |
| history grep | 00:00:00.000 | 0.0% | 0 | 0.000 | 0.000 | 0.000 |
| history lookup | 00:00:00.130 | 0.0% | 14952 | 0.000 | 0.009 | 0.407 |
| history sync | 00:00:00.017 | 0.0% | 415 | 0.000 | 0.041 | 0.500 |
| history write | 00:00:00.818 | 0.0% | 14801 | 0.000 | 0.055 | 0.296 |
| hiswrite/artcncl | 00:00:00.000 | 0.0% | 10 | 0.000 | 0.000 | 0.000 |
| idle | 24:00:34.526 | 100.0% | 17686 | 1839.816 | 4887.172 | 13954.605 |
| nntp read | 00:00:00.404 | 0.0% | 17224 | 0.000 | 0.023 | 0.085 |
| overview write | 00:00:02.294 | 0.0% | 14794 | 0.049 | 0.155 | 2.109 |
| perl filter | 00:00:20.364 | 0.0% | 14801 | 1.107 | 1.376 | 2.594 |
| python filter | 00:00:00.000 | 0.0% | 0 | 0.000 | 0.000 | 0.000 |
| site send | 00:00:00.629 | 0.0% | 14829 | 0.000 | 0.042 | 0.114 |
| TOTAL: 24:01:05.607 | 24:01:03.152 | 100.0% | - | - | - | - |
INNfeed timer:
| Code region | Time | Pct | Invoked | Min(ms) | Avg(ms) | Max(ms) |
|---|---|---|---|---|---|---|
| article new | 00:00:00.027 | 0.0% | 14765 | 0.000 | 0.002 | 0.022 |
| article prepare | 00:00:00.000 | 0.0% | 312 | 0.000 | 0.000 | 0.000 |
| article read | 00:00:00.027 | 0.0% | 78 | 0.000 | 0.346 | 21.000 |
| backlog stats | 00:00:00.015 | 0.0% | 48867 | 0.000 | 0.000 | 0.009 |
| callbacks | 00:00:00.000 | 0.0% | 0 | 0.000 | 0.000 | 0.000 |
| data read | 00:00:00.196 | 0.0% | 29643 | 0.000 | 0.007 | 0.035 |
| data write | 00:00:00.247 | 0.0% | 14885 | 0.000 | 0.017 | 0.062 |
| idle | 23:58:19.513 | 100.0% | 48867 | 793.712 | 1766.008 | 4152.710 |
| status file | 00:00:00.046 | 0.0% | 156 | 0.000 | 0.295 | 1.000 |
| TOTAL: 23:58:20.507 | 23:58:20.071 | 100.0% | - | - | - | - |
nnrpd timer:
| Code region | Time | Pct | Invoked | Min(ms) | Avg(ms) | Max(ms) |
|---|---|---|---|---|---|---|
| idle | 00:00:14.315 | 53.9% | 458 | 6.833 | 31.255 | 9624.000 |
| newnews | 00:00:00.000 | 0.0% | 0 | 0.000 | 0.000 | 0.000 |
| nntpwrite | 00:00:00.022 | 0.1% | 1594 | 0.000 | 0.014 | 0.095 |
| TOTAL: 00:00:26.570 | 00:00:14.337 | 54.0% | - | - | - | - |
Control commands to INND:
| Command | Number |
|---|---|
| L | 1 |
| flush | 3 |
| flushlogs | 2 |
| go | 2 |
| logmode | 2 |
| mode | 149 |
| name | 2 |
| pause | 2 |
| paused | 2 |
| reload | 2 |
| reserve | 2 |
| TOTAL: 11 | 169 |
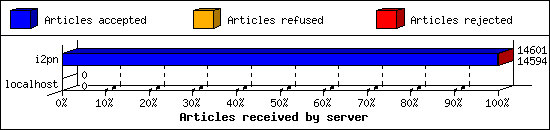
Incoming Feeds (INN):
| Server | Connects | Offered | Taken | Refused | Reject | %Accpt | Elapsed | |
|---|---|---|---|---|---|---|---|---|
| 1 | i2pn | 5 | 14601 | 14594 | 0 | 7 | 99% | 23:55:02 |
| 2 | localhost | 28 | 0 | 0 | 0 | 0 | 0% | 00:00:00 |
| TOTAL: 2 | 33 | 14601 | 14594 | 0 | 7 | 99% | 23:55:02 | |
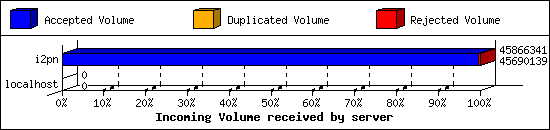
Incoming Volume (INN):
| Server | AcceptVol | DupVol | RejVol | TotalVol | %Acc | Vol/Art | |
|---|---|---|---|---|---|---|---|
| 1 | i2pn | 43.6 MB | 0.0 KB | 172.1 KB | 43.7 MB | 99% | 3.1 KB |
| 2 | localhost | 0.0 KB | 0.0 KB | 0.0 KB | 0.0 KB | 0% | 0 |
| TOTAL: 2 | 43.6 MB | 0.0 KB | 172.1 KB | 43.7 MB | 99% | 3.1 KB | |
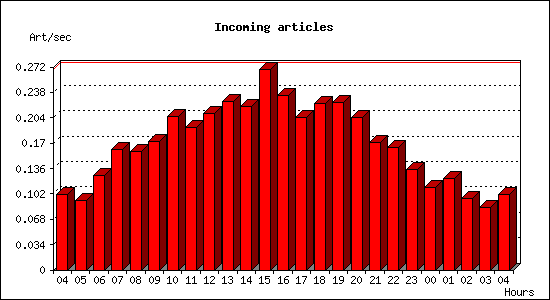
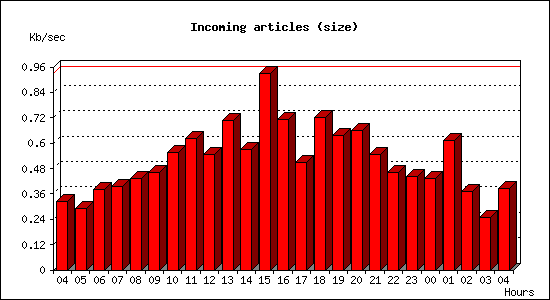
Incoming articles:
| Date | Articles | %Arts | Art/sec | Size | %Size | KB/sec |
|---|---|---|---|---|---|---|
| Jul 23 04:15:02 - 04:59:59 | 272 | 1.8% | 0.10 | 874.2 KB | 1.9% | 0.32 |
| Jul 23 05:00:00 - 05:59:59 | 334 | 2.3% | 0.09 | 1.0 MB | 2.3% | 0.29 |
| Jul 23 06:00:00 - 06:59:59 | 455 | 3.1% | 0.13 | 1.3 MB | 3.0% | 0.38 |
| Jul 23 07:00:00 - 07:59:59 | 579 | 3.9% | 0.16 | 1.4 MB | 3.2% | 0.40 |
| Jul 23 08:00:00 - 08:59:59 | 571 | 3.9% | 0.16 | 1.5 MB | 3.4% | 0.43 |
| Jul 23 09:00:00 - 09:59:59 | 622 | 4.2% | 0.17 | 1.6 MB | 3.7% | 0.46 |
| Jul 23 10:00:00 - 10:59:59 | 742 | 5.0% | 0.21 | 2.0 MB | 4.4% | 0.55 |
| Jul 23 11:00:00 - 11:59:59 | 688 | 4.7% | 0.19 | 2.2 MB | 5.0% | 0.62 |
| Jul 23 12:00:00 - 12:59:59 | 754 | 5.1% | 0.21 | 1.9 MB | 4.3% | 0.55 |
| Jul 23 13:00:00 - 13:59:59 | 812 | 5.5% | 0.23 | 2.5 MB | 5.6% | 0.71 |
| Jul 23 14:00:00 - 14:59:59 | 787 | 5.3% | 0.22 | 2.0 MB | 4.5% | 0.57 |
| Jul 23 15:00:00 - 15:59:59 | 967 | 6.5% | 0.27 | 3.3 MB | 7.4% | 0.93 |
| Jul 23 16:00:00 - 16:59:59 | 843 | 5.7% | 0.23 | 2.5 MB | 5.7% | 0.71 |
| Jul 23 17:00:00 - 17:59:59 | 737 | 5.0% | 0.20 | 1.8 MB | 4.0% | 0.51 |
| Jul 23 18:00:00 - 18:59:59 | 805 | 5.4% | 0.22 | 2.5 MB | 5.7% | 0.72 |
| Jul 23 19:00:00 - 19:59:59 | 806 | 5.5% | 0.22 | 2.2 MB | 5.1% | 0.64 |
| Jul 23 20:00:00 - 20:59:59 | 738 | 5.0% | 0.20 | 2.3 MB | 5.2% | 0.66 |
| Jul 23 21:00:00 - 21:59:59 | 614 | 4.2% | 0.17 | 1.9 MB | 4.4% | 0.55 |
| Jul 23 22:00:00 - 22:59:59 | 593 | 4.0% | 0.16 | 1.6 MB | 3.7% | 0.46 |
| Jul 23 23:00:00 - 23:59:59 | 486 | 3.3% | 0.14 | 1.5 MB | 3.5% | 0.44 |
| Jul 24 00:00:00 - 00:59:59 | 399 | 2.7% | 0.11 | 1.5 MB | 3.4% | 0.43 |
| Jul 24 01:00:00 - 01:59:59 | 441 | 3.0% | 0.12 | 2.2 MB | 4.9% | 0.61 |
| Jul 24 02:00:00 - 02:59:59 | 346 | 2.3% | 0.10 | 1.3 MB | 2.9% | 0.37 |
| Jul 24 03:00:00 - 03:59:59 | 300 | 2.0% | 0.08 | 888.4 KB | 2.0% | 0.25 |
| Jul 24 04:00:00 - 04:15:01 | 91 | 0.6% | 0.10 | 347.0 KB | 0.8% | 0.39 |
| TOTAL: 23:59:59 | 14782 | 100.0% | 0.17 | 44.2 MB | 100.0% | 0.52 |
Sites sending bad articles:
| Server | Total | Group | Dist | Duplic | Unapp | TooOld | Site | Line | Other | |
|---|---|---|---|---|---|---|---|---|---|---|
| 1 | i2pn | 354 | 2 | 0 | 0 | 0 | 0 | 0 | 0 | 352 |
| TOTAL: 1 | 354 | 2 | 0 | 0 | 0 | 0 | 0 | 0 | 352 | |
Unwanted newsgroups [Top 20]:
| Newsgroup | Count |
|---|---|
| hk.politics | 2 |
| TOTAL: 1 | 2 |
INND Perl filter [Top 20]:
| Reason | Count |
|---|---|
| Scoring filter (sit3) | 5 |
| TOTAL: 1 | 5 |
NoCeM on Spool:
| Id | Good | Bad | Unique | Total |
|---|---|---|---|---|
| bleachbot@httrack.com | 13 | 0 | 16 | 16 |
| TOTAL: 1 | 13 | 29 | 16 | 16 |
Miscellaneous innd statistics [Top 10]:
| Event | Server | Number |
|---|---|---|
| Including strange strings | ||
| i2pn | 347 | |
| TOTAL: 1 | 347 | |
| TOTAL: 1 | 347 | |
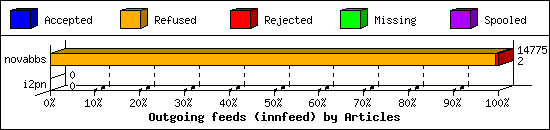
Outgoing Feeds (innfeed) by Articles:
| Server | Offered | Taken | Refused | Reject | Miss | Spool | %Took | Elapsed | |
|---|---|---|---|---|---|---|---|---|---|
| 1 | novabbs | 14807 | 2 | 14697 | 76 | 0 | 0 | 0% | 23:59:52 |
| 2 | i2pn | 0 | 0 | 0 | 0 | 0 | 0 | 0% | 00:10:00 |
| TOTAL: 2 | 14807 | 2 | 14697 | 76 | 0 | 0 | 0% | 24:09:52 | |
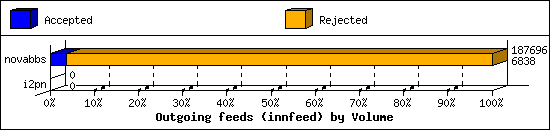
Outgoing Feeds (innfeed) by Volume:
| Server | AcceptVol | RejectVol | TotalVol | Volume/sec | Vol/Art | Elapsed | |
|---|---|---|---|---|---|---|---|
| 1 | novabbs | 6.7 KB | 176.6 KB | 183.3 KB | 0.0 KB/s | 2.3 KB | 23:59:52 |
| 2 | i2pn | 0.0 KB | 0.0 KB | 0.0 KB | 0.0 KB/s | 0 | 00:10:00 |
| TOTAL: 2 | 6.7 KB | 176.6 KB | 183.3 KB | 0.0 KB/s | 2.3 KB | 24:09:52 | |
NNRP readership statistics:
| System | Conn | Arts | Size | Groups | Post | Rej | Elapsed | |
|---|---|---|---|---|---|---|---|---|
| 1 | i2pn2.org | 66 | 0 | 0.0 KB | 0 | 0 | 0 | 00:00:16 |
| 2 | 162.243.134.70 | 1 | 0 | 0.0 KB | 0 | 0 | 0 | 00:00:09 |
| TOTAL: 2 | 67 | 0 | 0.0 KB | 0 | 0 | 0 | 00:00:26 | |
NNRP readership statistics (by domain):
| System | Conn | Arts | Size | Groups | Post | Rej | Elapsed | |
|---|---|---|---|---|---|---|---|---|
| 1 | *.org | 66 | 0 | 0.0 KB | 0 | 0 | 0 | 00:00:16 |
| 2 | unresolved | 1 | 0 | 0.0 KB | 0 | 0 | 0 | 00:00:09 |
| TOTAL: 2 | 67 | 0 | 0.0 KB | 0 | 0 | 0 | 00:00:26 | |
NNRP auth users [Top 20]:
| User | Conn |
|---|---|
| i2pn2user | 66 |
| TOTAL: 1 | 66 |
NNRP total resource statistics [Top 20]:
| System | User(ms) | System(ms) | Idle(ms) | Elapsed |
|---|---|---|---|---|
| i2pn2.org | 3.016 | 0.368 | 6.140 | 00:00:16 |
| 162.243.134.70 | 0.040 | 0.008 | 0.000 | 00:00:09 |
| TOTAL: 2 | 3.056 | 0.376 | 6.140 | 00:00:26 |
