Log entries by program:
| Program name | Lines | %Lines | Size | %Size |
|---|---|---|---|---|
| inn | 15443 | 85.2% | 1.3 MB | 80.9% |
| innd | 1066 | 5.9% | 153.5 KB | 9.6% |
| nnrpd | 979 | 5.4% | 78.6 KB | 4.9% |
| innfeed | 600 | 3.3% | 69.7 KB | 4.4% |
| nocem | 33 | 0.2% | 2.9 KB | 0.2% |
| controlchan | 1 | 0.0% | 0.1 KB | 0.0% |
| TOTAL: 6 | 18122 | 100.0% | 1.6 MB | 100.0% |
History cache:
| Reason | Count | %Count |
|---|---|---|
| Do not exist | 15094 | 98.5% |
| Negative hits | 188 | 1.2% |
| Positive hits | 26 | 0.2% |
| Cache misses | 21 | 0.1% |
| TOTAL: 4 | 15329 | 100.0% |
INND timer:
| Code region | Time | Pct | Invoked | Min(ms) | Avg(ms) | Max(ms) |
|---|---|---|---|---|---|---|
| article cancel | 00:00:00.036 | 0.0% | 73 | 0.000 | 0.493 | 1.600 |
| article cleanup | 00:00:00.077 | 0.0% | 15133 | 0.000 | 0.005 | 0.030 |
| article logging | 00:00:00.370 | 0.0% | 15395 | 0.000 | 0.024 | 0.085 |
| article parse | 00:00:00.212 | 0.0% | 16758 | 0.000 | 0.013 | 0.053 |
| article write | 00:00:05.026 | 0.0% | 15127 | 0.167 | 0.332 | 1.708 |
| artlog/artcncl | 00:00:00.002 | 0.0% | 73 | 0.000 | 0.027 | 0.143 |
| data move | 00:00:00.013 | 0.0% | 18458 | 0.000 | 0.001 | 0.014 |
| hisgrep/artcncl | 00:00:00.004 | 0.0% | 56 | 0.000 | 0.071 | 0.250 |
| hishave/artcncl | 00:00:00.003 | 0.0% | 73 | 0.000 | 0.041 | 0.300 |
| history grep | 00:00:00.000 | 0.0% | 0 | 0.000 | 0.000 | 0.000 |
| history lookup | 00:00:00.156 | 0.0% | 15337 | 0.000 | 0.010 | 0.159 |
| history sync | 00:00:00.023 | 0.0% | 418 | 0.000 | 0.055 | 0.500 |
| history write | 00:00:00.568 | 0.0% | 15133 | 0.000 | 0.038 | 0.500 |
| hiswrite/artcncl | 00:00:00.000 | 0.0% | 17 | 0.000 | 0.000 | 0.000 |
| idle | 24:00:39.377 | 100.0% | 17734 | 2777.792 | 4874.218 | 15402.436 |
| nntp read | 00:00:00.451 | 0.0% | 17034 | 0.000 | 0.026 | 0.080 |
| overview write | 00:00:02.281 | 0.0% | 15127 | 0.031 | 0.151 | 1.230 |
| perl filter | 00:00:20.390 | 0.0% | 15133 | 1.094 | 1.347 | 1.933 |
| python filter | 00:00:00.000 | 0.0% | 0 | 0.000 | 0.000 | 0.000 |
| site send | 00:00:00.539 | 0.0% | 15152 | 0.000 | 0.036 | 0.088 |
| TOTAL: 24:01:12.135 | 24:01:09.528 | 100.0% | - | - | - | - |
INNfeed timer:
| Code region | Time | Pct | Invoked | Min(ms) | Avg(ms) | Max(ms) |
|---|---|---|---|---|---|---|
| article new | 00:00:00.025 | 0.0% | 15106 | 0.000 | 0.002 | 0.023 |
| article prepare | 00:00:00.000 | 0.0% | 76 | 0.000 | 0.000 | 0.000 |
| article read | 00:00:00.024 | 0.0% | 19 | 0.000 | 1.263 | 7.667 |
| backlog stats | 00:00:00.016 | 0.0% | 49774 | 0.000 | 0.000 | 0.005 |
| callbacks | 00:00:00.000 | 0.0% | 0 | 0.000 | 0.000 | 0.000 |
| data read | 00:00:00.199 | 0.0% | 30269 | 0.000 | 0.007 | 0.036 |
| data write | 00:00:00.228 | 0.0% | 15164 | 0.000 | 0.015 | 0.066 |
| idle | 23:59:12.490 | 100.0% | 49774 | 1117.913 | 1734.892 | 4305.993 |
| status file | 00:00:00.045 | 0.0% | 152 | 0.000 | 0.296 | 1.000 |
| TOTAL: 23:59:13.464 | 23:59:13.027 | 100.0% | - | - | - | - |
nnrpd timer:
| Code region | Time | Pct | Invoked | Min(ms) | Avg(ms) | Max(ms) |
|---|---|---|---|---|---|---|
| idle | 00:30:13.290 | 96.3% | 1263 | 6.833 | 1435.701 | 900046.000 |
| newnews | 00:00:00.000 | 0.0% | 0 | 0.000 | 0.000 | 0.000 |
| nntpwrite | 00:00:00.055 | 0.0% | 4401 | 0.000 | 0.012 | 0.190 |
| TOTAL: 00:31:23.855 | 00:30:13.345 | 96.3% | - | - | - | - |
Control commands to INND:
| Command | Number |
|---|---|
| L | 1 |
| flush | 3 |
| flushlogs | 2 |
| go | 2 |
| logmode | 2 |
| mode | 149 |
| name | 2 |
| pause | 2 |
| paused | 2 |
| reload | 2 |
| reserve | 2 |
| TOTAL: 11 | 169 |
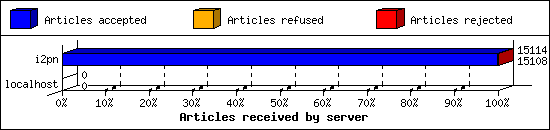
Incoming Feeds (INN):
| Server | Connects | Offered | Taken | Refused | Reject | %Accpt | Elapsed | |
|---|---|---|---|---|---|---|---|---|
| 1 | i2pn | 7 | 15114 | 15108 | 0 | 6 | 99% | 24:39:07 |
| 2 | localhost | 32 | 0 | 0 | 0 | 0 | 0% | 00:00:00 |
| TOTAL: 2 | 39 | 15114 | 15108 | 0 | 6 | 99% | 24:39:07 | |
Incoming Volume (INN):
| Server | AcceptVol | DupVol | RejVol | TotalVol | %Acc | Vol/Art | |
|---|---|---|---|---|---|---|---|
| 1 | i2pn | 42.1 MB | 0.0 KB | 167.3 KB | 42.3 MB | 99% | 2.9 KB |
| 2 | localhost | 0.0 KB | 0.0 KB | 0.0 KB | 0.0 KB | 0% | 0 |
| TOTAL: 2 | 42.1 MB | 0.0 KB | 167.3 KB | 42.3 MB | 99% | 2.9 KB | |

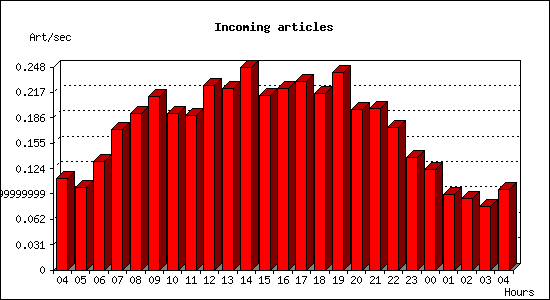
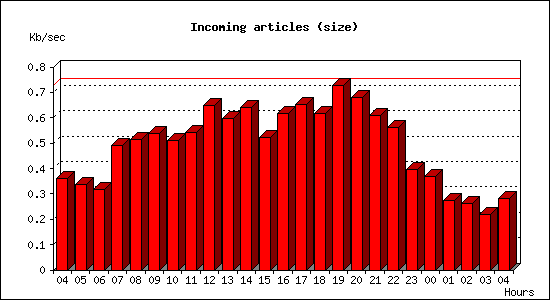
Incoming articles:
| Date | Articles | %Arts | Art/sec | Size | %Size | KB/sec |
|---|---|---|---|---|---|---|
| Jul 25 04:15:01 - 04:59:59 | 301 | 2.0% | 0.11 | 976.9 KB | 2.3% | 0.36 |
| Jul 25 05:00:00 - 05:59:59 | 364 | 2.4% | 0.10 | 1.2 MB | 2.8% | 0.34 |
| Jul 25 06:00:00 - 06:59:59 | 478 | 3.2% | 0.13 | 1.1 MB | 2.6% | 0.32 |
| Jul 25 07:00:00 - 07:59:59 | 616 | 4.1% | 0.17 | 1.7 MB | 4.1% | 0.49 |
| Jul 25 08:00:00 - 08:59:59 | 690 | 4.6% | 0.19 | 1.8 MB | 4.3% | 0.51 |
| Jul 25 09:00:00 - 09:59:59 | 761 | 5.0% | 0.21 | 1.9 MB | 4.5% | 0.54 |
| Jul 25 10:00:00 - 10:59:59 | 687 | 4.5% | 0.19 | 1.8 MB | 4.3% | 0.51 |
| Jul 25 11:00:00 - 11:59:59 | 680 | 4.5% | 0.19 | 1.9 MB | 4.5% | 0.54 |
| Jul 25 12:00:00 - 12:59:59 | 813 | 5.4% | 0.23 | 2.3 MB | 5.4% | 0.65 |
| Jul 25 13:00:00 - 13:59:59 | 797 | 5.3% | 0.22 | 2.1 MB | 5.0% | 0.60 |
| Jul 25 14:00:00 - 14:59:59 | 892 | 5.9% | 0.25 | 2.3 MB | 5.3% | 0.64 |
| Jul 25 15:00:00 - 15:59:59 | 767 | 5.1% | 0.21 | 1.8 MB | 4.4% | 0.52 |
| Jul 25 16:00:00 - 16:59:59 | 797 | 5.3% | 0.22 | 2.2 MB | 5.2% | 0.62 |
| Jul 25 17:00:00 - 17:59:59 | 830 | 5.5% | 0.23 | 2.3 MB | 5.4% | 0.65 |
| Jul 25 18:00:00 - 18:59:59 | 776 | 5.1% | 0.22 | 2.2 MB | 5.2% | 0.62 |
| Jul 25 19:00:00 - 19:59:59 | 867 | 5.7% | 0.24 | 2.6 MB | 6.1% | 0.73 |
| Jul 25 20:00:00 - 20:59:59 | 706 | 4.7% | 0.20 | 2.4 MB | 5.7% | 0.68 |
| Jul 25 21:00:00 - 21:59:59 | 712 | 4.7% | 0.20 | 2.1 MB | 5.1% | 0.61 |
| Jul 25 22:00:00 - 22:59:59 | 626 | 4.1% | 0.17 | 2.0 MB | 4.7% | 0.56 |
| Jul 25 23:00:00 - 23:59:59 | 493 | 3.3% | 0.14 | 1.4 MB | 3.3% | 0.40 |
| Jul 26 00:00:00 - 00:59:59 | 441 | 2.9% | 0.12 | 1.3 MB | 3.1% | 0.37 |
| Jul 26 01:00:00 - 01:59:59 | 331 | 2.2% | 0.09 | 991.6 KB | 2.3% | 0.28 |
| Jul 26 02:00:00 - 02:59:59 | 316 | 2.1% | 0.09 | 940.7 KB | 2.2% | 0.26 |
| Jul 26 03:00:00 - 03:59:59 | 278 | 1.8% | 0.08 | 788.7 KB | 1.8% | 0.22 |
| Jul 26 04:00:00 - 04:15:01 | 89 | 0.6% | 0.10 | 253.7 KB | 0.6% | 0.28 |
| TOTAL: 24:00:00 | 15108 | 100.0% | 0.17 | 42.1 MB | 100.0% | 0.50 |
Sites sending bad articles:
| Server | Total | Group | Dist | Duplic | Unapp | TooOld | Site | Line | Other | |
|---|---|---|---|---|---|---|---|---|---|---|
| 1 | i2pn | 267 | 1 | 0 | 0 | 0 | 0 | 0 | 0 | 266 |
| TOTAL: 1 | 267 | 1 | 0 | 0 | 0 | 0 | 0 | 0 | 266 | |
Unwanted newsgroups [Top 20]:
| Newsgroup | Count |
|---|---|
| alt.sex.girl | 1 |
| TOTAL: 1 | 1 |
INND Perl filter [Top 20]:
| Reason | Count |
|---|---|
| Scoring filter (sit3) | 5 |
| TOTAL: 1 | 5 |
NoCeM on Spool:
| Id | Good | Bad | Unique | Total |
|---|---|---|---|---|
| bleachbot@httrack.com | 24 | 0 | 27 | 27 |
| TOTAL: 1 | 24 | 2 | 27 | 27 |
Miscellaneous innd statistics [Top 10]:
| Event | Server | Number |
|---|---|---|
| Including strange strings | ||
| i2pn | 261 | |
| TOTAL: 1 | 261 | |
| TOTAL: 1 | 261 | |
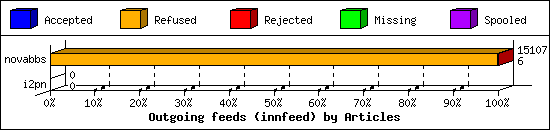
Outgoing Feeds (innfeed) by Articles:
| Server | Offered | Taken | Refused | Reject | Miss | Spool | %Took | Elapsed | |
|---|---|---|---|---|---|---|---|---|---|
| 1 | novabbs | 15144 | 6 | 15088 | 13 | 0 | 0 | 0% | 23:59:58 |
| 2 | i2pn | 0 | 0 | 0 | 0 | 0 | 0 | 0% | 00:10:00 |
| TOTAL: 2 | 15144 | 6 | 15088 | 13 | 0 | 0 | 0% | 24:09:58 | |
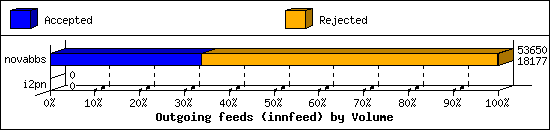
Outgoing Feeds (innfeed) by Volume:
| Server | AcceptVol | RejectVol | TotalVol | Volume/sec | Vol/Art | Elapsed | |
|---|---|---|---|---|---|---|---|
| 1 | novabbs | 17.8 KB | 34.6 KB | 52.4 KB | 0.0 KB/s | 2.8 KB | 23:59:58 |
| 2 | i2pn | 0.0 KB | 0.0 KB | 0.0 KB | 0.0 KB/s | 0 | 00:10:00 |
| TOTAL: 2 | 17.8 KB | 34.6 KB | 52.4 KB | 0.0 KB/s | 2.8 KB | 24:09:58 | |
NNRP readership statistics:
| System | Conn | Arts | Size | Groups | Post | Rej | Elapsed | |
|---|---|---|---|---|---|---|---|---|
| 1 | 115.236.33.146 | 1 | 0 | 0.0 KB | 0 | 0 | 0 | 00:30:00 |
| 2 | scan-141.security.ipip.net | 2 | 0 | 0.0 KB | 0 | 0 | 0 | 00:00:01 |
| 3 | i2pn2.org | 179 | 0 | 0.0 KB | 0 | 0 | 0 | 00:01:21 |
| TOTAL: 3 | 182 | 0 | 0.0 KB | 0 | 0 | 0 | 00:31:23 | |
NNRP readership statistics (by domain):
| System | Conn | Arts | Size | Groups | Post | Rej | Elapsed | |
|---|---|---|---|---|---|---|---|---|
| 1 | *.org | 179 | 0 | 0.0 KB | 0 | 0 | 0 | 00:01:21 |
| 2 | unresolved | 1 | 0 | 0.0 KB | 0 | 0 | 0 | 00:30:00 |
| 3 | *.security.ipip.net | 2 | 0 | 0.0 KB | 0 | 0 | 0 | 00:00:01 |
| TOTAL: 3 | 182 | 0 | 0.0 KB | 0 | 0 | 0 | 00:31:23 | |
NNRP auth users [Top 20]:
| User | Conn |
|---|---|
| i2pn2user | 180 |
| TOTAL: 1 | 180 |
NNRP total resource statistics [Top 20]:
| System | User(ms) | System(ms) | Idle(ms) | Elapsed |
|---|---|---|---|---|
| 115.236.33.146 | 0.064 | 0.004 | 0.000 | 00:30:00 |
| i2pn2.org | 8.248 | 1.004 | 16.569 | 00:01:21 |
| scan-141.security.ipip.net | 0.080 | 0.008 | 0.000 | 00:00:01 |
| TOTAL: 3 | 8.392 | 1.016 | 16.569 | 00:31:23 |
NNRP unrecognized commands (by host):
| System | Conn |
|---|---|
| scan-141.security.ipip.net | 8 |
| 115.236.33.146 | 1 |
| TOTAL: 2 | 9 |
NNRP unrecognized commands (by command):
| Command | Count |
|---|---|
| Host: 157.230.63.40:119 | 2 |
| User-Agent: HTTP Banner Detection (https... | 2 |
| GET / HTTP/1.1 | 2 |
| Connection: close | 2 |
| GET / HTTP/1.0 | 1 |
| TOTAL: 5 | 9 |
NNRP client timeouts [Top 20]:
| System | Conn | Peer |
|---|---|---|
| 115.236.33.146 | 1 | 0 |
| TOTAL: 1 | 1 | 0 |
