Log entries by program:
| Program name | Lines | %Lines | Size | %Size |
|---|---|---|---|---|
| inn | 15502 | 88.2% | 1.3 MB | 83.2% |
| innd | 1093 | 6.2% | 157.1 KB | 10.1% |
| innfeed | 607 | 3.5% | 71.5 KB | 4.6% |
| nnrpd | 332 | 1.9% | 27.0 KB | 1.7% |
| nocem | 42 | 0.2% | 3.6 KB | 0.2% |
| controlchan | 1 | 0.0% | 0.1 KB | 0.0% |
| TOTAL: 6 | 17577 | 100.0% | 1.5 MB | 100.0% |
History cache:
| Reason | Count | %Count |
|---|---|---|
| Do not exist | 14992 | 97.7% |
| Negative hits | 287 | 1.9% |
| Positive hits | 53 | 0.3% |
| Cache misses | 9 | 0.1% |
| TOTAL: 4 | 15341 | 100.0% |
INND timer:
| Code region | Time | Pct | Invoked | Min(ms) | Avg(ms) | Max(ms) |
|---|---|---|---|---|---|---|
| article cancel | 00:00:00.023 | 0.0% | 68 | 0.000 | 0.338 | 2.000 |
| article cleanup | 00:00:00.082 | 0.0% | 15021 | 0.000 | 0.005 | 0.040 |
| article logging | 00:00:00.441 | 0.0% | 15413 | 0.000 | 0.029 | 0.119 |
| article parse | 00:00:00.237 | 0.0% | 16638 | 0.000 | 0.014 | 0.065 |
| article write | 00:00:04.933 | 0.0% | 15017 | 0.119 | 0.328 | 3.528 |
| artlog/artcncl | 00:00:00.002 | 0.0% | 68 | 0.000 | 0.029 | 0.500 |
| data move | 00:00:00.015 | 0.0% | 18442 | 0.000 | 0.001 | 0.016 |
| hisgrep/artcncl | 00:00:00.002 | 0.0% | 63 | 0.000 | 0.032 | 1.000 |
| hishave/artcncl | 00:00:00.000 | 0.0% | 68 | 0.000 | 0.000 | 0.000 |
| history grep | 00:00:00.000 | 0.0% | 0 | 0.000 | 0.000 | 0.000 |
| history lookup | 00:00:00.201 | 0.0% | 15342 | 0.000 | 0.013 | 0.050 |
| history sync | 00:00:00.014 | 0.0% | 370 | 0.000 | 0.038 | 0.500 |
| history write | 00:00:02.826 | 0.0% | 15021 | 0.000 | 0.188 | 0.876 |
| hiswrite/artcncl | 00:00:00.001 | 0.0% | 5 | 0.200 | 0.200 | 0.200 |
| idle | 24:00:18.292 | 100.0% | 17451 | 2728.000 | 4952.054 | 15001.925 |
| nntp read | 00:00:00.436 | 0.0% | 17024 | 0.000 | 0.026 | 0.080 |
| overview write | 00:00:02.563 | 0.0% | 15017 | 0.013 | 0.171 | 4.283 |
| perl filter | 00:00:20.149 | 0.0% | 15021 | 1.042 | 1.341 | 2.147 |
| python filter | 00:00:00.000 | 0.0% | 0 | 0.000 | 0.000 | 0.000 |
| site send | 00:00:00.457 | 0.0% | 15034 | 0.000 | 0.030 | 0.094 |
| TOTAL: 24:00:53.221 | 24:00:50.674 | 100.0% | - | - | - | - |
INNfeed timer:
| Code region | Time | Pct | Invoked | Min(ms) | Avg(ms) | Max(ms) |
|---|---|---|---|---|---|---|
| article new | 00:00:00.025 | 0.0% | 15005 | 0.000 | 0.002 | 0.020 |
| article prepare | 00:00:00.000 | 0.0% | 76 | 0.000 | 0.000 | 0.000 |
| article read | 00:00:00.037 | 0.0% | 19 | 0.000 | 1.947 | 34.000 |
| backlog stats | 00:00:00.016 | 0.0% | 49492 | 0.000 | 0.000 | 0.008 |
| callbacks | 00:00:00.000 | 0.0% | 0 | 0.000 | 0.000 | 0.000 |
| data read | 00:00:00.204 | 0.0% | 30074 | 0.000 | 0.007 | 0.031 |
| data write | 00:00:00.226 | 0.0% | 15070 | 0.000 | 0.015 | 0.067 |
| idle | 23:58:12.696 | 100.0% | 49492 | 1167.212 | 1743.569 | 4183.271 |
| status file | 00:00:00.041 | 0.0% | 155 | 0.000 | 0.265 | 1.286 |
| TOTAL: 23:58:13.655 | 23:58:13.245 | 100.0% | - | - | - | - |
nnrpd timer:
| Code region | Time | Pct | Invoked | Min(ms) | Avg(ms) | Max(ms) |
|---|---|---|---|---|---|---|
| idle | 00:00:12.738 | 48.7% | 390 | 7.000 | 32.662 | 9668.000 |
| newnews | 00:00:00.000 | 0.0% | 0 | 0.000 | 0.000 | 0.000 |
| nntpwrite | 00:00:00.007 | 0.0% | 1361 | 0.000 | 0.005 | 0.048 |
| TOTAL: 00:00:26.130 | 00:00:12.745 | 48.8% | - | - | - | - |
Control commands to INND:
| Command | Number |
|---|---|
| L | 1 |
| flush | 3 |
| flushlogs | 2 |
| go | 2 |
| logmode | 2 |
| mode | 149 |
| name | 2 |
| pause | 2 |
| paused | 2 |
| reload | 2 |
| reserve | 2 |
| TOTAL: 11 | 169 |
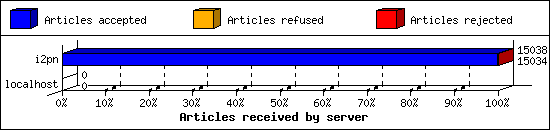
Incoming Feeds (INN):
| Server | Connects | Offered | Taken | Refused | Reject | %Accpt | Elapsed | |
|---|---|---|---|---|---|---|---|---|
| 1 | i2pn | 5 | 15038 | 15034 | 0 | 4 | 99% | 24:25:01 |
| 2 | localhost | 34 | 0 | 0 | 0 | 0 | 0% | 00:00:00 |
| TOTAL: 2 | 39 | 15038 | 15034 | 0 | 4 | 99% | 24:25:01 | |
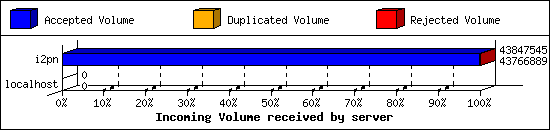
Incoming Volume (INN):
| Server | AcceptVol | DupVol | RejVol | TotalVol | %Acc | Vol/Art | |
|---|---|---|---|---|---|---|---|
| 1 | i2pn | 41.7 MB | 0.0 KB | 78.8 KB | 41.8 MB | 99% | 2.8 KB |
| 2 | localhost | 0.0 KB | 0.0 KB | 0.0 KB | 0.0 KB | 0% | 0 |
| TOTAL: 2 | 41.7 MB | 0.0 KB | 78.8 KB | 41.8 MB | 99% | 2.8 KB | |
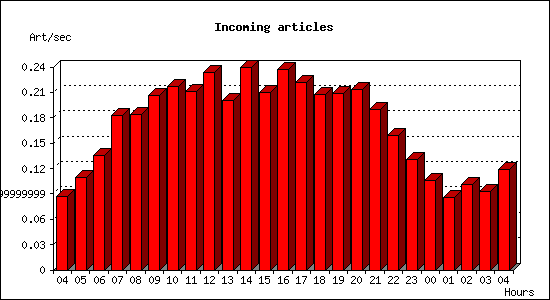
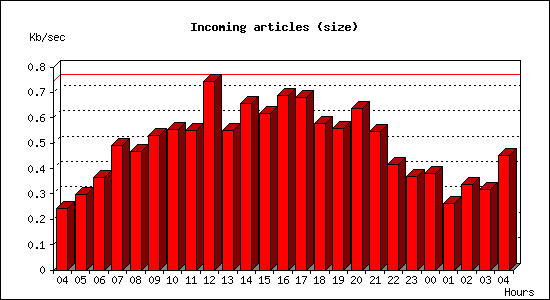
Incoming articles:
| Date | Articles | %Arts | Art/sec | Size | %Size | KB/sec |
|---|---|---|---|---|---|---|
| Jul 26 04:15:01 - 04:59:59 | 234 | 1.6% | 0.09 | 649.2 KB | 1.5% | 0.24 |
| Jul 26 05:00:00 - 05:59:59 | 394 | 2.6% | 0.11 | 1.0 MB | 2.5% | 0.30 |
| Jul 26 06:00:00 - 06:59:59 | 488 | 3.2% | 0.14 | 1.3 MB | 3.1% | 0.36 |
| Jul 26 07:00:00 - 07:59:59 | 656 | 4.4% | 0.18 | 1.7 MB | 4.1% | 0.49 |
| Jul 26 08:00:00 - 08:59:59 | 661 | 4.4% | 0.18 | 1.6 MB | 3.9% | 0.47 |
| Jul 26 09:00:00 - 09:59:59 | 744 | 4.9% | 0.21 | 1.9 MB | 4.5% | 0.53 |
| Jul 26 10:00:00 - 10:59:59 | 782 | 5.2% | 0.22 | 1.9 MB | 4.7% | 0.55 |
| Jul 26 11:00:00 - 11:59:59 | 759 | 5.0% | 0.21 | 1.9 MB | 4.6% | 0.55 |
| Jul 26 12:00:00 - 12:59:59 | 840 | 5.6% | 0.23 | 2.6 MB | 6.3% | 0.74 |
| Jul 26 13:00:00 - 13:59:59 | 723 | 4.8% | 0.20 | 1.9 MB | 4.6% | 0.55 |
| Jul 26 14:00:00 - 14:59:59 | 862 | 5.7% | 0.24 | 2.3 MB | 5.5% | 0.65 |
| Jul 26 15:00:00 - 15:59:59 | 754 | 5.0% | 0.21 | 2.2 MB | 5.2% | 0.62 |
| Jul 26 16:00:00 - 16:59:59 | 853 | 5.7% | 0.24 | 2.4 MB | 5.8% | 0.69 |
| Jul 26 17:00:00 - 17:59:59 | 797 | 5.3% | 0.22 | 2.4 MB | 5.7% | 0.68 |
| Jul 26 18:00:00 - 18:59:59 | 745 | 5.0% | 0.21 | 2.0 MB | 4.9% | 0.58 |
| Jul 26 19:00:00 - 19:59:59 | 753 | 5.0% | 0.21 | 2.0 MB | 4.7% | 0.56 |
| Jul 26 20:00:00 - 20:59:59 | 767 | 5.1% | 0.21 | 2.2 MB | 5.4% | 0.64 |
| Jul 26 21:00:00 - 21:59:59 | 685 | 4.6% | 0.19 | 1.9 MB | 4.6% | 0.55 |
| Jul 26 22:00:00 - 22:59:59 | 571 | 3.8% | 0.16 | 1.5 MB | 3.5% | 0.41 |
| Jul 26 23:00:00 - 23:59:59 | 469 | 3.1% | 0.13 | 1.3 MB | 3.1% | 0.37 |
| Jul 27 00:00:00 - 00:59:59 | 381 | 2.5% | 0.11 | 1.3 MB | 3.2% | 0.38 |
| Jul 27 01:00:00 - 01:59:59 | 309 | 2.1% | 0.09 | 948.1 KB | 2.2% | 0.26 |
| Jul 27 02:00:00 - 02:59:59 | 364 | 2.4% | 0.10 | 1.2 MB | 2.8% | 0.34 |
| Jul 27 03:00:00 - 03:59:59 | 336 | 2.2% | 0.09 | 1.1 MB | 2.7% | 0.32 |
| Jul 27 04:00:00 - 04:15:02 | 107 | 0.7% | 0.12 | 406.3 KB | 1.0% | 0.45 |
| TOTAL: 24:00:01 | 15034 | 100.0% | 0.17 | 41.7 MB | 100.0% | 0.49 |
Sites sending bad articles:
| Server | Total | Group | Dist | Duplic | Unapp | TooOld | Site | Line | Other | |
|---|---|---|---|---|---|---|---|---|---|---|
| 1 | i2pn | 397 | 1 | 0 | 0 | 0 | 0 | 0 | 0 | 396 |
| TOTAL: 1 | 397 | 1 | 0 | 0 | 0 | 0 | 0 | 0 | 396 | |
Unwanted newsgroups [Top 20]:
| Newsgroup | Count |
|---|---|
| hk.politics | 1 |
| TOTAL: 1 | 1 |
INND Perl filter [Top 20]:
| Reason | Count |
|---|---|
| EMP (md5) | 2 |
| Scoring filter (sit3) | 1 |
| TOTAL: 2 | 3 |
NoCeM on Spool:
| Id | Good | Bad | Unique | Total |
|---|---|---|---|---|
| bleachbot@httrack.com | 21 | 0 | 22 | 22 |
| TOTAL: 1 | 21 | 12 | 22 | 22 |
Miscellaneous innd statistics [Top 10]:
| Event | Server | Number |
|---|---|---|
| Including strange strings | ||
| i2pn | 393 | |
| TOTAL: 1 | 393 | |
| TOTAL: 1 | 393 | |
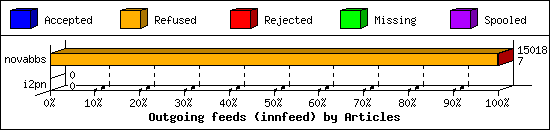
Outgoing Feeds (innfeed) by Articles:
| Server | Offered | Taken | Refused | Reject | Miss | Spool | %Took | Elapsed | |
|---|---|---|---|---|---|---|---|---|---|
| 1 | novabbs | 15053 | 7 | 14999 | 12 | 0 | 0 | 0% | 23:59:59 |
| 2 | i2pn | 0 | 0 | 0 | 0 | 0 | 0 | 0% | 00:10:00 |
| TOTAL: 2 | 15053 | 7 | 14999 | 12 | 0 | 0 | 0% | 24:09:59 | |
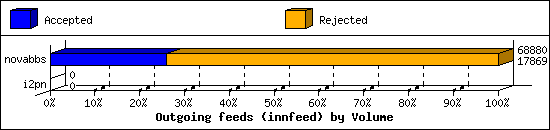
Outgoing Feeds (innfeed) by Volume:
| Server | AcceptVol | RejectVol | TotalVol | Volume/sec | Vol/Art | Elapsed | |
|---|---|---|---|---|---|---|---|
| 1 | novabbs | 17.5 KB | 49.8 KB | 67.3 KB | 0.0 KB/s | 3.5 KB | 23:59:59 |
| 2 | i2pn | 0.0 KB | 0.0 KB | 0.0 KB | 0.0 KB/s | 0 | 00:10:00 |
| TOTAL: 2 | 17.5 KB | 49.8 KB | 67.3 KB | 0.0 KB/s | 3.5 KB | 24:09:59 | |
NNRP readership statistics:
| System | Conn | Arts | Size | Groups | Post | Rej | Elapsed | |
|---|---|---|---|---|---|---|---|---|
| 1 | 162.243.150.138 | 1 | 0 | 0.0 KB | 0 | 0 | 0 | 00:00:09 |
| 2 | i2pn2.org | 64 | 0 | 0.0 KB | 0 | 0 | 0 | 00:00:15 |
| 3 | worker-18.sfj.corp.censys.io | 1 | 0 | 0.0 KB | 0 | 0 | 0 | 00:00:00 |
| TOTAL: 3 | 66 | 0 | 0.0 KB | 0 | 0 | 0 | 00:00:25 | |
NNRP readership statistics (by domain):
| System | Conn | Arts | Size | Groups | Post | Rej | Elapsed | |
|---|---|---|---|---|---|---|---|---|
| 1 | unresolved | 1 | 0 | 0.0 KB | 0 | 0 | 0 | 00:00:09 |
| 2 | *.org | 64 | 0 | 0.0 KB | 0 | 0 | 0 | 00:00:15 |
| 3 | *.sfj.corp.censys.io | 1 | 0 | 0.0 KB | 0 | 0 | 0 | 00:00:00 |
| TOTAL: 3 | 66 | 0 | 0.0 KB | 0 | 0 | 0 | 00:00:25 | |
NNRP auth users [Top 20]:
| User | Conn |
|---|---|
| i2pn2user | 64 |
| TOTAL: 1 | 64 |
NNRP total resource statistics [Top 20]:
| System | User(ms) | System(ms) | Idle(ms) | Elapsed |
|---|---|---|---|---|
| i2pn2.org | 2.808 | 0.408 | 5.759 | 00:00:15 |
| 162.243.150.138 | 0.044 | 0.004 | 0.000 | 00:00:09 |
| worker-18.sfj.corp.censys.io | 0.036 | 0.008 | 0.000 | 00:00:00 |
| TOTAL: 3 | 2.888 | 0.420 | 5.759 | 00:00:25 |
NNRP client timeouts [Top 20]:
| System | Conn | Peer |
|---|---|---|
| worker-18.sfj.corp.censys.io | 1 | 1 |
| TOTAL: 1 | 1 | 1 |
