Log entries by program:
| Program name | Lines | %Lines | Size | %Size |
|---|---|---|---|---|
| inn | 13814 | 87.7% | 1.1 MB | 82.3% |
| innd | 1010 | 6.4% | 147.2 KB | 10.6% |
| innfeed | 605 | 3.8% | 71.8 KB | 5.2% |
| nnrpd | 277 | 1.8% | 23.1 KB | 1.7% |
| nocem | 46 | 0.3% | 4.1 KB | 0.3% |
| controlchan | 1 | 0.0% | 0.1 KB | 0.0% |
| TOTAL: 6 | 15753 | 100.0% | 1.4 MB | 100.0% |
History cache:
| Reason | Count | %Count |
|---|---|---|
| Do not exist | 13504 | 97.7% |
| Negative hits | 283 | 2.0% |
| Positive hits | 25 | 0.2% |
| Cache misses | 10 | 0.1% |
| TOTAL: 4 | 13822 | 100.0% |
INND timer:
| Code region | Time | Pct | Invoked | Min(ms) | Avg(ms) | Max(ms) |
|---|---|---|---|---|---|---|
| article cancel | 00:00:00.062 | 0.0% | 74 | 0.000 | 0.838 | 3.667 |
| article cleanup | 00:00:00.068 | 0.0% | 13527 | 0.000 | 0.005 | 0.033 |
| article logging | 00:00:00.394 | 0.0% | 13763 | 0.000 | 0.029 | 0.093 |
| article parse | 00:00:00.183 | 0.0% | 14937 | 0.000 | 0.012 | 0.081 |
| article write | 00:00:07.355 | 0.0% | 13525 | 0.151 | 0.544 | 2.362 |
| artlog/artcncl | 00:00:00.003 | 0.0% | 74 | 0.000 | 0.041 | 1.000 |
| data move | 00:00:00.006 | 0.0% | 16619 | 0.000 | 0.000 | 0.020 |
| hisgrep/artcncl | 00:00:00.004 | 0.0% | 42 | 0.000 | 0.095 | 1.000 |
| hishave/artcncl | 00:00:00.026 | 0.0% | 74 | 0.000 | 0.351 | 3.500 |
| history grep | 00:00:00.000 | 0.0% | 0 | 0.000 | 0.000 | 0.000 |
| history lookup | 00:00:05.923 | 0.0% | 13827 | 0.000 | 0.428 | 8.333 |
| history sync | 00:00:00.019 | 0.0% | 307 | 0.000 | 0.062 | 1.000 |
| history write | 00:00:03.003 | 0.0% | 13527 | 0.000 | 0.222 | 2.139 |
| hiswrite/artcncl | 00:00:00.006 | 0.0% | 32 | 0.000 | 0.188 | 0.667 |
| idle | 23:59:40.810 | 100.0% | 15618 | 2855.710 | 5530.850 | 15379.538 |
| nntp read | 00:00:00.382 | 0.0% | 15310 | 0.000 | 0.025 | 0.068 |
| overview write | 00:00:03.413 | 0.0% | 13525 | 0.056 | 0.252 | 1.712 |
| perl filter | 00:00:18.130 | 0.0% | 13527 | 1.073 | 1.340 | 2.104 |
| python filter | 00:00:00.000 | 0.0% | 0 | 0.000 | 0.000 | 0.000 |
| site send | 00:00:00.541 | 0.0% | 13566 | 0.000 | 0.040 | 0.096 |
| TOTAL: 24:00:22.481 | 24:00:20.328 | 100.0% | - | - | - | - |
INNfeed timer:
| Code region | Time | Pct | Invoked | Min(ms) | Avg(ms) | Max(ms) |
|---|---|---|---|---|---|---|
| article new | 00:00:00.025 | 0.0% | 13492 | 0.000 | 0.002 | 0.026 |
| article prepare | 00:00:00.000 | 0.0% | 84 | 0.000 | 0.000 | 0.000 |
| article read | 00:00:00.022 | 0.0% | 21 | 0.000 | 1.048 | 22.000 |
| backlog stats | 00:00:00.013 | 0.0% | 44873 | 0.000 | 0.000 | 0.010 |
| callbacks | 00:00:00.000 | 0.0% | 0 | 0.000 | 0.000 | 0.000 |
| data read | 00:00:00.167 | 0.0% | 27021 | 0.000 | 0.006 | 0.026 |
| data write | 00:00:00.223 | 0.0% | 13532 | 0.000 | 0.016 | 0.057 |
| idle | 23:57:57.637 | 100.0% | 44873 | 999.985 | 1922.707 | 4654.574 |
| status file | 00:00:00.049 | 0.0% | 156 | 0.000 | 0.314 | 1.000 |
| TOTAL: 23:57:58.552 | 23:57:58.136 | 100.0% | - | - | - | - |
nnrpd timer:
| Code region | Time | Pct | Invoked | Min(ms) | Avg(ms) | Max(ms) |
|---|---|---|---|---|---|---|
| idle | 00:00:06.957 | 38.6% | 437 | 7.167 | 15.920 | 25.815 |
| newnews | 00:00:00.000 | 0.0% | 0 | 0.000 | 0.000 | 0.000 |
| nntpwrite | 00:00:00.022 | 0.1% | 1505 | 0.000 | 0.015 | 0.048 |
| TOTAL: 00:00:18.036 | 00:00:06.979 | 38.7% | - | - | - | - |
Control commands to INND:
| Command | Number |
|---|---|
| L | 1 |
| flush | 3 |
| flushlogs | 2 |
| go | 2 |
| logmode | 2 |
| mode | 149 |
| name | 2 |
| pause | 2 |
| paused | 2 |
| reload | 2 |
| reserve | 2 |
| TOTAL: 11 | 169 |
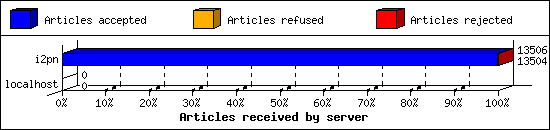
Incoming Feeds (INN):
| Server | Connects | Offered | Taken | Refused | Reject | %Accpt | Elapsed | |
|---|---|---|---|---|---|---|---|---|
| 1 | i2pn | 6 | 13506 | 13504 | 0 | 2 | 99% | 24:32:10 |
| 2 | localhost | 30 | 0 | 0 | 0 | 0 | 0% | 00:00:00 |
| TOTAL: 2 | 36 | 13506 | 13504 | 0 | 2 | 99% | 24:32:10 | |
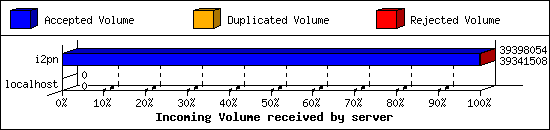
Incoming Volume (INN):
| Server | AcceptVol | DupVol | RejVol | TotalVol | %Acc | Vol/Art | |
|---|---|---|---|---|---|---|---|
| 1 | i2pn | 37.5 MB | 0.0 KB | 55.2 KB | 37.6 MB | 99% | 2.8 KB |
| 2 | localhost | 0.0 KB | 0.0 KB | 0.0 KB | 0.0 KB | 0% | 0 |
| TOTAL: 2 | 37.5 MB | 0.0 KB | 55.2 KB | 37.6 MB | 99% | 2.8 KB | |
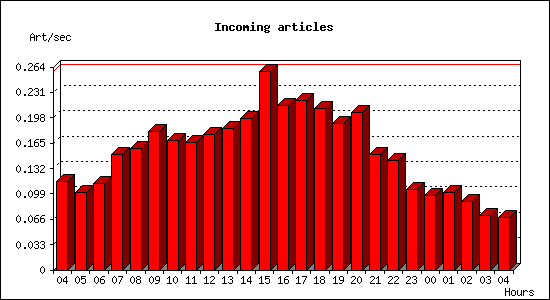
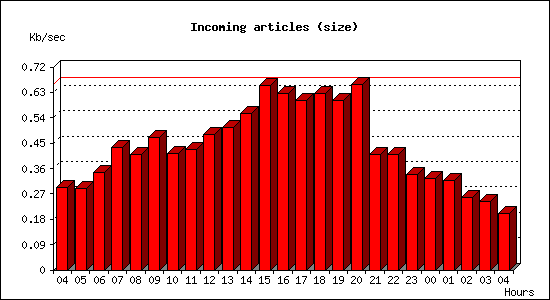
Incoming articles:
| Date | Articles | %Arts | Art/sec | Size | %Size | KB/sec |
|---|---|---|---|---|---|---|
| Jul 27 04:15:02 - 04:59:59 | 309 | 2.3% | 0.11 | 789.9 KB | 2.1% | 0.29 |
| Jul 27 05:00:00 - 05:59:59 | 365 | 2.7% | 0.10 | 1.0 MB | 2.7% | 0.29 |
| Jul 27 06:00:00 - 06:59:59 | 404 | 3.0% | 0.11 | 1.2 MB | 3.2% | 0.34 |
| Jul 27 07:00:00 - 07:59:59 | 540 | 4.0% | 0.15 | 1.5 MB | 4.1% | 0.43 |
| Jul 27 08:00:00 - 08:59:59 | 571 | 4.2% | 0.16 | 1.4 MB | 3.8% | 0.41 |
| Jul 27 09:00:00 - 09:59:59 | 649 | 4.8% | 0.18 | 1.6 MB | 4.4% | 0.47 |
| Jul 27 10:00:00 - 10:59:59 | 608 | 4.5% | 0.17 | 1.5 MB | 3.9% | 0.41 |
| Jul 27 11:00:00 - 11:59:59 | 599 | 4.4% | 0.17 | 1.5 MB | 4.0% | 0.43 |
| Jul 27 12:00:00 - 12:59:59 | 633 | 4.7% | 0.18 | 1.7 MB | 4.5% | 0.48 |
| Jul 27 13:00:00 - 13:59:59 | 663 | 4.9% | 0.18 | 1.8 MB | 4.7% | 0.51 |
| Jul 27 14:00:00 - 14:59:59 | 711 | 5.3% | 0.20 | 2.0 MB | 5.2% | 0.56 |
| Jul 27 15:00:00 - 15:59:59 | 928 | 6.9% | 0.26 | 2.3 MB | 6.1% | 0.65 |
| Jul 27 16:00:00 - 16:59:59 | 769 | 5.7% | 0.21 | 2.2 MB | 5.9% | 0.63 |
| Jul 27 17:00:00 - 17:59:59 | 792 | 5.9% | 0.22 | 2.1 MB | 5.6% | 0.60 |
| Jul 27 18:00:00 - 18:59:59 | 756 | 5.6% | 0.21 | 2.2 MB | 5.9% | 0.63 |
| Jul 27 19:00:00 - 19:59:59 | 686 | 5.1% | 0.19 | 2.1 MB | 5.6% | 0.60 |
| Jul 27 20:00:00 - 20:59:59 | 739 | 5.5% | 0.21 | 2.3 MB | 6.2% | 0.66 |
| Jul 27 21:00:00 - 21:59:59 | 539 | 4.0% | 0.15 | 1.4 MB | 3.8% | 0.41 |
| Jul 27 22:00:00 - 22:59:59 | 511 | 3.8% | 0.14 | 1.4 MB | 3.8% | 0.41 |
| Jul 27 23:00:00 - 23:59:59 | 379 | 2.8% | 0.11 | 1.2 MB | 3.2% | 0.34 |
| Jul 28 00:00:00 - 00:59:59 | 351 | 2.6% | 0.10 | 1.1 MB | 3.0% | 0.32 |
| Jul 28 01:00:00 - 01:59:59 | 361 | 2.7% | 0.10 | 1.1 MB | 3.0% | 0.32 |
| Jul 28 02:00:00 - 02:59:59 | 323 | 2.4% | 0.09 | 925.5 KB | 2.4% | 0.26 |
| Jul 28 03:00:00 - 03:59:59 | 256 | 1.9% | 0.07 | 873.2 KB | 2.3% | 0.24 |
| Jul 28 04:00:00 - 04:15:01 | 62 | 0.5% | 0.07 | 180.0 KB | 0.5% | 0.20 |
| TOTAL: 23:59:59 | 13504 | 100.0% | 0.16 | 37.5 MB | 100.0% | 0.44 |
Sites sending bad articles:
| Server | Total | Group | Dist | Duplic | Unapp | TooOld | Site | Line | Other | |
|---|---|---|---|---|---|---|---|---|---|---|
| 1 | i2pn | 237 | 2 | 0 | 0 | 0 | 0 | 0 | 0 | 235 |
| TOTAL: 1 | 237 | 2 | 0 | 0 | 0 | 0 | 0 | 0 | 235 | |
Unwanted newsgroups [Top 20]:
| Newsgroup | Count |
|---|---|
| 24hoursupport.helpdesk | 1 |
| hk.politics | 1 |
| TOTAL: 2 | 2 |
NoCeM on Spool:
| Id | Good | Bad | Unique | Total |
|---|---|---|---|---|
| bleachbot@httrack.com | 29 | 0 | 33 | 33 |
| TOTAL: 1 | 29 | 12 | 33 | 33 |
Miscellaneous innd statistics [Top 10]:
| Event | Server | Number |
|---|---|---|
| Including strange strings | ||
| i2pn | 235 | |
| TOTAL: 1 | 235 | |
| TOTAL: 1 | 235 | |
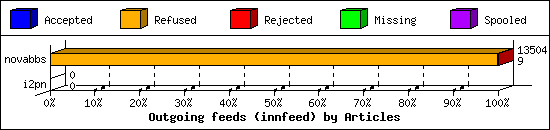
Outgoing Feeds (innfeed) by Articles:
| Server | Offered | Taken | Refused | Reject | Miss | Spool | %Took | Elapsed | |
|---|---|---|---|---|---|---|---|---|---|
| 1 | novabbs | 13516 | 9 | 13483 | 12 | 0 | 0 | 0% | 23:59:53 |
| 2 | i2pn | 0 | 0 | 0 | 0 | 0 | 0 | 0% | 00:10:00 |
| TOTAL: 2 | 13516 | 9 | 13483 | 12 | 0 | 0 | 0% | 24:09:53 | |
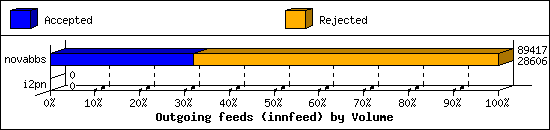
Outgoing Feeds (innfeed) by Volume:
| Server | AcceptVol | RejectVol | TotalVol | Volume/sec | Vol/Art | Elapsed | |
|---|---|---|---|---|---|---|---|
| 1 | novabbs | 27.9 KB | 59.4 KB | 87.3 KB | 0.0 KB/s | 4.2 KB | 23:59:53 |
| 2 | i2pn | 0.0 KB | 0.0 KB | 0.0 KB | 0.0 KB/s | 0 | 00:10:00 |
| TOTAL: 2 | 27.9 KB | 59.4 KB | 87.3 KB | 0.0 KB/s | 4.2 KB | 24:09:53 | |
NNRP readership statistics:
| System | Conn | Arts | Size | Groups | Post | Rej | Elapsed | |
|---|---|---|---|---|---|---|---|---|
| 1 | i2pn2.org | 43 | 0 | 0.0 KB | 0 | 0 | 0 | 00:00:17 |
| TOTAL: 1 | 43 | 0 | 0.0 KB | 0 | 0 | 0 | 00:00:17 | |
NNRP readership statistics (by domain):
| System | Conn | Arts | Size | Groups | Post | Rej | Elapsed | |
|---|---|---|---|---|---|---|---|---|
| 1 | *.org | 43 | 0 | 0.0 KB | 0 | 0 | 0 | 00:00:17 |
| TOTAL: 1 | 43 | 0 | 0.0 KB | 0 | 0 | 0 | 00:00:17 | |
NNRP auth users [Top 20]:
| User | Conn |
|---|---|
| i2pn2user | 43 |
| TOTAL: 1 | 43 |
NNRP total resource statistics [Top 20]:
| System | User(ms) | System(ms) | Idle(ms) | Elapsed |
|---|---|---|---|---|
| i2pn2.org | 2.244 | 0.304 | 4.062 | 00:00:17 |
| TOTAL: 1 | 2.244 | 0.304 | 4.062 | 00:00:17 |
