Log entries by program:
| Program name | Lines | %Lines | Size | %Size |
|---|---|---|---|---|
| inn | 13344 | 87.8% | 1.1 MB | 82.4% |
| innd | 1004 | 6.6% | 146.1 KB | 10.8% |
| innfeed | 598 | 3.9% | 71.0 KB | 5.2% |
| nnrpd | 213 | 1.4% | 17.9 KB | 1.3% |
| nocem | 33 | 0.2% | 3.6 KB | 0.3% |
| controlchan | 1 | 0.0% | 0.0 KB | 0.0% |
| TOTAL: 6 | 15193 | 100.0% | 1.3 MB | 100.0% |
History cache:
| Reason | Count | %Count |
|---|---|---|
| Do not exist | 12960 | 98.7% |
| Negative hits | 141 | 1.1% |
| Positive hits | 19 | 0.1% |
| Cache misses | 11 | 0.1% |
| TOTAL: 4 | 13131 | 100.0% |
INND timer:
| Code region | Time | Pct | Invoked | Min(ms) | Avg(ms) | Max(ms) |
|---|---|---|---|---|---|---|
| article cancel | 00:00:00.030 | 0.0% | 56 | 0.000 | 0.536 | 2.000 |
| article cleanup | 00:00:00.057 | 0.0% | 12967 | 0.000 | 0.004 | 0.043 |
| article logging | 00:00:00.325 | 0.0% | 13283 | 0.000 | 0.024 | 0.086 |
| article parse | 00:00:00.207 | 0.0% | 14309 | 0.000 | 0.014 | 0.057 |
| article write | 00:00:03.235 | 0.0% | 12955 | 0.040 | 0.250 | 3.769 |
| artlog/artcncl | 00:00:00.002 | 0.0% | 55 | 0.000 | 0.036 | 0.500 |
| data move | 00:00:00.003 | 0.0% | 15611 | 0.000 | 0.000 | 0.014 |
| hisgrep/artcncl | 00:00:00.001 | 0.0% | 37 | 0.000 | 0.027 | 0.167 |
| hishave/artcncl | 00:00:00.001 | 0.0% | 56 | 0.000 | 0.018 | 0.143 |
| history grep | 00:00:00.000 | 0.0% | 0 | 0.000 | 0.000 | 0.000 |
| history lookup | 00:00:00.104 | 0.0% | 13117 | 0.000 | 0.008 | 0.549 |
| history sync | 00:00:00.013 | 0.0% | 297 | 0.000 | 0.044 | 0.500 |
| history write | 00:00:00.571 | 0.0% | 12967 | 0.000 | 0.044 | 0.522 |
| hiswrite/artcncl | 00:00:00.002 | 0.0% | 19 | 0.000 | 0.105 | 0.500 |
| idle | 23:59:55.174 | 100.0% | 14818 | 3508.404 | 5830.421 | 15788.921 |
| nntp read | 00:00:00.330 | 0.0% | 14519 | 0.000 | 0.023 | 0.067 |
| overview write | 00:00:03.042 | 0.0% | 12955 | 0.020 | 0.235 | 4.129 |
| perl filter | 00:00:17.015 | 0.0% | 12967 | 1.093 | 1.312 | 2.029 |
| python filter | 00:00:00.000 | 0.0% | 0 | 0.000 | 0.000 | 0.000 |
| site send | 00:00:00.384 | 0.0% | 12973 | 0.000 | 0.030 | 0.093 |
| TOTAL: 24:00:22.522 | 24:00:20.496 | 100.0% | - | - | - | - |
INNfeed timer:
| Code region | Time | Pct | Invoked | Min(ms) | Avg(ms) | Max(ms) |
|---|---|---|---|---|---|---|
| article new | 00:00:00.020 | 0.0% | 12946 | 0.000 | 0.002 | 0.031 |
| article prepare | 00:00:00.000 | 0.0% | 88 | 0.000 | 0.000 | 0.000 |
| article read | 00:00:00.025 | 0.0% | 22 | 0.000 | 1.136 | 21.000 |
| backlog stats | 00:00:00.020 | 0.0% | 43273 | 0.000 | 0.000 | 0.009 |
| callbacks | 00:00:00.000 | 0.0% | 0 | 0.000 | 0.000 | 0.000 |
| data read | 00:00:00.155 | 0.0% | 25937 | 0.000 | 0.006 | 0.024 |
| data write | 00:00:00.184 | 0.0% | 12997 | 0.000 | 0.014 | 0.064 |
| idle | 23:59:35.960 | 100.0% | 43273 | 1204.948 | 1996.071 | 5716.714 |
| status file | 00:00:00.032 | 0.0% | 152 | 0.000 | 0.211 | 1.000 |
| TOTAL: 23:59:36.765 | 23:59:36.396 | 100.0% | - | - | - | - |
nnrpd timer:
| Code region | Time | Pct | Invoked | Min(ms) | Avg(ms) | Max(ms) |
|---|---|---|---|---|---|---|
| idle | 00:00:03.945 | 26.6% | 247 | 7.167 | 15.972 | 1818.000 |
| newnews | 00:00:00.000 | 0.0% | 0 | 0.000 | 0.000 | 0.000 |
| nntpwrite | 00:00:00.008 | 0.1% | 861 | 0.000 | 0.009 | 0.500 |
| TOTAL: 00:00:14.845 | 00:00:03.953 | 26.6% | - | - | - | - |
Control commands to INND:
| Command | Number |
|---|---|
| L | 1 |
| flush | 3 |
| flushlogs | 2 |
| go | 2 |
| logmode | 2 |
| mode | 149 |
| name | 2 |
| pause | 2 |
| paused | 2 |
| reload | 2 |
| reserve | 2 |
| TOTAL: 11 | 169 |
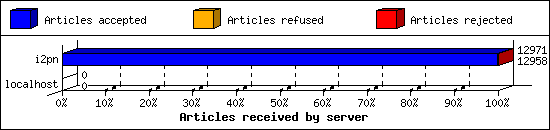
Incoming Feeds (INN):
| Server | Connects | Offered | Taken | Refused | Reject | %Accpt | Elapsed | |
|---|---|---|---|---|---|---|---|---|
| 1 | i2pn | 4 | 12971 | 12958 | 0 | 13 | 99% | 24:25:03 |
| 2 | localhost | 30 | 0 | 0 | 0 | 0 | 0% | 00:00:00 |
| TOTAL: 2 | 34 | 12971 | 12958 | 0 | 13 | 99% | 24:25:03 | |
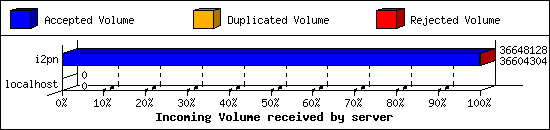
Incoming Volume (INN):
| Server | AcceptVol | DupVol | RejVol | TotalVol | %Acc | Vol/Art | |
|---|---|---|---|---|---|---|---|
| 1 | i2pn | 34.9 MB | 0.0 KB | 42.8 KB | 35.0 MB | 99% | 2.8 KB |
| 2 | localhost | 0.0 KB | 0.0 KB | 0.0 KB | 0.0 KB | 0% | 0 |
| TOTAL: 2 | 34.9 MB | 0.0 KB | 42.8 KB | 35.0 MB | 99% | 2.8 KB | |
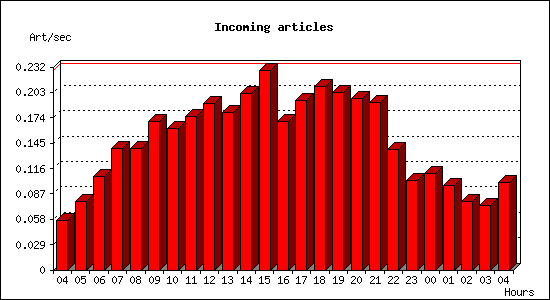
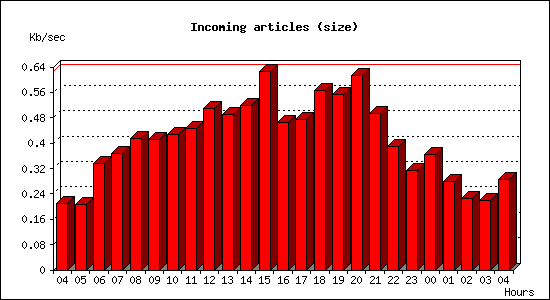
Incoming articles:
| Date | Articles | %Arts | Art/sec | Size | %Size | KB/sec |
|---|---|---|---|---|---|---|
| Jul 28 04:15:02 - 04:59:59 | 153 | 1.2% | 0.06 | 563.1 KB | 1.6% | 0.21 |
| Jul 28 05:00:00 - 05:59:59 | 280 | 2.2% | 0.08 | 738.4 KB | 2.1% | 0.21 |
| Jul 28 06:00:00 - 06:59:59 | 386 | 3.0% | 0.11 | 1.2 MB | 3.4% | 0.33 |
| Jul 28 07:00:00 - 07:59:59 | 501 | 3.9% | 0.14 | 1.3 MB | 3.7% | 0.37 |
| Jul 28 08:00:00 - 08:59:59 | 499 | 3.9% | 0.14 | 1.5 MB | 4.2% | 0.41 |
| Jul 28 09:00:00 - 09:59:59 | 610 | 4.7% | 0.17 | 1.4 MB | 4.1% | 0.41 |
| Jul 28 10:00:00 - 10:59:59 | 581 | 4.5% | 0.16 | 1.5 MB | 4.3% | 0.43 |
| Jul 28 11:00:00 - 11:59:59 | 631 | 4.9% | 0.18 | 1.6 MB | 4.5% | 0.45 |
| Jul 28 12:00:00 - 12:59:59 | 687 | 5.3% | 0.19 | 1.8 MB | 5.1% | 0.51 |
| Jul 28 13:00:00 - 13:59:59 | 646 | 5.0% | 0.18 | 1.7 MB | 4.9% | 0.49 |
| Jul 28 14:00:00 - 14:59:59 | 726 | 5.6% | 0.20 | 1.8 MB | 5.2% | 0.52 |
| Jul 28 15:00:00 - 15:59:59 | 822 | 6.3% | 0.23 | 2.2 MB | 6.3% | 0.63 |
| Jul 28 16:00:00 - 16:59:59 | 611 | 4.7% | 0.17 | 1.6 MB | 4.7% | 0.46 |
| Jul 28 17:00:00 - 17:59:59 | 696 | 5.4% | 0.19 | 1.7 MB | 4.8% | 0.47 |
| Jul 28 18:00:00 - 18:59:59 | 756 | 5.8% | 0.21 | 2.0 MB | 5.7% | 0.57 |
| Jul 28 19:00:00 - 19:59:59 | 732 | 5.6% | 0.20 | 1.9 MB | 5.6% | 0.55 |
| Jul 28 20:00:00 - 20:59:59 | 705 | 5.4% | 0.20 | 2.2 MB | 6.2% | 0.61 |
| Jul 28 21:00:00 - 21:59:59 | 689 | 5.3% | 0.19 | 1.7 MB | 5.0% | 0.49 |
| Jul 28 22:00:00 - 22:59:59 | 495 | 3.8% | 0.14 | 1.4 MB | 3.9% | 0.39 |
| Jul 28 23:00:00 - 23:59:59 | 370 | 2.9% | 0.10 | 1.1 MB | 3.2% | 0.31 |
| Jul 29 00:00:00 - 00:59:59 | 398 | 3.1% | 0.11 | 1.3 MB | 3.7% | 0.37 |
| Jul 29 01:00:00 - 01:59:59 | 347 | 2.7% | 0.10 | 1000.0 KB | 2.8% | 0.28 |
| Jul 29 02:00:00 - 02:59:59 | 280 | 2.2% | 0.08 | 808.7 KB | 2.3% | 0.22 |
| Jul 29 03:00:00 - 03:59:59 | 267 | 2.1% | 0.07 | 787.8 KB | 2.2% | 0.22 |
| Jul 29 04:00:00 - 04:15:01 | 90 | 0.7% | 0.10 | 256.6 KB | 0.7% | 0.28 |
| TOTAL: 23:59:59 | 12958 | 100.0% | 0.15 | 34.9 MB | 100.0% | 0.41 |
Sites sending bad articles:
| Server | Total | Group | Dist | Duplic | Unapp | TooOld | Site | Line | Other | |
|---|---|---|---|---|---|---|---|---|---|---|
| 1 | i2pn | 331 | 13 | 0 | 0 | 0 | 0 | 0 | 0 | 318 |
| TOTAL: 1 | 331 | 13 | 0 | 0 | 0 | 0 | 0 | 0 | 318 | |
Unwanted newsgroups [Top 20]:
| Newsgroup | Count |
|---|---|
| alt.pl.nieruchomosci.gielda | 11 |
| hk.politics | 1 |
| biz.mlm | 1 |
| TOTAL: 3 | 13 |
NoCeM on Spool:
| Id | Good | Bad | Unique | Total |
|---|---|---|---|---|
| bleachbot@httrack.com | 22 | 0 | 22 | 22 |
| TOTAL: 1 | 22 | 6 | 22 | 22 |
Miscellaneous innd statistics [Top 10]:
| Event | Server | Number |
|---|---|---|
| Including strange strings | ||
| i2pn | 318 | |
| TOTAL: 1 | 318 | |
| TOTAL: 1 | 318 | |
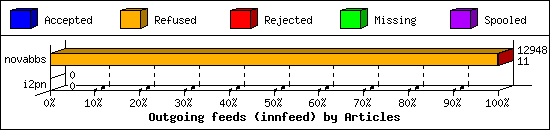
Outgoing Feeds (innfeed) by Articles:
| Server | Offered | Taken | Refused | Reject | Miss | Spool | %Took | Elapsed | |
|---|---|---|---|---|---|---|---|---|---|
| 1 | novabbs | 12972 | 11 | 12926 | 11 | 0 | 0 | 0% | 23:59:57 |
| 2 | i2pn | 0 | 0 | 0 | 0 | 0 | 0 | 0% | 00:10:00 |
| TOTAL: 2 | 12972 | 11 | 12926 | 11 | 0 | 0 | 0% | 24:09:57 | |
Outgoing Feeds (innfeed) by Volume:
| Server | AcceptVol | RejectVol | TotalVol | Volume/sec | Vol/Art | Elapsed | |
|---|---|---|---|---|---|---|---|
| 1 | novabbs | 34.2 KB | 23.4 KB | 57.6 KB | 0.0 KB/s | 2.6 KB | 23:59:57 |
| 2 | i2pn | 0.0 KB | 0.0 KB | 0.0 KB | 0.0 KB/s | 0 | 00:10:00 |
| TOTAL: 2 | 34.2 KB | 23.4 KB | 57.6 KB | 0.0 KB/s | 2.6 KB | 24:09:57 | |

NNRP readership statistics:
| System | Conn | Arts | Size | Groups | Post | Rej | Elapsed | |
|---|---|---|---|---|---|---|---|---|
| 1 | 198.20.87.98 | 1 | 0 | 0.0 KB | 0 | 0 | 0 | 00:00:02 |
| 2 | worker-18.sfj.corp.censys.io | 1 | 0 | 0.0 KB | 0 | 0 | 0 | 00:00:00 |
| 3 | i2pn2.org | 40 | 0 | 0.0 KB | 0 | 0 | 0 | 00:00:12 |
| TOTAL: 3 | 42 | 0 | 0.0 KB | 0 | 0 | 0 | 00:00:14 | |
NNRP readership statistics (by domain):
| System | Conn | Arts | Size | Groups | Post | Rej | Elapsed | |
|---|---|---|---|---|---|---|---|---|
| 1 | unresolved | 1 | 0 | 0.0 KB | 0 | 0 | 0 | 00:00:02 |
| 2 | *.org | 40 | 0 | 0.0 KB | 0 | 0 | 0 | 00:00:12 |
| 3 | *.sfj.corp.censys.io | 1 | 0 | 0.0 KB | 0 | 0 | 0 | 00:00:00 |
| TOTAL: 3 | 42 | 0 | 0.0 KB | 0 | 0 | 0 | 00:00:14 | |
NNRP auth users [Top 20]:
| User | Conn |
|---|---|
| i2pn2user | 40 |
| TOTAL: 1 | 40 |
NNRP total resource statistics [Top 20]:
| System | User(ms) | System(ms) | Idle(ms) | Elapsed |
|---|---|---|---|---|
| i2pn2.org | 1.808 | 0.236 | 3.676 | 00:00:12 |
| 198.20.87.98 | 0.044 | 0.000 | 0.000 | 00:00:02 |
| worker-18.sfj.corp.censys.io | 0.048 | 0.000 | 0.000 | 00:00:00 |
| TOTAL: 3 | 1.900 | 0.236 | 3.676 | 00:00:14 |
NNRP client timeouts [Top 20]:
| System | Conn | Peer |
|---|---|---|
| worker-18.sfj.corp.censys.io | 1 | 1 |
| TOTAL: 1 | 1 | 1 |
