Log entries by program:
| Program name | Lines | %Lines | Size | %Size |
|---|---|---|---|---|
| inn | 15612 | 87.8% | 1.3 MB | 83.0% |
| innd | 998 | 5.6% | 147.4 KB | 9.4% |
| innfeed | 620 | 3.5% | 72.9 KB | 4.7% |
| nnrpd | 513 | 2.9% | 42.4 KB | 2.7% |
| nocem | 38 | 0.2% | 4.0 KB | 0.3% |
| controlchan | 1 | 0.0% | 0.1 KB | 0.0% |
| TOTAL: 6 | 17782 | 100.0% | 1.5 MB | 100.0% |
History cache:
| Reason | Count | %Count |
|---|---|---|
| Do not exist | 15204 | 98.9% |
| Negative hits | 138 | 0.9% |
| Positive hits | 25 | 0.2% |
| Cache misses | 11 | 0.1% |
| TOTAL: 4 | 15378 | 100.0% |
INND timer:
| Code region | Time | Pct | Invoked | Min(ms) | Avg(ms) | Max(ms) |
|---|---|---|---|---|---|---|
| article cancel | 00:00:00.024 | 0.0% | 57 | 0.000 | 0.421 | 2.000 |
| article cleanup | 00:00:00.090 | 0.0% | 15224 | 0.000 | 0.006 | 0.048 |
| article logging | 00:00:00.430 | 0.0% | 15554 | 0.000 | 0.028 | 0.090 |
| article parse | 00:00:00.244 | 0.0% | 17088 | 0.000 | 0.014 | 0.045 |
| article write | 00:00:04.362 | 0.0% | 15221 | 0.087 | 0.287 | 1.844 |
| artlog/artcncl | 00:00:00.000 | 0.0% | 57 | 0.000 | 0.000 | 0.000 |
| data move | 00:00:00.010 | 0.0% | 19057 | 0.000 | 0.001 | 0.015 |
| hisgrep/artcncl | 00:00:00.001 | 0.0% | 41 | 0.000 | 0.024 | 0.200 |
| hishave/artcncl | 00:00:00.003 | 0.0% | 57 | 0.000 | 0.053 | 1.000 |
| history grep | 00:00:00.000 | 0.0% | 0 | 0.000 | 0.000 | 0.000 |
| history lookup | 00:00:01.314 | 0.0% | 15377 | 0.000 | 0.085 | 0.871 |
| history sync | 00:00:00.013 | 0.0% | 298 | 0.000 | 0.044 | 0.500 |
| history write | 00:00:03.023 | 0.0% | 15224 | 0.000 | 0.199 | 1.714 |
| hiswrite/artcncl | 00:00:00.003 | 0.0% | 16 | 0.167 | 0.188 | 0.200 |
| idle | 23:59:46.514 | 100.0% | 17698 | 2855.767 | 4881.146 | 13635.205 |
| nntp read | 00:00:00.461 | 0.0% | 17298 | 0.000 | 0.027 | 0.082 |
| overview write | 00:00:02.278 | 0.0% | 15221 | 0.024 | 0.150 | 1.741 |
| perl filter | 00:00:20.554 | 0.0% | 15224 | 1.013 | 1.350 | 2.000 |
| python filter | 00:00:00.000 | 0.0% | 0 | 0.000 | 0.000 | 0.000 |
| site send | 00:00:00.685 | 0.0% | 15229 | 0.000 | 0.045 | 0.128 |
| TOTAL: 24:00:22.280 | 24:00:20.009 | 100.0% | - | - | - | - |
INNfeed timer:
| Code region | Time | Pct | Invoked | Min(ms) | Avg(ms) | Max(ms) |
|---|---|---|---|---|---|---|
| article new | 00:00:00.021 | 0.0% | 15188 | 0.000 | 0.001 | 0.024 |
| article prepare | 00:00:00.000 | 0.0% | 520 | 0.000 | 0.000 | 0.000 |
| article read | 00:00:00.030 | 0.0% | 130 | 0.000 | 0.231 | 25.000 |
| backlog stats | 00:00:00.013 | 0.0% | 50323 | 0.000 | 0.000 | 0.009 |
| callbacks | 00:00:00.000 | 0.0% | 0 | 0.000 | 0.000 | 0.000 |
| data read | 00:00:00.182 | 0.0% | 30572 | 0.000 | 0.006 | 0.024 |
| data write | 00:00:00.297 | 0.0% | 15387 | 0.000 | 0.019 | 0.068 |
| idle | 23:57:58.231 | 100.0% | 50323 | 966.873 | 1714.489 | 4666.093 |
| status file | 00:00:00.048 | 0.0% | 160 | 0.000 | 0.300 | 2.000 |
| TOTAL: 23:57:59.235 | 23:57:58.822 | 100.0% | - | - | - | - |
nnrpd timer:
| Code region | Time | Pct | Invoked | Min(ms) | Avg(ms) | Max(ms) |
|---|---|---|---|---|---|---|
| idle | 00:00:16.593 | 45.5% | 602 | 0.000 | 27.563 | 9838.000 |
| newnews | 00:00:00.000 | 0.0% | 0 | 0.000 | 0.000 | 0.000 |
| nntpwrite | 00:00:00.029 | 0.1% | 2021 | 0.000 | 0.014 | 0.150 |
| readart | 00:00:00.220 | 0.6% | 25 | 3.700 | 8.800 | 21.000 |
| TOTAL: 00:00:36.504 | 00:00:16.842 | 46.1% | - | - | - | - |
Control commands to INND:
| Command | Number |
|---|---|
| L | 1 |
| flush | 3 |
| flushlogs | 2 |
| go | 2 |
| logmode | 2 |
| mode | 149 |
| name | 2 |
| pause | 2 |
| paused | 2 |
| reload | 2 |
| reserve | 2 |
| TOTAL: 11 | 169 |
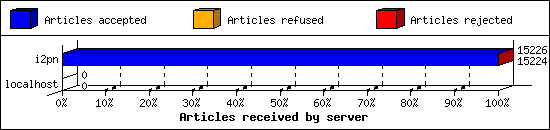
Incoming Feeds (INN):
| Server | Connects | Offered | Taken | Refused | Reject | %Accpt | Elapsed | |
|---|---|---|---|---|---|---|---|---|
| 1 | i2pn | 4 | 15226 | 15224 | 0 | 2 | 99% | 24:25:03 |
| 2 | localhost | 29 | 0 | 0 | 0 | 0 | 0% | 00:00:00 |
| TOTAL: 2 | 33 | 15226 | 15224 | 0 | 2 | 99% | 24:25:03 | |
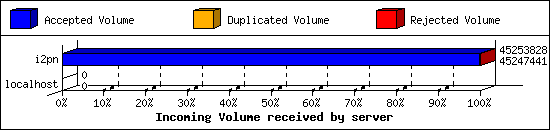
Incoming Volume (INN):
| Server | AcceptVol | DupVol | RejVol | TotalVol | %Acc | Vol/Art | |
|---|---|---|---|---|---|---|---|
| 1 | i2pn | 43.2 MB | 0.0 KB | 6.2 KB | 43.2 MB | 99% | 2.9 KB |
| 2 | localhost | 0.0 KB | 0.0 KB | 0.0 KB | 0.0 KB | 0% | 0 |
| TOTAL: 2 | 43.2 MB | 0.0 KB | 6.2 KB | 43.2 MB | 99% | 2.9 KB | |
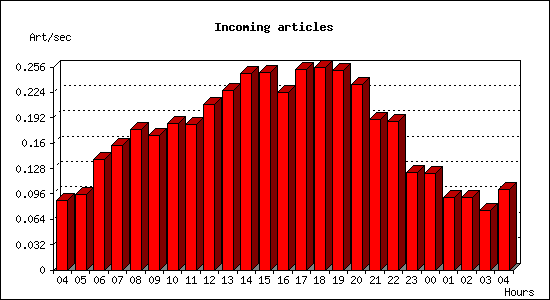
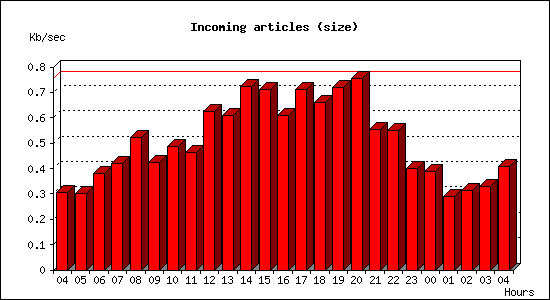
Incoming articles:
| Date | Articles | %Arts | Art/sec | Size | %Size | KB/sec |
|---|---|---|---|---|---|---|
| Jul 29 04:15:01 - 04:59:59 | 237 | 1.6% | 0.09 | 827.3 KB | 1.9% | 0.31 |
| Jul 29 05:00:00 - 05:59:59 | 345 | 2.3% | 0.10 | 1.1 MB | 2.4% | 0.30 |
| Jul 29 06:00:00 - 06:59:59 | 501 | 3.3% | 0.14 | 1.3 MB | 3.1% | 0.38 |
| Jul 29 07:00:00 - 07:59:59 | 566 | 3.7% | 0.16 | 1.5 MB | 3.4% | 0.42 |
| Jul 29 08:00:00 - 08:59:59 | 639 | 4.2% | 0.18 | 1.8 MB | 4.3% | 0.52 |
| Jul 29 09:00:00 - 09:59:59 | 610 | 4.0% | 0.17 | 1.5 MB | 3.5% | 0.43 |
| Jul 29 10:00:00 - 10:59:59 | 667 | 4.4% | 0.19 | 1.7 MB | 4.0% | 0.49 |
| Jul 29 11:00:00 - 11:59:59 | 659 | 4.3% | 0.18 | 1.6 MB | 3.8% | 0.46 |
| Jul 29 12:00:00 - 12:59:59 | 752 | 4.9% | 0.21 | 2.2 MB | 5.1% | 0.62 |
| Jul 29 13:00:00 - 13:59:59 | 813 | 5.3% | 0.23 | 2.1 MB | 5.0% | 0.61 |
| Jul 29 14:00:00 - 14:59:59 | 894 | 5.9% | 0.25 | 2.5 MB | 5.9% | 0.72 |
| Jul 29 15:00:00 - 15:59:59 | 895 | 5.9% | 0.25 | 2.5 MB | 5.8% | 0.71 |
| Jul 29 16:00:00 - 16:59:59 | 807 | 5.3% | 0.22 | 2.1 MB | 5.0% | 0.61 |
| Jul 29 17:00:00 - 17:59:59 | 912 | 6.0% | 0.25 | 2.5 MB | 5.8% | 0.71 |
| Jul 29 18:00:00 - 18:59:59 | 921 | 6.0% | 0.26 | 2.3 MB | 5.4% | 0.66 |
| Jul 29 19:00:00 - 19:59:59 | 905 | 5.9% | 0.25 | 2.5 MB | 5.9% | 0.72 |
| Jul 29 20:00:00 - 20:59:59 | 842 | 5.5% | 0.23 | 2.7 MB | 6.2% | 0.76 |
| Jul 29 21:00:00 - 21:59:59 | 684 | 4.5% | 0.19 | 1.9 MB | 4.5% | 0.55 |
| Jul 29 22:00:00 - 22:59:59 | 672 | 4.4% | 0.19 | 1.9 MB | 4.5% | 0.55 |
| Jul 29 23:00:00 - 23:59:59 | 444 | 2.9% | 0.12 | 1.4 MB | 3.3% | 0.40 |
| Jul 30 00:00:00 - 00:59:59 | 436 | 2.9% | 0.12 | 1.4 MB | 3.2% | 0.39 |
| Jul 30 01:00:00 - 01:59:59 | 329 | 2.2% | 0.09 | 1.0 MB | 2.3% | 0.29 |
| Jul 30 02:00:00 - 02:59:59 | 331 | 2.2% | 0.09 | 1.1 MB | 2.6% | 0.31 |
| Jul 30 03:00:00 - 03:59:59 | 272 | 1.8% | 0.08 | 1.2 MB | 2.7% | 0.33 |
| Jul 30 04:00:00 - 04:15:01 | 91 | 0.6% | 0.10 | 367.8 KB | 0.8% | 0.41 |
| TOTAL: 24:00:00 | 15224 | 100.0% | 0.18 | 43.2 MB | 100.0% | 0.51 |
Sites sending bad articles:
| Server | Total | Group | Dist | Duplic | Unapp | TooOld | Site | Line | Other | |
|---|---|---|---|---|---|---|---|---|---|---|
| 1 | i2pn | 330 | 2 | 0 | 0 | 0 | 0 | 0 | 0 | 328 |
| TOTAL: 1 | 330 | 2 | 0 | 0 | 0 | 0 | 0 | 0 | 328 | |
Unwanted newsgroups [Top 20]:
| Newsgroup | Count |
|---|---|
| alt.sex.girl | 1 |
| alt.pl.nieruchomosci.gielda | 1 |
| TOTAL: 2 | 2 |
NoCeM on Spool:
| Id | Good | Bad | Unique | Total |
|---|---|---|---|---|
| bleachbot@httrack.com | 21 | 0 | 23 | 23 |
| TOTAL: 1 | 21 | 13 | 23 | 23 |
Miscellaneous innd statistics [Top 10]:
| Event | Server | Number |
|---|---|---|
| Including strange strings | ||
| i2pn | 328 | |
| TOTAL: 1 | 328 | |
| TOTAL: 1 | 328 | |
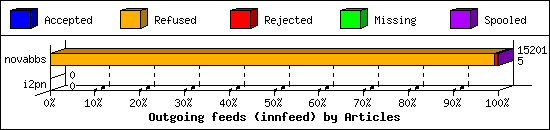
Outgoing Feeds (innfeed) by Articles:
| Server | Offered | Taken | Refused | Reject | Miss | Spool | %Took | Elapsed | |
|---|---|---|---|---|---|---|---|---|---|
| 1 | novabbs | 15257 | 5 | 15068 | 126 | 0 | 2 | 0% | 23:59:51 |
| 2 | i2pn | 0 | 0 | 0 | 0 | 0 | 0 | 0% | 00:10:00 |
| TOTAL: 2 | 15257 | 5 | 15068 | 126 | 0 | 2 | 0% | 24:09:51 | |
Outgoing Feeds (innfeed) by Volume:
| Server | AcceptVol | RejectVol | TotalVol | Volume/sec | Vol/Art | Elapsed | |
|---|---|---|---|---|---|---|---|
| 1 | novabbs | 12.9 KB | 293.7 KB | 306.6 KB | 0.0 KB/s | 2.3 KB | 23:59:51 |
| 2 | i2pn | 0.0 KB | 0.0 KB | 0.0 KB | 0.0 KB/s | 0 | 00:10:00 |
| TOTAL: 2 | 12.9 KB | 293.7 KB | 306.6 KB | 0.0 KB/s | 2.3 KB | 24:09:51 | |

NNRP readership statistics:
| System | Conn | Arts | Size | Groups | Post | Rej | Elapsed | |
|---|---|---|---|---|---|---|---|---|
| 1 | i2pn2.org | 94 | 25 | 77.0 KB | 25 | 0 | 0 | 00:00:26 |
| TOTAL: 1 | 94 | 25 | 77.0 KB | 25 | 0 | 0 | 00:00:36 | |
NNRP readership statistics (by domain):
| System | Conn | Arts | Size | Groups | Post | Rej | Elapsed | |
|---|---|---|---|---|---|---|---|---|
| 1 | *.org | 94 | 25 | 77.0 KB | 25 | 0 | 0 | 00:00:26 |
| 2 | unresolved | 1 | 0 | 0.0 KB | 0 | 0 | 0 | 00:00:09 |
| TOTAL: 2 | 95 | 25 | 77.0 KB | 25 | 0 | 0 | 00:00:36 | |
NNRP auth users [Top 20]:
| User | Conn |
|---|---|
| i2pn2user | 94 |
| TOTAL: 1 | 94 |
NNRP total resource statistics [Top 20]:
| System | User(ms) | System(ms) | Idle(ms) | Elapsed |
|---|---|---|---|---|
| i2pn2.org | 4.340 | 0.508 | 8.343 | 00:00:26 |
| 107.170.204.86 | 0.036 | 0.008 | 0.000 | 00:00:09 |
| TOTAL: 2 | 4.376 | 0.516 | 8.343 | 00:00:36 |
Curious NNRP server explorers [Top 20]:
| System | Conn |
|---|---|
| 107.170.204.86 | 1 |
| TOTAL: 1 | 1 |
Newsgroup request counts (by category):
| Category | Count | Pct | |
|---|---|---|---|
| 1 | rocksolid | 25 | 100.0% |
| TOTAL: 1 | 25 | 100.0% | |
Newsgroup request counts (by newsgroup) [Top 100]:
| Newsgroup | Count | |
|---|---|---|
| 1 | rocksolid.shared.test | 15 |
| 2 | rocksolid.shared.offtopic | 9 |
| 3 | rocksolid.shared.entertainment | 1 |
| TOTAL: 3 | 25 | |
