Log entries by program:
| Program name | Lines | %Lines | Size | %Size |
|---|---|---|---|---|
| inn | 16261 | 89.4% | 1.3 MB | 84.6% |
| innd | 1053 | 5.8% | 154.0 KB | 9.6% |
| innfeed | 607 | 3.3% | 69.6 KB | 4.3% |
| nnrpd | 203 | 1.1% | 16.8 KB | 1.0% |
| nocem | 57 | 0.3% | 6.0 KB | 0.4% |
| controlchan | 1 | 0.0% | 0.1 KB | 0.0% |
| TOTAL: 6 | 18182 | 100.0% | 1.6 MB | 100.0% |
History cache:
| Reason | Count | %Count |
|---|---|---|
| Do not exist | 15784 | 98.7% |
| Negative hits | 139 | 0.9% |
| Positive hits | 53 | 0.3% |
| Cache misses | 16 | 0.1% |
| TOTAL: 4 | 15992 | 100.0% |
INND timer:
| Code region | Time | Pct | Invoked | Min(ms) | Avg(ms) | Max(ms) |
|---|---|---|---|---|---|---|
| article cancel | 00:00:00.038 | 0.0% | 94 | 0.000 | 0.404 | 2.000 |
| article cleanup | 00:00:00.082 | 0.0% | 15800 | 0.000 | 0.005 | 0.038 |
| article logging | 00:00:00.414 | 0.0% | 16172 | 0.000 | 0.026 | 0.073 |
| article parse | 00:00:00.222 | 0.0% | 17715 | 0.000 | 0.013 | 0.041 |
| article write | 00:00:04.139 | 0.0% | 15799 | 0.088 | 0.262 | 1.424 |
| artlog/artcncl | 00:00:00.003 | 0.0% | 93 | 0.000 | 0.032 | 1.000 |
| data move | 00:00:00.011 | 0.0% | 19767 | 0.000 | 0.001 | 0.014 |
| hisgrep/artcncl | 00:00:00.002 | 0.0% | 76 | 0.000 | 0.026 | 0.333 |
| hishave/artcncl | 00:00:00.004 | 0.0% | 94 | 0.000 | 0.043 | 0.571 |
| history grep | 00:00:00.000 | 0.0% | 0 | 0.000 | 0.000 | 0.000 |
| history lookup | 00:00:00.377 | 0.0% | 15950 | 0.000 | 0.024 | 0.556 |
| history sync | 00:00:00.008 | 0.0% | 306 | 0.000 | 0.026 | 0.500 |
| history write | 00:00:01.042 | 0.0% | 15800 | 0.000 | 0.066 | 0.408 |
| hiswrite/artcncl | 00:00:00.000 | 0.0% | 18 | 0.000 | 0.000 | 0.000 |
| idle | 23:59:48.966 | 100.0% | 18228 | 2776.477 | 4739.355 | 14635.659 |
| nntp read | 00:00:00.464 | 0.0% | 17932 | 0.000 | 0.026 | 0.087 |
| overview write | 00:00:02.857 | 0.0% | 15799 | 0.029 | 0.181 | 1.583 |
| perl filter | 00:00:20.943 | 0.0% | 15800 | 1.102 | 1.326 | 2.033 |
| python filter | 00:00:00.000 | 0.0% | 0 | 0.000 | 0.000 | 0.000 |
| site send | 00:00:00.650 | 0.0% | 15846 | 0.000 | 0.041 | 0.110 |
| TOTAL: 24:00:22.834 | 24:00:20.222 | 100.0% | - | - | - | - |
INNfeed timer:
| Code region | Time | Pct | Invoked | Min(ms) | Avg(ms) | Max(ms) |
|---|---|---|---|---|---|---|
| article new | 00:00:00.020 | 0.0% | 15777 | 0.000 | 0.001 | 0.019 |
| article prepare | 00:00:00.000 | 0.0% | 136 | 0.000 | 0.000 | 0.000 |
| article read | 00:00:00.029 | 0.0% | 34 | 0.000 | 0.853 | 22.000 |
| backlog stats | 00:00:00.013 | 0.0% | 51808 | 0.000 | 0.000 | 0.003 |
| callbacks | 00:00:00.000 | 0.0% | 0 | 0.000 | 0.000 | 0.000 |
| data read | 00:00:00.198 | 0.0% | 31626 | 0.000 | 0.006 | 0.029 |
| data write | 00:00:00.283 | 0.0% | 15851 | 0.000 | 0.018 | 0.087 |
| idle | 23:57:48.329 | 100.0% | 51808 | 1017.907 | 1665.155 | 4330.252 |
| status file | 00:00:00.049 | 0.0% | 156 | 0.000 | 0.314 | 2.000 |
| TOTAL: 23:57:49.374 | 23:57:48.921 | 100.0% | - | - | - | - |
nnrpd timer:
| Code region | Time | Pct | Invoked | Min(ms) | Avg(ms) | Max(ms) |
|---|---|---|---|---|---|---|
| idle | 00:00:03.384 | 26.3% | 278 | 7.000 | 12.173 | 25.215 |
| newnews | 00:00:00.000 | 0.0% | 0 | 0.000 | 0.000 | 0.000 |
| nntpwrite | 00:00:00.005 | 0.0% | 966 | 0.000 | 0.005 | 0.048 |
| TOTAL: 00:00:12.868 | 00:00:03.389 | 26.3% | - | - | - | - |
Control commands to INND:
| Command | Number |
|---|---|
| L | 1 |
| flush | 3 |
| flushlogs | 2 |
| go | 2 |
| logmode | 2 |
| mode | 149 |
| name | 2 |
| pause | 2 |
| paused | 2 |
| reload | 2 |
| reserve | 2 |
| TOTAL: 11 | 169 |
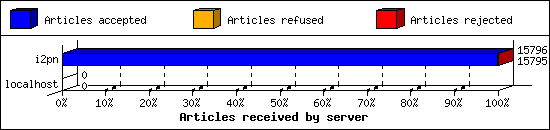
Incoming Feeds (INN):
| Server | Connects | Offered | Taken | Refused | Reject | %Accpt | Elapsed | |
|---|---|---|---|---|---|---|---|---|
| 1 | i2pn | 4 | 15796 | 15795 | 0 | 1 | 99% | 24:25:04 |
| 2 | localhost | 32 | 0 | 0 | 0 | 0 | 0% | 00:00:00 |
| TOTAL: 2 | 36 | 15796 | 15795 | 0 | 1 | 99% | 24:25:04 | |
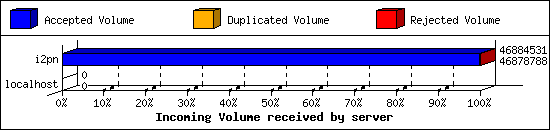
Incoming Volume (INN):
| Server | AcceptVol | DupVol | RejVol | TotalVol | %Acc | Vol/Art | |
|---|---|---|---|---|---|---|---|
| 1 | i2pn | 44.7 MB | 0.0 KB | 5.6 KB | 44.7 MB | 99% | 2.9 KB |
| 2 | localhost | 0.0 KB | 0.0 KB | 0.0 KB | 0.0 KB | 0% | 0 |
| TOTAL: 2 | 44.7 MB | 0.0 KB | 5.6 KB | 44.7 MB | 99% | 2.9 KB | |
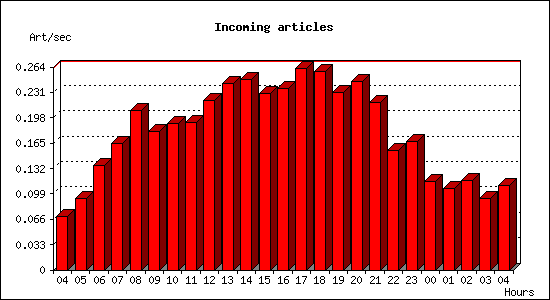
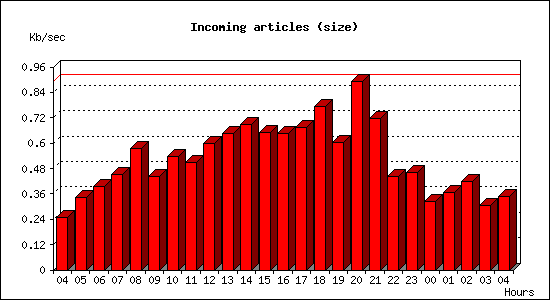
Incoming articles:
| Date | Articles | %Arts | Art/sec | Size | %Size | KB/sec |
|---|---|---|---|---|---|---|
| Jul 30 04:15:01 - 04:59:59 | 188 | 1.2% | 0.07 | 671.8 KB | 1.5% | 0.25 |
| Jul 30 05:00:00 - 05:59:59 | 334 | 2.1% | 0.09 | 1.2 MB | 2.7% | 0.34 |
| Jul 30 06:00:00 - 06:59:59 | 491 | 3.1% | 0.14 | 1.4 MB | 3.1% | 0.39 |
| Jul 30 07:00:00 - 07:59:59 | 591 | 3.7% | 0.16 | 1.6 MB | 3.5% | 0.45 |
| Jul 30 08:00:00 - 08:59:59 | 746 | 4.7% | 0.21 | 2.0 MB | 4.5% | 0.57 |
| Jul 30 09:00:00 - 09:59:59 | 648 | 4.1% | 0.18 | 1.6 MB | 3.5% | 0.44 |
| Jul 30 10:00:00 - 10:59:59 | 687 | 4.3% | 0.19 | 1.9 MB | 4.2% | 0.54 |
| Jul 30 11:00:00 - 11:59:59 | 691 | 4.4% | 0.19 | 1.8 MB | 4.0% | 0.51 |
| Jul 30 12:00:00 - 12:59:59 | 793 | 5.0% | 0.22 | 2.1 MB | 4.7% | 0.60 |
| Jul 30 13:00:00 - 13:59:59 | 874 | 5.5% | 0.24 | 2.3 MB | 5.1% | 0.65 |
| Jul 30 14:00:00 - 14:59:59 | 894 | 5.7% | 0.25 | 2.4 MB | 5.4% | 0.69 |
| Jul 30 15:00:00 - 15:59:59 | 827 | 5.2% | 0.23 | 2.3 MB | 5.1% | 0.65 |
| Jul 30 16:00:00 - 16:59:59 | 851 | 5.4% | 0.24 | 2.3 MB | 5.1% | 0.65 |
| Jul 30 17:00:00 - 17:59:59 | 944 | 6.0% | 0.26 | 2.4 MB | 5.3% | 0.67 |
| Jul 30 18:00:00 - 18:59:59 | 931 | 5.9% | 0.26 | 2.7 MB | 6.1% | 0.77 |
| Jul 30 19:00:00 - 19:59:59 | 829 | 5.2% | 0.23 | 2.1 MB | 4.7% | 0.60 |
| Jul 30 20:00:00 - 20:59:59 | 884 | 5.6% | 0.25 | 3.1 MB | 7.0% | 0.89 |
| Jul 30 21:00:00 - 21:59:59 | 782 | 5.0% | 0.22 | 2.5 MB | 5.6% | 0.72 |
| Jul 30 22:00:00 - 22:59:59 | 561 | 3.6% | 0.16 | 1.5 MB | 3.5% | 0.44 |
| Jul 30 23:00:00 - 23:59:59 | 603 | 3.8% | 0.17 | 1.6 MB | 3.6% | 0.46 |
| Jul 31 00:00:00 - 00:59:59 | 414 | 2.6% | 0.12 | 1.1 MB | 2.5% | 0.32 |
| Jul 31 01:00:00 - 01:59:59 | 380 | 2.4% | 0.11 | 1.3 MB | 2.9% | 0.37 |
| Jul 31 02:00:00 - 02:59:59 | 420 | 2.7% | 0.12 | 1.5 MB | 3.3% | 0.42 |
| Jul 31 03:00:00 - 03:59:59 | 333 | 2.1% | 0.09 | 1.1 MB | 2.4% | 0.30 |
| Jul 31 04:00:00 - 04:15:01 | 99 | 0.6% | 0.11 | 313.1 KB | 0.7% | 0.35 |
| TOTAL: 24:00:00 | 15795 | 100.0% | 0.18 | 44.7 MB | 100.0% | 0.53 |
Sites sending bad articles:
| Server | Total | Group | Dist | Duplic | Unapp | TooOld | Site | Line | Other | |
|---|---|---|---|---|---|---|---|---|---|---|
| 1 | i2pn | 375 | 1 | 0 | 0 | 0 | 0 | 0 | 0 | 374 |
| TOTAL: 1 | 375 | 1 | 0 | 0 | 0 | 0 | 0 | 0 | 374 | |
Unwanted newsgroups [Top 20]:
| Newsgroup | Count |
|---|---|
| hk.politics | 1 |
| TOTAL: 1 | 1 |
NoCeM on Spool:
| Id | Good | Bad | Unique | Total |
|---|---|---|---|---|
| bleachbot@httrack.com | 21 | 0 | 25 | 25 |
| TOTAL: 1 | 21 | 29 | 25 | 25 |
Miscellaneous innd statistics [Top 10]:
| Event | Server | Number |
|---|---|---|
| Including strange strings | ||
| i2pn | 374 | |
| TOTAL: 1 | 374 | |
| TOTAL: 1 | 374 | |
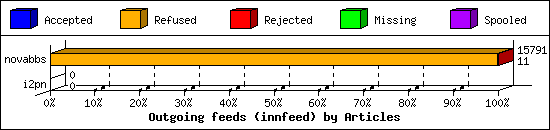
Outgoing Feeds (innfeed) by Articles:
| Server | Offered | Taken | Refused | Reject | Miss | Spool | %Took | Elapsed | |
|---|---|---|---|---|---|---|---|---|---|
| 1 | novabbs | 15822 | 11 | 15757 | 23 | 0 | 0 | 0% | 23:59:55 |
| 2 | i2pn | 0 | 0 | 0 | 0 | 0 | 0 | 0% | 00:10:00 |
| TOTAL: 2 | 15822 | 11 | 15757 | 23 | 0 | 0 | 0% | 24:09:55 | |
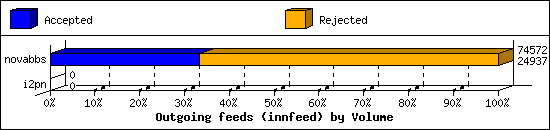
Outgoing Feeds (innfeed) by Volume:
| Server | AcceptVol | RejectVol | TotalVol | Volume/sec | Vol/Art | Elapsed | |
|---|---|---|---|---|---|---|---|
| 1 | novabbs | 24.4 KB | 48.5 KB | 72.8 KB | 0.0 KB/s | 2.1 KB | 23:59:55 |
| 2 | i2pn | 0.0 KB | 0.0 KB | 0.0 KB | 0.0 KB/s | 0 | 00:10:00 |
| TOTAL: 2 | 24.4 KB | 48.5 KB | 72.8 KB | 0.0 KB/s | 2.1 KB | 24:09:55 | |
NNRP readership statistics:
| System | Conn | Arts | Size | Groups | Post | Rej | Elapsed | |
|---|---|---|---|---|---|---|---|---|
| 1 | i2pn2.org | 36 | 0 | 0.0 KB | 0 | 0 | 0 | 00:00:12 |
| TOTAL: 1 | 36 | 0 | 0.0 KB | 0 | 0 | 0 | 00:00:12 | |
NNRP readership statistics (by domain):
| System | Conn | Arts | Size | Groups | Post | Rej | Elapsed | |
|---|---|---|---|---|---|---|---|---|
| 1 | *.org | 36 | 0 | 0.0 KB | 0 | 0 | 0 | 00:00:12 |
| TOTAL: 1 | 36 | 0 | 0.0 KB | 0 | 0 | 0 | 00:00:12 | |
NNRP auth users [Top 20]:
| User | Conn |
|---|---|
| i2pn2user | 36 |
| TOTAL: 1 | 36 |
NNRP total resource statistics [Top 20]:
| System | User(ms) | System(ms) | Idle(ms) | Elapsed |
|---|---|---|---|---|
| i2pn2.org | 1.780 | 0.220 | 3.664 | 00:00:12 |
| TOTAL: 1 | 1.780 | 0.220 | 3.664 | 00:00:12 |
