Log entries by program:
| Program name | Lines | %Lines | Size | %Size |
|---|---|---|---|---|
| inn | 17213 | 86.1% | 1.4 MB | 82.1% |
| nnrpd | 1071 | 5.4% | 97.5 KB | 5.6% |
| innd | 1063 | 5.3% | 157.7 KB | 9.0% |
| innfeed | 598 | 3.0% | 54.4 KB | 3.1% |
| nocem | 37 | 0.2% | 4.4 KB | 0.3% |
| controlchan | 1 | 0.0% | 0.1 KB | 0.0% |
| TOTAL: 6 | 19983 | 100.0% | 1.7 MB | 100.0% |
History cache:
| Reason | Count | %Count |
|---|---|---|
| Do not exist | 16639 | 97.9% |
| Negative hits | 285 | 1.7% |
| Positive hits | 44 | 0.3% |
| Cache misses | 32 | 0.2% |
| TOTAL: 4 | 17000 | 100.0% |
INND timer:
| Code region | Time | Pct | Invoked | Min(ms) | Avg(ms) | Max(ms) |
|---|---|---|---|---|---|---|
| article cancel | 00:00:00.067 | 0.0% | 96 | 0.000 | 0.698 | 2.143 |
| article cleanup | 00:00:00.091 | 0.0% | 16656 | 0.000 | 0.005 | 0.042 |
| article logging | 00:00:00.440 | 0.0% | 17119 | 0.000 | 0.026 | 0.102 |
| article parse | 00:00:00.277 | 0.0% | 19394 | 0.000 | 0.014 | 0.066 |
| article write | 00:00:10.619 | 0.0% | 16650 | 0.227 | 0.638 | 5.120 |
| artlog/artcncl | 00:00:00.002 | 0.0% | 96 | 0.000 | 0.021 | 0.167 |
| data move | 00:00:00.022 | 0.0% | 22660 | 0.000 | 0.001 | 0.012 |
| hisgrep/artcncl | 00:00:00.006 | 0.0% | 81 | 0.000 | 0.074 | 0.400 |
| hishave/artcncl | 00:00:00.004 | 0.0% | 96 | 0.000 | 0.042 | 0.500 |
| history grep | 00:00:00.000 | 0.0% | 0 | 0.000 | 0.000 | 0.000 |
| history lookup | 00:00:04.804 | 0.0% | 16956 | 0.000 | 0.283 | 2.014 |
| history sync | 00:00:00.015 | 0.0% | 304 | 0.000 | 0.049 | 1.000 |
| history write | 00:00:05.000 | 0.0% | 16656 | 0.000 | 0.300 | 2.304 |
| hiswrite/artcncl | 00:00:00.004 | 0.0% | 15 | 0.200 | 0.267 | 0.400 |
| idle | 23:59:28.698 | 99.9% | 20380 | 1763.079 | 4237.915 | 10526.596 |
| nntp read | 00:00:00.532 | 0.0% | 19760 | 0.000 | 0.027 | 0.084 |
| overview write | 00:00:03.917 | 0.0% | 16650 | 0.056 | 0.235 | 2.753 |
| perl filter | 00:00:24.360 | 0.0% | 16656 | 1.226 | 1.463 | 2.172 |
| python filter | 00:00:00.000 | 0.0% | 0 | 0.000 | 0.000 | 0.000 |
| site send | 00:00:00.759 | 0.0% | 16662 | 0.000 | 0.046 | 0.102 |
| TOTAL: 24:00:22.627 | 24:00:19.617 | 100.0% | - | - | - | - |
INNfeed timer:
| Code region | Time | Pct | Invoked | Min(ms) | Avg(ms) | Max(ms) |
|---|---|---|---|---|---|---|
| article new | 00:00:00.017 | 0.0% | 16607 | 0.000 | 0.001 | 0.020 |
| article prepare | 00:00:00.000 | 0.0% | 400 | 0.000 | 0.000 | 0.000 |
| article read | 00:00:00.027 | 0.0% | 100 | 0.000 | 0.270 | 21.000 |
| backlog stats | 00:00:00.012 | 0.0% | 54465 | 0.000 | 0.000 | 0.006 |
| callbacks | 00:00:00.000 | 0.0% | 0 | 0.000 | 0.000 | 0.000 |
| data read | 00:00:00.253 | 0.0% | 33364 | 0.000 | 0.008 | 0.036 |
| data write | 00:00:00.303 | 0.0% | 16761 | 0.000 | 0.018 | 0.053 |
| idle | 23:56:33.870 | 100.0% | 54465 | 632.588 | 1582.555 | 3684.840 |
| status file | 00:00:00.039 | 0.0% | 152 | 0.000 | 0.257 | 3.000 |
| TOTAL: 23:56:35.014 | 23:56:34.521 | 100.0% | - | - | - | - |
nnrpd timer:
| Code region | Time | Pct | Invoked | Min(ms) | Avg(ms) | Max(ms) |
|---|---|---|---|---|---|---|
| idle | 00:00:24.089 | 35.4% | 1385 | 6.833 | 17.393 | 9699.000 |
| newnews | 00:00:00.000 | 0.0% | 0 | 0.000 | 0.000 | 0.000 |
| nntpwrite | 00:00:00.041 | 0.1% | 4793 | 0.000 | 0.009 | 0.095 |
| readart | 00:00:00.074 | 0.1% | 11 | 3.750 | 6.727 | 22.000 |
| TOTAL: 00:01:08.073 | 00:00:24.204 | 35.6% | - | - | - | - |
Control commands to INND:
| Command | Number |
|---|---|
| L | 1 |
| flush | 3 |
| flushlogs | 2 |
| go | 2 |
| logmode | 2 |
| mode | 149 |
| name | 2 |
| pause | 2 |
| paused | 2 |
| reload | 2 |
| reserve | 2 |
| TOTAL: 11 | 169 |
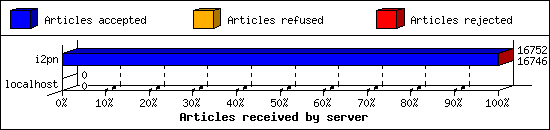
Incoming Feeds (INN):
| Server | Connects | Offered | Taken | Refused | Reject | %Accpt | Elapsed | |
|---|---|---|---|---|---|---|---|---|
| 1 | i2pn | 8 | 16752 | 16746 | 0 | 6 | 99% | 25:01:34 |
| 2 | localhost | 31 | 0 | 0 | 0 | 0 | 0% | 00:00:00 |
| TOTAL: 2 | 39 | 16752 | 16746 | 0 | 6 | 99% | 25:01:34 | |
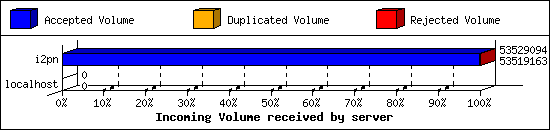
Incoming Volume (INN):
| Server | AcceptVol | DupVol | RejVol | TotalVol | %Acc | Vol/Art | |
|---|---|---|---|---|---|---|---|
| 1 | i2pn | 51.0 MB | 0.0 KB | 9.7 KB | 51.0 MB | 99% | 3.1 KB |
| 2 | localhost | 0.0 KB | 0.0 KB | 0.0 KB | 0.0 KB | 0% | 0 |
| TOTAL: 2 | 51.0 MB | 0.0 KB | 9.7 KB | 51.0 MB | 99% | 3.1 KB | |
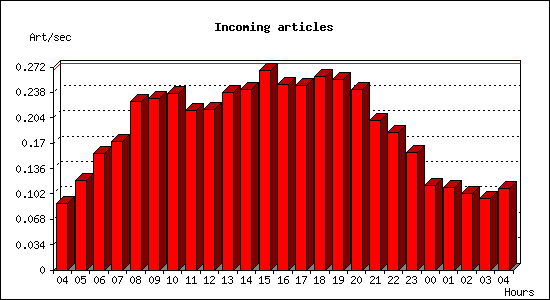
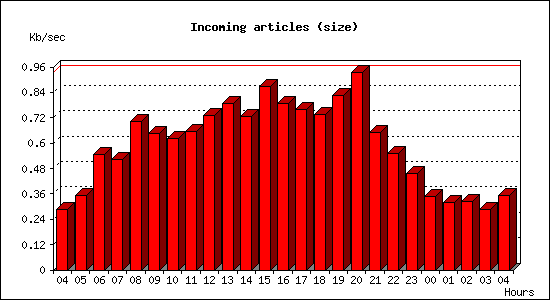
Incoming articles:
| Date | Articles | %Arts | Art/sec | Size | %Size | KB/sec |
|---|---|---|---|---|---|---|
| Aug 1 04:15:01 - 04:59:59 | 241 | 1.4% | 0.09 | 767.9 KB | 1.5% | 0.28 |
| Aug 1 05:00:00 - 05:59:59 | 430 | 2.6% | 0.12 | 1.2 MB | 2.4% | 0.35 |
| Aug 1 06:00:00 - 06:59:59 | 563 | 3.4% | 0.16 | 1.9 MB | 3.8% | 0.55 |
| Aug 1 07:00:00 - 07:59:59 | 621 | 3.7% | 0.17 | 1.8 MB | 3.6% | 0.52 |
| Aug 1 08:00:00 - 08:59:59 | 812 | 4.9% | 0.23 | 2.5 MB | 4.9% | 0.70 |
| Aug 1 09:00:00 - 09:59:59 | 825 | 5.0% | 0.23 | 2.3 MB | 4.5% | 0.65 |
| Aug 1 10:00:00 - 10:59:59 | 851 | 5.1% | 0.24 | 2.2 MB | 4.3% | 0.62 |
| Aug 1 11:00:00 - 11:59:59 | 767 | 4.6% | 0.21 | 2.3 MB | 4.5% | 0.65 |
| Aug 1 12:00:00 - 12:59:59 | 773 | 4.6% | 0.21 | 2.6 MB | 5.1% | 0.73 |
| Aug 1 13:00:00 - 13:59:59 | 857 | 5.1% | 0.24 | 2.8 MB | 5.5% | 0.79 |
| Aug 1 14:00:00 - 14:59:59 | 871 | 5.2% | 0.24 | 2.6 MB | 5.0% | 0.73 |
| Aug 1 15:00:00 - 15:59:59 | 960 | 5.8% | 0.27 | 3.1 MB | 6.0% | 0.87 |
| Aug 1 16:00:00 - 16:59:59 | 895 | 5.4% | 0.25 | 2.8 MB | 5.5% | 0.79 |
| Aug 1 17:00:00 - 17:59:59 | 890 | 5.3% | 0.25 | 2.7 MB | 5.3% | 0.76 |
| Aug 1 18:00:00 - 18:59:59 | 931 | 5.6% | 0.26 | 2.6 MB | 5.1% | 0.74 |
| Aug 1 19:00:00 - 19:59:59 | 918 | 5.5% | 0.26 | 2.9 MB | 5.7% | 0.83 |
| Aug 1 20:00:00 - 20:59:59 | 871 | 5.2% | 0.24 | 3.3 MB | 6.5% | 0.93 |
| Aug 1 21:00:00 - 21:59:59 | 721 | 4.3% | 0.20 | 2.3 MB | 4.5% | 0.65 |
| Aug 1 22:00:00 - 22:59:59 | 665 | 4.0% | 0.18 | 1.9 MB | 3.8% | 0.55 |
| Aug 1 23:00:00 - 23:59:59 | 568 | 3.4% | 0.16 | 1.6 MB | 3.2% | 0.46 |
| Aug 2 00:00:00 - 00:59:59 | 407 | 2.4% | 0.11 | 1.2 MB | 2.4% | 0.35 |
| Aug 2 01:00:00 - 01:59:59 | 399 | 2.4% | 0.11 | 1.1 MB | 2.2% | 0.32 |
| Aug 2 02:00:00 - 02:59:59 | 370 | 2.2% | 0.10 | 1.1 MB | 2.2% | 0.32 |
| Aug 2 03:00:00 - 03:59:59 | 345 | 2.1% | 0.10 | 1.0 MB | 2.0% | 0.29 |
| Aug 2 04:00:00 - 04:15:01 | 98 | 0.6% | 0.11 | 317.0 KB | 0.6% | 0.35 |
| TOTAL: 24:00:00 | 16649 | 100.0% | 0.19 | 50.8 MB | 100.0% | 0.60 |
Sites sending bad articles:
| Server | Total | Group | Dist | Duplic | Unapp | TooOld | Site | Line | Other | |
|---|---|---|---|---|---|---|---|---|---|---|
| 1 | i2pn | 469 | 6 | 0 | 0 | 0 | 0 | 0 | 0 | 463 |
| TOTAL: 1 | 469 | 6 | 0 | 0 | 0 | 0 | 0 | 0 | 463 | |
Unwanted newsgroups [Top 20]:
| Newsgroup | Count |
|---|---|
| alt.soupdragons | 4 |
| alt.jokes | 1 |
| 24hoursupport.helpdesk | 1 |
| TOTAL: 3 | 6 |
NoCeM on Spool:
| Id | Good | Bad | Unique | Total |
|---|---|---|---|---|
| bleachbot@httrack.com | 21 | 0 | 27 | 27 |
| TOTAL: 1 | 21 | 10 | 27 | 27 |
Miscellaneous innd statistics [Top 10]:
| Event | Server | Number |
|---|---|---|
| Including strange strings | ||
| i2pn | 463 | |
| TOTAL: 1 | 463 | |
| TOTAL: 1 | 463 | |
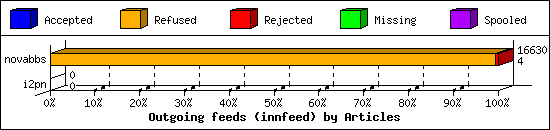
Outgoing Feeds (innfeed) by Articles:
| Server | Offered | Taken | Refused | Reject | Miss | Spool | %Took | Elapsed | |
|---|---|---|---|---|---|---|---|---|---|
| 1 | novabbs | 16682 | 4 | 16530 | 96 | 0 | 0 | 0% | 23:59:58 |
| 2 | i2pn | 0 | 0 | 0 | 0 | 0 | 0 | 0% | 00:10:00 |
| TOTAL: 2 | 16682 | 4 | 16530 | 96 | 0 | 0 | 0% | 24:09:58 | |
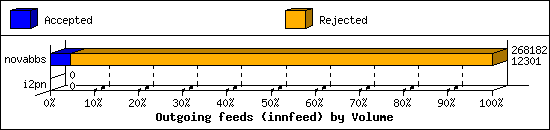
Outgoing Feeds (innfeed) by Volume:
| Server | AcceptVol | RejectVol | TotalVol | Volume/sec | Vol/Art | Elapsed | |
|---|---|---|---|---|---|---|---|
| 1 | novabbs | 12.0 KB | 249.9 KB | 261.9 KB | 0.0 KB/s | 2.6 KB | 23:59:58 |
| 2 | i2pn | 0.0 KB | 0.0 KB | 0.0 KB | 0.0 KB/s | 0 | 00:10:00 |
| TOTAL: 2 | 12.0 KB | 249.9 KB | 261.9 KB | 0.0 KB/s | 2.6 KB | 24:09:58 | |
NNRP readership statistics:
| System | Conn | Arts | Size | Groups | Post | Rej | Elapsed | |
|---|---|---|---|---|---|---|---|---|
| 1 | i2pn2.org | 198 | 11 | 18.3 KB | 11 | 0 | 0 | 00:00:57 |
| TOTAL: 1 | 198 | 11 | 18.3 KB | 11 | 0 | 0 | 00:01:07 | |
NNRP readership statistics (by domain):
| System | Conn | Arts | Size | Groups | Post | Rej | Elapsed | |
|---|---|---|---|---|---|---|---|---|
| 1 | *.org | 198 | 11 | 18.3 KB | 11 | 0 | 0 | 00:00:57 |
| 2 | unresolved | 1 | 0 | 0.0 KB | 0 | 0 | 0 | 00:00:09 |
| TOTAL: 2 | 199 | 11 | 18.3 KB | 11 | 0 | 0 | 00:01:07 | |
NNRP auth users [Top 20]:
| User | Conn |
|---|---|
| i2pn2user | 198 |
| TOTAL: 1 | 198 |
NNRP total resource statistics [Top 20]:
| System | User(ms) | System(ms) | Idle(ms) | Elapsed |
|---|---|---|---|---|
| i2pn2.org | 8.996 | 1.192 | 18.620 | 00:00:57 |
| 162.243.150.8 | 0.044 | 0.000 | 0.000 | 00:00:09 |
| TOTAL: 2 | 9.040 | 1.192 | 18.620 | 00:01:07 |
Curious NNRP server explorers [Top 20]:
| System | Conn |
|---|---|
| 162.243.150.8 | 1 |
| TOTAL: 1 | 1 |
Newsgroup request counts (by category):
| Category | Count | Pct | |
|---|---|---|---|
| 1 | rocksolid | 11 | 100.0% |
| TOTAL: 1 | 11 | 100.0% | |
Newsgroup request counts (by newsgroup) [Top 100]:
| Newsgroup | Count | |
|---|---|---|
| 1 | rocksolid.shared.encryption | 8 |
| 2 | rocksolid.shared.tor | 2 |
| 3 | rocksolid.shared.hacking | 1 |
| TOTAL: 3 | 11 | |
