Log entries by program:
| Program name | Lines | %Lines | Size | %Size |
|---|---|---|---|---|
| inn | 14340 | 84.0% | 1.2 MB | 79.5% |
| nnrpd | 1055 | 6.2% | 87.4 KB | 5.8% |
| innd | 1024 | 6.0% | 147.6 KB | 9.8% |
| innfeed | 607 | 3.6% | 68.3 KB | 4.5% |
| nocem | 29 | 0.2% | 2.9 KB | 0.2% |
| controlchan | 12 | 0.1% | 2.2 KB | 0.1% |
| pgpverify | 1 | 0.0% | 0.1 KB | 0.0% |
| TOTAL: 7 | 17068 | 100.0% | 1.5 MB | 100.0% |
History cache:
| Reason | Count | %Count |
|---|---|---|
| Do not exist | 13907 | 97.7% |
| Negative hits | 288 | 2.0% |
| Positive hits | 27 | 0.2% |
| Cache misses | 13 | 0.1% |
| TOTAL: 4 | 14235 | 100.0% |
INND timer:
| Code region | Time | Pct | Invoked | Min(ms) | Avg(ms) | Max(ms) |
|---|---|---|---|---|---|---|
| article cancel | 00:00:00.015 | 0.0% | 48 | 0.000 | 0.312 | 3.000 |
| article cleanup | 00:00:00.078 | 0.0% | 13919 | 0.000 | 0.006 | 0.038 |
| article logging | 00:00:00.371 | 0.0% | 14291 | 0.000 | 0.026 | 0.067 |
| article parse | 00:00:00.193 | 0.0% | 15407 | 0.000 | 0.013 | 0.043 |
| article write | 00:00:05.258 | 0.0% | 13917 | 0.146 | 0.378 | 1.898 |
| artlog/artcncl | 00:00:00.000 | 0.0% | 48 | 0.000 | 0.000 | 0.000 |
| data move | 00:00:00.014 | 0.0% | 17091 | 0.000 | 0.001 | 0.017 |
| hisgrep/artcncl | 00:00:00.001 | 0.0% | 40 | 0.000 | 0.025 | 1.000 |
| hishave/artcncl | 00:00:00.000 | 0.0% | 48 | 0.000 | 0.000 | 0.000 |
| history grep | 00:00:00.000 | 0.0% | 0 | 0.000 | 0.000 | 0.000 |
| history lookup | 00:00:00.122 | 0.0% | 14220 | 0.000 | 0.009 | 0.053 |
| history sync | 00:00:00.018 | 0.0% | 310 | 0.000 | 0.058 | 0.500 |
| history write | 00:00:00.995 | 0.0% | 13919 | 0.000 | 0.071 | 0.259 |
| hiswrite/artcncl | 00:00:00.000 | 0.0% | 8 | 0.000 | 0.000 | 0.000 |
| idle | 23:59:49.397 | 100.0% | 16387 | 2359.791 | 5271.825 | 12245.020 |
| nntp read | 00:00:00.405 | 0.0% | 15762 | 0.000 | 0.026 | 0.073 |
| overview write | 00:00:03.795 | 0.0% | 13917 | 0.000 | 0.273 | 29.278 |
| perl filter | 00:00:18.997 | 0.0% | 13919 | 1.138 | 1.365 | 2.133 |
| python filter | 00:00:00.000 | 0.0% | 0 | 0.000 | 0.000 | 0.000 |
| site send | 00:00:00.619 | 0.0% | 13939 | 0.000 | 0.044 | 0.111 |
| TOTAL: 24:00:22.910 | 24:00:20.278 | 100.0% | - | - | - | - |
INNfeed timer:
| Code region | Time | Pct | Invoked | Min(ms) | Avg(ms) | Max(ms) |
|---|---|---|---|---|---|---|
| article new | 00:00:00.015 | 0.0% | 13905 | 0.000 | 0.001 | 0.024 |
| article prepare | 00:00:00.000 | 0.0% | 112 | 0.000 | 0.000 | 0.000 |
| article read | 00:00:00.028 | 0.0% | 28 | 0.000 | 1.000 | 6.750 |
| backlog stats | 00:00:00.016 | 0.0% | 46274 | 0.000 | 0.000 | 0.006 |
| callbacks | 00:00:00.000 | 0.0% | 0 | 0.000 | 0.000 | 0.000 |
| data read | 00:00:00.179 | 0.0% | 27868 | 0.000 | 0.006 | 0.029 |
| data write | 00:00:00.246 | 0.0% | 14020 | 0.000 | 0.018 | 0.061 |
| idle | 23:57:26.188 | 100.0% | 46274 | 814.891 | 1863.815 | 4642.142 |
| status file | 00:00:00.044 | 0.0% | 156 | 0.000 | 0.282 | 1.000 |
| TOTAL: 23:57:27.116 | 23:57:26.716 | 100.0% | - | - | - | - |
nnrpd timer:
| Code region | Time | Pct | Invoked | Min(ms) | Avg(ms) | Max(ms) |
|---|---|---|---|---|---|---|
| idle | 00:00:14.161 | 25.1% | 1363 | 7.000 | 10.390 | 251.000 |
| newnews | 00:00:00.000 | 0.0% | 0 | 0.000 | 0.000 | 0.000 |
| nntpwrite | 00:00:00.041 | 0.1% | 4740 | 0.000 | 0.009 | 0.095 |
| TOTAL: 00:00:56.334 | 00:00:14.202 | 25.2% | - | - | - | - |
Control commands to INND:
| Command | Number |
|---|---|
| L | 1 |
| flush | 3 |
| flushlogs | 2 |
| go | 2 |
| logmode | 2 |
| mode | 149 |
| name | 2 |
| pause | 2 |
| paused | 2 |
| reload | 2 |
| reserve | 2 |
| TOTAL: 11 | 169 |
Control Channel:
| Sender | newgroup | rmgroup | Other | Bad PGP | DoIt | OK |
|---|---|---|---|---|---|---|
| moderator@dana.de | 0 | 0 | 1 | 1 | 0 | 1 |
| TOTAL | 0 | 0 | 1 | 1 | 0 | 1 |
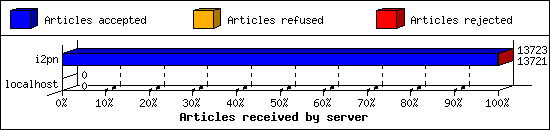
Incoming Feeds (INN):
| Server | Connects | Offered | Taken | Refused | Reject | %Accpt | Elapsed | |
|---|---|---|---|---|---|---|---|---|
| 1 | i2pn | 7 | 13723 | 13721 | 0 | 2 | 99% | 23:53:50 |
| 2 | localhost | 30 | 0 | 0 | 0 | 0 | 0% | 00:00:00 |
| TOTAL: 2 | 37 | 13723 | 13721 | 0 | 2 | 99% | 23:53:50 | |
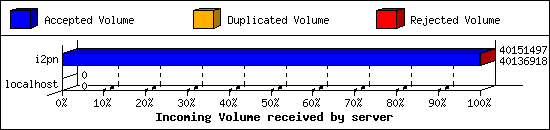
Incoming Volume (INN):
| Server | AcceptVol | DupVol | RejVol | TotalVol | %Acc | Vol/Art | |
|---|---|---|---|---|---|---|---|
| 1 | i2pn | 38.3 MB | 0.0 KB | 14.2 KB | 38.3 MB | 99% | 2.9 KB |
| 2 | localhost | 0.0 KB | 0.0 KB | 0.0 KB | 0.0 KB | 0% | 0 |
| TOTAL: 2 | 38.3 MB | 0.0 KB | 14.2 KB | 38.3 MB | 99% | 2.9 KB | |
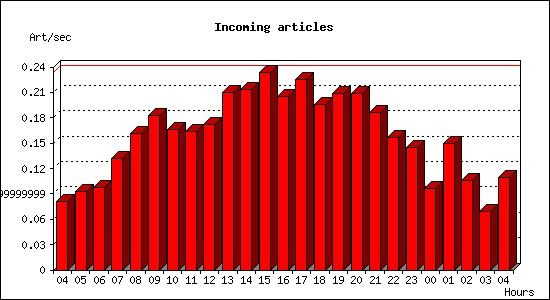
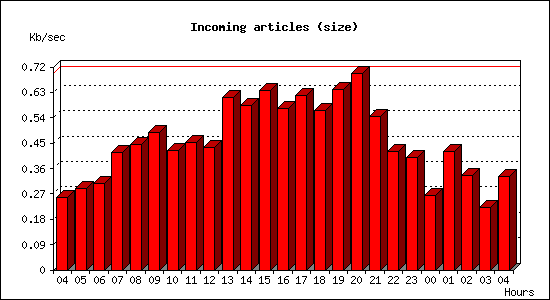
Incoming articles:
| Date | Articles | %Arts | Art/sec | Size | %Size | KB/sec |
|---|---|---|---|---|---|---|
| Aug 3 04:15:02 - 04:59:59 | 220 | 1.6% | 0.08 | 698.1 KB | 1.8% | 0.26 |
| Aug 3 05:00:00 - 05:59:59 | 332 | 2.4% | 0.09 | 1.0 MB | 2.6% | 0.29 |
| Aug 3 06:00:00 - 06:59:59 | 353 | 2.5% | 0.10 | 1.1 MB | 2.8% | 0.31 |
| Aug 3 07:00:00 - 07:59:59 | 475 | 3.4% | 0.13 | 1.5 MB | 3.8% | 0.42 |
| Aug 3 08:00:00 - 08:59:59 | 583 | 4.2% | 0.16 | 1.6 MB | 4.0% | 0.44 |
| Aug 3 09:00:00 - 09:59:59 | 656 | 4.7% | 0.18 | 1.7 MB | 4.4% | 0.49 |
| Aug 3 10:00:00 - 10:59:59 | 598 | 4.3% | 0.17 | 1.5 MB | 3.8% | 0.42 |
| Aug 3 11:00:00 - 11:59:59 | 591 | 4.2% | 0.16 | 1.6 MB | 4.1% | 0.45 |
| Aug 3 12:00:00 - 12:59:59 | 620 | 4.5% | 0.17 | 1.5 MB | 3.9% | 0.43 |
| Aug 3 13:00:00 - 13:59:59 | 756 | 5.4% | 0.21 | 2.2 MB | 5.5% | 0.61 |
| Aug 3 14:00:00 - 14:59:59 | 767 | 5.5% | 0.21 | 2.0 MB | 5.3% | 0.58 |
| Aug 3 15:00:00 - 15:59:59 | 840 | 6.0% | 0.23 | 2.2 MB | 5.7% | 0.64 |
| Aug 3 16:00:00 - 16:59:59 | 737 | 5.3% | 0.20 | 2.0 MB | 5.2% | 0.57 |
| Aug 3 17:00:00 - 17:59:59 | 812 | 5.8% | 0.23 | 2.2 MB | 5.6% | 0.62 |
| Aug 3 18:00:00 - 18:59:59 | 705 | 5.1% | 0.20 | 2.0 MB | 5.1% | 0.57 |
| Aug 3 19:00:00 - 19:59:59 | 750 | 5.4% | 0.21 | 2.3 MB | 5.8% | 0.64 |
| Aug 3 20:00:00 - 20:59:59 | 752 | 5.4% | 0.21 | 2.5 MB | 6.3% | 0.70 |
| Aug 3 21:00:00 - 21:59:59 | 672 | 4.8% | 0.19 | 1.9 MB | 4.9% | 0.54 |
| Aug 3 22:00:00 - 22:59:59 | 566 | 4.1% | 0.16 | 1.5 MB | 3.8% | 0.42 |
| Aug 3 23:00:00 - 23:59:59 | 522 | 3.8% | 0.14 | 1.4 MB | 3.6% | 0.40 |
| Aug 4 00:00:00 - 00:59:59 | 345 | 2.5% | 0.10 | 950.7 KB | 2.4% | 0.26 |
| Aug 4 01:00:00 - 01:59:59 | 537 | 3.9% | 0.15 | 1.5 MB | 3.8% | 0.42 |
| Aug 4 02:00:00 - 02:59:59 | 382 | 2.7% | 0.11 | 1.2 MB | 3.0% | 0.33 |
| Aug 4 03:00:00 - 03:59:59 | 247 | 1.8% | 0.07 | 792.1 KB | 2.0% | 0.22 |
| Aug 4 04:00:00 - 04:15:01 | 99 | 0.7% | 0.11 | 299.6 KB | 0.8% | 0.33 |
| TOTAL: 23:59:59 | 13917 | 100.0% | 0.16 | 38.9 MB | 100.0% | 0.46 |
Sites sending bad articles:
| Server | Total | Group | Dist | Duplic | Unapp | TooOld | Site | Line | Other | |
|---|---|---|---|---|---|---|---|---|---|---|
| 1 | i2pn | 374 | 2 | 0 | 0 | 0 | 0 | 0 | 0 | 372 |
| TOTAL: 1 | 374 | 2 | 0 | 0 | 0 | 0 | 0 | 0 | 372 | |
Unwanted newsgroups [Top 20]:
| Newsgroup | Count |
|---|---|
| alt.sex.girl | 1 |
| hk.politics | 1 |
| TOTAL: 2 | 2 |
NoCeM on Spool:
| Id | Good | Bad | Unique | Total |
|---|---|---|---|---|
| bleachbot@httrack.com | 17 | 0 | 18 | 18 |
| TOTAL: 1 | 17 | 6 | 18 | 18 |
Miscellaneous innd statistics [Top 10]:
| Event | Server | Number |
|---|---|---|
| Including strange strings | ||
| i2pn | 372 | |
| TOTAL: 1 | 372 | |
| TOTAL: 1 | 372 | |
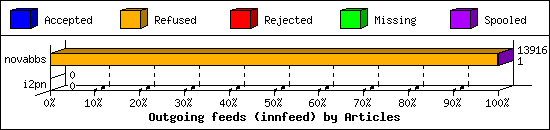
Outgoing Feeds (innfeed) by Articles:
| Server | Offered | Taken | Refused | Reject | Miss | Spool | %Took | Elapsed | |
|---|---|---|---|---|---|---|---|---|---|
| 1 | novabbs | 14003 | 1 | 13887 | 27 | 0 | 1 | 0% | 23:59:52 |
| 2 | i2pn | 0 | 0 | 0 | 0 | 0 | 0 | 0% | 00:10:00 |
| TOTAL: 2 | 14003 | 1 | 13887 | 27 | 0 | 1 | 0% | 24:09:52 | |
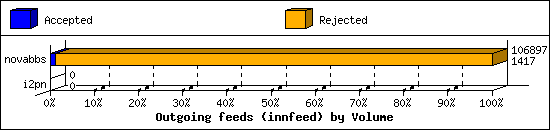
Outgoing Feeds (innfeed) by Volume:
| Server | AcceptVol | RejectVol | TotalVol | Volume/sec | Vol/Art | Elapsed | |
|---|---|---|---|---|---|---|---|
| 1 | novabbs | 1.4 KB | 103.0 KB | 104.4 KB | 0.0 KB/s | 3.7 KB | 23:59:52 |
| 2 | i2pn | 0.0 KB | 0.0 KB | 0.0 KB | 0.0 KB/s | 0 | 00:10:00 |
| TOTAL: 2 | 1.4 KB | 103.0 KB | 104.4 KB | 0.0 KB/s | 3.7 KB | 24:09:52 | |
NNRP readership statistics:
| System | Conn | Arts | Size | Groups | Post | Rej | Elapsed | |
|---|---|---|---|---|---|---|---|---|
| 1 | i2pn2.org | 197 | 0 | 0.0 KB | 0 | 0 | 0 | 00:00:55 |
| 2 | 106.75.64.59 | 1 | 0 | 0.0 KB | 0 | 0 | 0 | 00:00:00 |
| 3 | worker-18.sfj.corp.censys.io | 1 | 0 | 0.0 KB | 0 | 0 | 0 | 00:00:00 |
| TOTAL: 3 | 199 | 0 | 0.0 KB | 0 | 0 | 0 | 00:00:55 | |
NNRP readership statistics (by domain):
| System | Conn | Arts | Size | Groups | Post | Rej | Elapsed | |
|---|---|---|---|---|---|---|---|---|
| 1 | unresolved | 1 | 0 | 0.0 KB | 0 | 0 | 0 | 00:00:00 |
| 2 | *.org | 197 | 0 | 0.0 KB | 0 | 0 | 0 | 00:00:55 |
| 3 | *.sfj.corp.censys.io | 1 | 0 | 0.0 KB | 0 | 0 | 0 | 00:00:00 |
| TOTAL: 3 | 199 | 0 | 0.0 KB | 0 | 0 | 0 | 00:00:55 | |
NNRP auth users [Top 20]:
| User | Conn |
|---|---|
| i2pn2user | 197 |
| TOTAL: 1 | 197 |
NNRP total resource statistics [Top 20]:
| System | User(ms) | System(ms) | Idle(ms) | Elapsed |
|---|---|---|---|---|
| i2pn2.org | 8.648 | 1.252 | 18.372 | 00:00:55 |
| 106.75.64.59 | 0.036 | 0.008 | 0.000 | 00:00:00 |
| worker-18.sfj.corp.censys.io | 0.048 | 0.000 | 0.000 | 00:00:00 |
| TOTAL: 3 | 8.732 | 1.260 | 18.372 | 00:00:55 |
NNRP client timeouts [Top 20]:
| System | Conn | Peer |
|---|---|---|
| worker-18.sfj.corp.censys.io | 1 | 1 |
| TOTAL: 1 | 1 | 1 |
