Log entries by program:
| Program name | Lines | %Lines | Size | %Size |
|---|---|---|---|---|
| inn | 14419 | 88.7% | 1.2 MB | 83.5% |
| innd | 1055 | 6.5% | 154.1 KB | 10.6% |
| innfeed | 600 | 3.7% | 69.2 KB | 4.8% |
| nnrpd | 133 | 0.8% | 11.1 KB | 0.8% |
| nocem | 42 | 0.3% | 3.8 KB | 0.3% |
| controlchan | 1 | 0.0% | 0.1 KB | 0.0% |
| TOTAL: 6 | 16250 | 100.0% | 1.4 MB | 100.0% |
History cache:
| Reason | Count | %Count |
|---|---|---|
| Do not exist | 14088 | 97.6% |
| Negative hits | 287 | 2.0% |
| Positive hits | 33 | 0.2% |
| Cache misses | 27 | 0.2% |
| TOTAL: 4 | 14435 | 100.0% |
INND timer:
| Code region | Time | Pct | Invoked | Min(ms) | Avg(ms) | Max(ms) |
|---|---|---|---|---|---|---|
| article cancel | 00:00:00.039 | 0.0% | 83 | 0.000 | 0.470 | 2.000 |
| article cleanup | 00:00:00.090 | 0.0% | 14089 | 0.000 | 0.006 | 0.048 |
| article logging | 00:00:00.408 | 0.0% | 14343 | 0.000 | 0.028 | 0.095 |
| article parse | 00:00:00.203 | 0.0% | 15885 | 0.000 | 0.013 | 0.053 |
| article write | 00:00:05.667 | 0.0% | 14078 | 0.091 | 0.403 | 9.648 |
| artlog/artcncl | 00:00:00.001 | 0.0% | 81 | 0.000 | 0.012 | 1.000 |
| data move | 00:00:00.006 | 0.0% | 17890 | 0.000 | 0.000 | 0.014 |
| hisgrep/artcncl | 00:00:00.002 | 0.0% | 64 | 0.000 | 0.031 | 0.125 |
| hishave/artcncl | 00:00:00.000 | 0.0% | 83 | 0.000 | 0.000 | 0.000 |
| history grep | 00:00:00.000 | 0.0% | 0 | 0.000 | 0.000 | 0.000 |
| history lookup | 00:00:00.068 | 0.0% | 14389 | 0.000 | 0.005 | 0.048 |
| history sync | 00:00:00.024 | 0.0% | 307 | 0.000 | 0.078 | 2.500 |
| history write | 00:00:00.655 | 0.0% | 14089 | 0.000 | 0.046 | 3.118 |
| hiswrite/artcncl | 00:00:00.000 | 0.0% | 19 | 0.000 | 0.000 | 0.000 |
| idle | 23:59:49.358 | 100.0% | 16516 | 2549.387 | 5230.647 | 12767.468 |
| nntp read | 00:00:00.411 | 0.0% | 16247 | 0.000 | 0.025 | 0.082 |
| overview write | 00:00:02.638 | 0.0% | 14078 | 0.044 | 0.187 | 2.835 |
| perl filter | 00:00:19.536 | 0.0% | 14089 | 1.052 | 1.387 | 2.301 |
| python filter | 00:00:00.000 | 0.0% | 0 | 0.000 | 0.000 | 0.000 |
| site send | 00:00:00.711 | 0.0% | 14110 | 0.000 | 0.050 | 0.138 |
| TOTAL: 24:00:23.147 | 24:00:19.817 | 100.0% | - | - | - | - |
INNfeed timer:
| Code region | Time | Pct | Invoked | Min(ms) | Avg(ms) | Max(ms) |
|---|---|---|---|---|---|---|
| article new | 00:00:00.033 | 0.0% | 14069 | 0.000 | 0.002 | 0.026 |
| article prepare | 00:00:00.000 | 0.0% | 420 | 0.000 | 0.000 | 0.000 |
| article read | 00:00:00.027 | 0.0% | 105 | 0.000 | 0.257 | 22.000 |
| backlog stats | 00:00:00.014 | 0.0% | 46957 | 0.000 | 0.000 | 0.005 |
| callbacks | 00:00:00.000 | 0.0% | 0 | 0.000 | 0.000 | 0.000 |
| data read | 00:00:00.209 | 0.0% | 28321 | 0.000 | 0.007 | 0.032 |
| data write | 00:00:00.275 | 0.0% | 14257 | 0.000 | 0.019 | 0.063 |
| idle | 23:59:56.779 | 100.0% | 46957 | 1108.726 | 1839.913 | 4878.634 |
| status file | 00:00:00.056 | 0.0% | 152 | 0.000 | 0.368 | 2.000 |
| TOTAL: 23:59:57.819 | 23:59:57.393 | 100.0% | - | - | - | - |
nnrpd timer:
| Code region | Time | Pct | Invoked | Min(ms) | Avg(ms) | Max(ms) |
|---|---|---|---|---|---|---|
| idle | 00:00:05.796 | 30.6% | 168 | 0.000 | 34.500 | 3172.000 |
| newnews | 00:00:00.000 | 0.0% | 0 | 0.000 | 0.000 | 0.000 |
| nntpwrite | 00:00:00.005 | 0.0% | 562 | 0.000 | 0.009 | 0.077 |
| TOTAL: 00:00:18.942 | 00:00:05.801 | 30.6% | - | - | - | - |
Control commands to INND:
| Command | Number |
|---|---|
| L | 1 |
| flush | 3 |
| flushlogs | 2 |
| go | 2 |
| logmode | 2 |
| mode | 149 |
| name | 2 |
| pause | 2 |
| paused | 2 |
| reload | 2 |
| reserve | 2 |
| TOTAL: 11 | 169 |
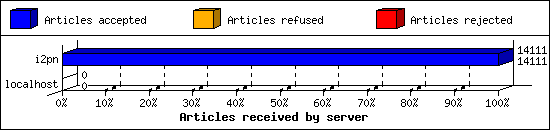
Incoming Feeds (INN):
| Server | Connects | Offered | Taken | Refused | Reject | %Accpt | Elapsed | |
|---|---|---|---|---|---|---|---|---|
| 1 | i2pn | 7 | 14111 | 14111 | 0 | 0 | 100% | 24:50:37 |
| 2 | localhost | 32 | 0 | 0 | 0 | 0 | 0% | 00:00:00 |
| TOTAL: 2 | 39 | 14111 | 14111 | 0 | 0 | 100% | 24:50:37 | |
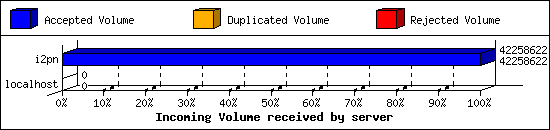
Incoming Volume (INN):
| Server | AcceptVol | DupVol | RejVol | TotalVol | %Acc | Vol/Art | |
|---|---|---|---|---|---|---|---|
| 1 | i2pn | 40.3 MB | 0.0 KB | 0.0 KB | 40.3 MB | 100% | 2.9 KB |
| 2 | localhost | 0.0 KB | 0.0 KB | 0.0 KB | 0.0 KB | 0% | 0 |
| TOTAL: 2 | 40.3 MB | 0.0 KB | 0.0 KB | 40.3 MB | 100% | 2.9 KB | |
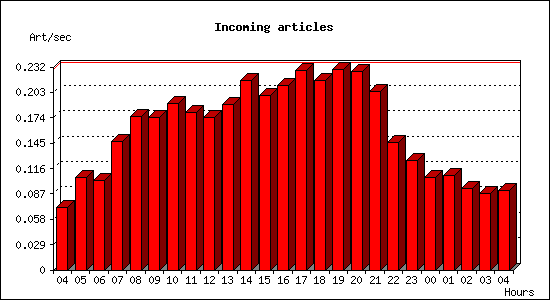
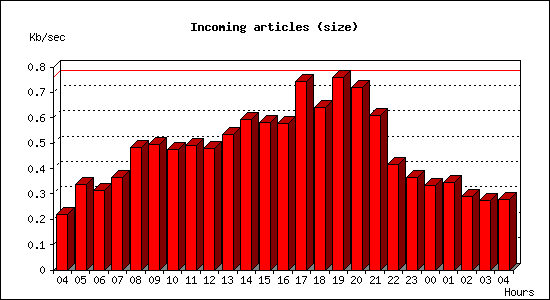
Incoming articles:
| Date | Articles | %Arts | Art/sec | Size | %Size | KB/sec |
|---|---|---|---|---|---|---|
| Aug 4 04:15:01 - 04:59:59 | 194 | 1.4% | 0.07 | 592.9 KB | 1.4% | 0.22 |
| Aug 4 05:00:00 - 05:59:59 | 381 | 2.7% | 0.11 | 1.2 MB | 3.0% | 0.34 |
| Aug 4 06:00:00 - 06:59:59 | 367 | 2.6% | 0.10 | 1.1 MB | 2.7% | 0.31 |
| Aug 4 07:00:00 - 07:59:59 | 528 | 3.8% | 0.15 | 1.3 MB | 3.2% | 0.36 |
| Aug 4 08:00:00 - 08:59:59 | 633 | 4.5% | 0.18 | 1.7 MB | 4.2% | 0.48 |
| Aug 4 09:00:00 - 09:59:59 | 626 | 4.4% | 0.17 | 1.7 MB | 4.3% | 0.49 |
| Aug 4 10:00:00 - 10:59:59 | 683 | 4.9% | 0.19 | 1.7 MB | 4.2% | 0.47 |
| Aug 4 11:00:00 - 11:59:59 | 647 | 4.6% | 0.18 | 1.7 MB | 4.3% | 0.49 |
| Aug 4 12:00:00 - 12:59:59 | 627 | 4.5% | 0.17 | 1.7 MB | 4.2% | 0.48 |
| Aug 4 13:00:00 - 13:59:59 | 682 | 4.8% | 0.19 | 1.9 MB | 4.7% | 0.53 |
| Aug 4 14:00:00 - 14:59:59 | 781 | 5.5% | 0.22 | 2.1 MB | 5.2% | 0.59 |
| Aug 4 15:00:00 - 15:59:59 | 718 | 5.1% | 0.20 | 2.0 MB | 5.1% | 0.58 |
| Aug 4 16:00:00 - 16:59:59 | 760 | 5.4% | 0.21 | 2.0 MB | 5.0% | 0.58 |
| Aug 4 17:00:00 - 17:59:59 | 819 | 5.8% | 0.23 | 2.6 MB | 6.5% | 0.74 |
| Aug 4 18:00:00 - 18:59:59 | 778 | 5.5% | 0.22 | 2.2 MB | 5.6% | 0.64 |
| Aug 4 19:00:00 - 19:59:59 | 823 | 5.8% | 0.23 | 2.7 MB | 6.6% | 0.76 |
| Aug 4 20:00:00 - 20:59:59 | 817 | 5.8% | 0.23 | 2.5 MB | 6.3% | 0.72 |
| Aug 4 21:00:00 - 21:59:59 | 733 | 5.2% | 0.20 | 2.1 MB | 5.3% | 0.61 |
| Aug 4 22:00:00 - 22:59:59 | 524 | 3.7% | 0.15 | 1.5 MB | 3.6% | 0.41 |
| Aug 4 23:00:00 - 23:59:59 | 451 | 3.2% | 0.13 | 1.3 MB | 3.2% | 0.36 |
| Aug 5 00:00:00 - 00:59:59 | 381 | 2.7% | 0.11 | 1.2 MB | 2.9% | 0.33 |
| Aug 5 01:00:00 - 01:59:59 | 388 | 2.8% | 0.11 | 1.2 MB | 3.0% | 0.34 |
| Aug 5 02:00:00 - 02:59:59 | 336 | 2.4% | 0.09 | 1.0 MB | 2.5% | 0.29 |
| Aug 5 03:00:00 - 03:59:59 | 314 | 2.2% | 0.09 | 981.2 KB | 2.4% | 0.27 |
| Aug 5 04:00:00 - 04:15:01 | 82 | 0.6% | 0.09 | 251.8 KB | 0.6% | 0.28 |
| TOTAL: 24:00:00 | 14073 | 100.0% | 0.16 | 40.2 MB | 100.0% | 0.48 |
Sites sending bad articles:
| Server | Total | Group | Dist | Duplic | Unapp | TooOld | Site | Line | Other | |
|---|---|---|---|---|---|---|---|---|---|---|
| 1 | i2pn | 266 | 11 | 0 | 0 | 0 | 0 | 0 | 0 | 255 |
| TOTAL: 1 | 266 | 11 | 0 | 0 | 0 | 0 | 0 | 0 | 255 | |
Unwanted newsgroups [Top 20]:
| Newsgroup | Count |
|---|---|
| alt.pl.nieruchomosci.gielda | 11 |
| TOTAL: 1 | 11 |
NoCeM on Spool:
| Id | Good | Bad | Unique | Total |
|---|---|---|---|---|
| bleachbot@httrack.com | 25 | 0 | 26 | 26 |
| TOTAL: 1 | 25 | 11 | 26 | 26 |
Miscellaneous innd statistics [Top 10]:
| Event | Server | Number |
|---|---|---|
| Including strange strings | ||
| i2pn | 255 | |
| TOTAL: 1 | 255 | |
| TOTAL: 1 | 255 | |
Outgoing Feeds (innfeed) by Articles:
| Server | Offered | Taken | Refused | Reject | Miss | Spool | %Took | Elapsed | |
|---|---|---|---|---|---|---|---|---|---|
| 1 | novabbs | 14146 | 4 | 13964 | 101 | 0 | 0 | 0% | 23:59:58 |
| 2 | i2pn | 0 | 0 | 0 | 0 | 0 | 0 | 0% | 00:10:00 |
| TOTAL: 2 | 14146 | 4 | 13964 | 101 | 0 | 0 | 0% | 24:09:58 | |

Outgoing Feeds (innfeed) by Volume:
| Server | AcceptVol | RejectVol | TotalVol | Volume/sec | Vol/Art | Elapsed | |
|---|---|---|---|---|---|---|---|
| 1 | novabbs | 9.6 KB | 218.9 KB | 228.6 KB | 0.0 KB/s | 2.2 KB | 23:59:58 |
| 2 | i2pn | 0.0 KB | 0.0 KB | 0.0 KB | 0.0 KB/s | 0 | 00:10:00 |
| TOTAL: 2 | 9.6 KB | 218.9 KB | 228.6 KB | 0.0 KB/s | 2.2 KB | 24:09:58 | |

NNRP readership statistics:
| System | Conn | Arts | Size | Groups | Post | Rej | Elapsed | |
|---|---|---|---|---|---|---|---|---|
| 1 | 164.52.24.176 | 3 | 0 | 0.0 KB | 0 | 0 | 0 | 00:00:12 |
| 2 | scan-141.security.ipip.net | 1 | 0 | 0.0 KB | 0 | 0 | 0 | 00:00:00 |
| 3 | i2pn2.org | 17 | 0 | 0.0 KB | 0 | 0 | 0 | 00:00:06 |
| TOTAL: 3 | 21 | 0 | 0.0 KB | 0 | 0 | 0 | 00:00:19 | |
NNRP readership statistics (by domain):
| System | Conn | Arts | Size | Groups | Post | Rej | Elapsed | |
|---|---|---|---|---|---|---|---|---|
| 1 | unresolved | 3 | 0 | 0.0 KB | 0 | 0 | 0 | 00:00:12 |
| 2 | *.security.ipip.net | 1 | 0 | 0.0 KB | 0 | 0 | 0 | 00:00:00 |
| 3 | *.org | 17 | 0 | 0.0 KB | 0 | 0 | 0 | 00:00:06 |
| TOTAL: 3 | 21 | 0 | 0.0 KB | 0 | 0 | 0 | 00:00:19 | |
NNRP auth users [Top 20]:
| User | Conn |
|---|---|
| i2pn2user | 17 |
| TOTAL: 1 | 17 |
NNRP total resource statistics [Top 20]:
| System | User(ms) | System(ms) | Idle(ms) | Elapsed |
|---|---|---|---|---|
| 164.52.24.176 | 0.172 | 0.028 | 0.000 | 00:00:12 |
| i2pn2.org | 0.908 | 0.100 | 1.937 | 00:00:06 |
| scan-141.security.ipip.net | 0.044 | 0.004 | 0.000 | 00:00:00 |
| TOTAL: 3 | 1.124 | 0.132 | 1.937 | 00:00:19 |
NNRP unrecognized commands (by host):
| System | Conn |
|---|---|
| scan-141.security.ipip.net | 4 |
| 164.52.24.176 | 2 |
| TOTAL: 2 | 6 |
NNRP unrecognized commands (by command):
| Command | Count |
|---|---|
| User-Agent: HTTP Banner Detection (https... | 1 |
| #026#003#001#001"#001 | 1 |
| GET / HTTP/1.1 | 1 |
| Host: 157.230.63.40:119 | 1 |
| Connection: close | 1 |
| À/À+À'À#À#023À | 1 |
| TOTAL: 6 | 6 |
NNRP client timeouts [Top 20]:
| System | Conn | Peer |
|---|---|---|
| 164.52.24.176 | 1 | 2 |
| TOTAL: 1 | 1 | 2 |
