
Log entries by program:
| Program name | Lines | %Lines | Size | %Size |
|---|---|---|---|---|
| inn | 16026 | 87.9% | 1.3 MB | 83.3% |
| innd | 1030 | 5.6% | 151.6 KB | 9.4% |
| innfeed | 606 | 3.3% | 67.9 KB | 4.2% |
| nnrpd | 528 | 2.9% | 44.3 KB | 2.7% |
| nocem | 48 | 0.3% | 5.4 KB | 0.3% |
| controlchan | 1 | 0.0% | 0.1 KB | 0.0% |
| TOTAL: 6 | 18239 | 100.0% | 1.6 MB | 100.0% |
History cache:
| Reason | Count | %Count |
|---|---|---|
| Do not exist | 15561 | 97.9% |
| Negative hits | 287 | 1.8% |
| Positive hits | 25 | 0.2% |
| Cache misses | 18 | 0.1% |
| TOTAL: 4 | 15891 | 100.0% |
INND timer:
| Code region | Time | Pct | Invoked | Min(ms) | Avg(ms) | Max(ms) |
|---|---|---|---|---|---|---|
| article cancel | 00:00:00.037 | 0.0% | 72 | 0.000 | 0.514 | 3.000 |
| article cleanup | 00:00:00.095 | 0.0% | 15551 | 0.000 | 0.006 | 0.037 |
| article logging | 00:00:00.485 | 0.0% | 15948 | 0.000 | 0.030 | 0.148 |
| article parse | 00:00:00.232 | 0.0% | 17585 | 0.000 | 0.013 | 0.052 |
| article write | 00:00:06.822 | 0.0% | 15550 | 0.119 | 0.439 | 2.906 |
| artlog/artcncl | 00:00:00.000 | 0.0% | 70 | 0.000 | 0.000 | 0.000 |
| data move | 00:00:00.020 | 0.0% | 19811 | 0.000 | 0.001 | 0.035 |
| hisgrep/artcncl | 00:00:00.003 | 0.0% | 46 | 0.000 | 0.065 | 1.000 |
| hishave/artcncl | 00:00:00.003 | 0.0% | 72 | 0.000 | 0.042 | 0.333 |
| history grep | 00:00:00.000 | 0.0% | 0 | 0.000 | 0.000 | 0.000 |
| history lookup | 00:00:02.431 | 0.0% | 15852 | 0.000 | 0.153 | 1.365 |
| history sync | 00:00:00.009 | 0.0% | 305 | 0.000 | 0.030 | 1.000 |
| history write | 00:00:03.282 | 0.0% | 15551 | 0.000 | 0.211 | 1.088 |
| hiswrite/artcncl | 00:00:00.006 | 0.0% | 26 | 0.000 | 0.231 | 1.000 |
| idle | 23:59:40.415 | 99.9% | 18379 | 2750.179 | 4699.952 | 11320.849 |
| nntp read | 00:00:00.523 | 0.0% | 17950 | 0.000 | 0.029 | 0.080 |
| overview write | 00:00:04.053 | 0.0% | 15550 | 0.051 | 0.261 | 3.310 |
| perl filter | 00:00:21.579 | 0.0% | 15551 | 1.121 | 1.388 | 2.226 |
| python filter | 00:00:00.000 | 0.0% | 0 | 0.000 | 0.000 | 0.000 |
| site send | 00:00:00.857 | 0.0% | 15570 | 0.000 | 0.055 | 0.121 |
| TOTAL: 24:00:23.646 | 24:00:20.852 | 100.0% | - | - | - | - |
INNfeed timer:
| Code region | Time | Pct | Invoked | Min(ms) | Avg(ms) | Max(ms) |
|---|---|---|---|---|---|---|
| article new | 00:00:00.025 | 0.0% | 15510 | 0.000 | 0.002 | 0.023 |
| article prepare | 00:00:00.000 | 0.0% | 112 | 0.000 | 0.000 | 0.000 |
| article read | 00:00:00.028 | 0.0% | 28 | 0.000 | 1.000 | 26.000 |
| backlog stats | 00:00:00.014 | 0.0% | 50983 | 0.000 | 0.000 | 0.005 |
| callbacks | 00:00:00.000 | 0.0% | 0 | 0.000 | 0.000 | 0.000 |
| data read | 00:00:00.212 | 0.0% | 31076 | 0.000 | 0.007 | 0.030 |
| data write | 00:00:00.317 | 0.0% | 15577 | 0.000 | 0.020 | 0.061 |
| idle | 23:57:11.187 | 100.0% | 50983 | 1042.575 | 1691.371 | 4173.743 |
| status file | 00:00:00.048 | 0.0% | 155 | 0.000 | 0.310 | 1.000 |
| TOTAL: 23:57:12.283 | 23:57:11.831 | 100.0% | - | - | - | - |
nnrpd timer:
| Code region | Time | Pct | Invoked | Min(ms) | Avg(ms) | Max(ms) |
|---|---|---|---|---|---|---|
| idle | 00:00:14.461 | 40.2% | 629 | 6.667 | 22.990 | 9566.000 |
| newnews | 00:00:00.000 | 0.0% | 0 | 0.000 | 0.000 | 0.000 |
| nntpwrite | 00:00:00.024 | 0.1% | 2202 | 0.000 | 0.011 | 0.095 |
| TOTAL: 00:00:35.980 | 00:00:14.485 | 40.3% | - | - | - | - |
Control commands to INND:
| Command | Number |
|---|---|
| L | 1 |
| flush | 3 |
| flushlogs | 2 |
| go | 2 |
| logmode | 2 |
| mode | 149 |
| name | 2 |
| pause | 2 |
| paused | 2 |
| reload | 2 |
| reserve | 2 |
| TOTAL: 11 | 169 |
Incoming Feeds (INN):
| Server | Connects | Offered | Taken | Refused | Reject | %Accpt | Elapsed | |
|---|---|---|---|---|---|---|---|---|
| 1 | i2pn | 6 | 15560 | 15559 | 0 | 1 | 99% | 24:31:56 |
| 2 | localhost | 30 | 0 | 0 | 0 | 0 | 0% | 00:00:00 |
| TOTAL: 2 | 36 | 15560 | 15559 | 0 | 1 | 99% | 24:31:56 | |
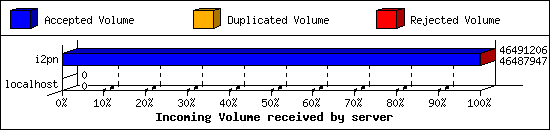
Incoming Volume (INN):
| Server | AcceptVol | DupVol | RejVol | TotalVol | %Acc | Vol/Art | |
|---|---|---|---|---|---|---|---|
| 1 | i2pn | 44.3 MB | 0.0 KB | 3.2 KB | 44.3 MB | 99% | 2.9 KB |
| 2 | localhost | 0.0 KB | 0.0 KB | 0.0 KB | 0.0 KB | 0% | 0 |
| TOTAL: 2 | 44.3 MB | 0.0 KB | 3.2 KB | 44.3 MB | 99% | 2.9 KB | |
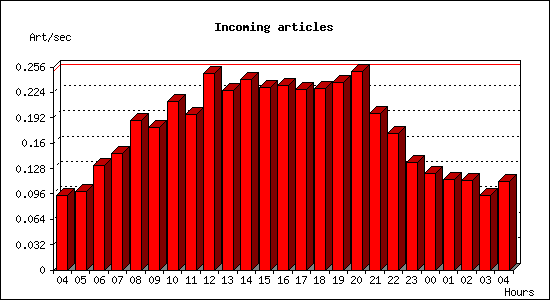
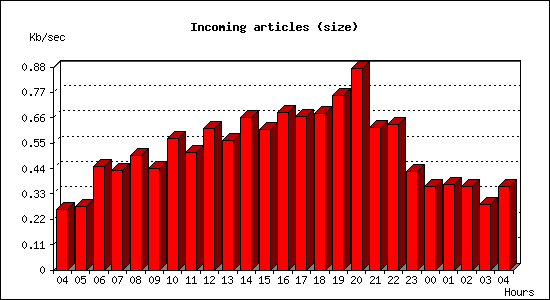
Incoming articles:
| Date | Articles | %Arts | Art/sec | Size | %Size | KB/sec |
|---|---|---|---|---|---|---|
| Aug 5 04:15:01 - 04:59:59 | 253 | 1.6% | 0.09 | 706.3 KB | 1.6% | 0.26 |
| Aug 5 05:00:00 - 05:59:59 | 355 | 2.3% | 0.10 | 994.7 KB | 2.2% | 0.28 |
| Aug 5 06:00:00 - 06:59:59 | 473 | 3.0% | 0.13 | 1.6 MB | 3.6% | 0.45 |
| Aug 5 07:00:00 - 07:59:59 | 528 | 3.4% | 0.15 | 1.5 MB | 3.4% | 0.43 |
| Aug 5 08:00:00 - 08:59:59 | 677 | 4.4% | 0.19 | 1.7 MB | 3.9% | 0.50 |
| Aug 5 09:00:00 - 09:59:59 | 648 | 4.2% | 0.18 | 1.5 MB | 3.5% | 0.44 |
| Aug 5 10:00:00 - 10:59:59 | 766 | 4.9% | 0.21 | 2.0 MB | 4.5% | 0.57 |
| Aug 5 11:00:00 - 11:59:59 | 708 | 4.6% | 0.20 | 1.8 MB | 4.0% | 0.51 |
| Aug 5 12:00:00 - 12:59:59 | 893 | 5.7% | 0.25 | 2.2 MB | 4.9% | 0.61 |
| Aug 5 13:00:00 - 13:59:59 | 817 | 5.3% | 0.23 | 2.0 MB | 4.4% | 0.56 |
| Aug 5 14:00:00 - 14:59:59 | 864 | 5.6% | 0.24 | 2.3 MB | 5.3% | 0.66 |
| Aug 5 15:00:00 - 15:59:59 | 828 | 5.3% | 0.23 | 2.1 MB | 4.8% | 0.61 |
| Aug 5 16:00:00 - 16:59:59 | 836 | 5.4% | 0.23 | 2.4 MB | 5.4% | 0.68 |
| Aug 5 17:00:00 - 17:59:59 | 820 | 5.3% | 0.23 | 2.3 MB | 5.3% | 0.66 |
| Aug 5 18:00:00 - 18:59:59 | 826 | 5.3% | 0.23 | 2.4 MB | 5.4% | 0.68 |
| Aug 5 19:00:00 - 19:59:59 | 851 | 5.5% | 0.24 | 2.7 MB | 6.0% | 0.76 |
| Aug 5 20:00:00 - 20:59:59 | 902 | 5.8% | 0.25 | 3.1 MB | 6.9% | 0.87 |
| Aug 5 21:00:00 - 21:59:59 | 709 | 4.6% | 0.20 | 2.2 MB | 4.9% | 0.62 |
| Aug 5 22:00:00 - 22:59:59 | 619 | 4.0% | 0.17 | 2.2 MB | 5.0% | 0.63 |
| Aug 5 23:00:00 - 23:59:59 | 489 | 3.1% | 0.14 | 1.5 MB | 3.4% | 0.43 |
| Aug 6 00:00:00 - 00:59:59 | 440 | 2.8% | 0.12 | 1.3 MB | 2.9% | 0.36 |
| Aug 6 01:00:00 - 01:59:59 | 411 | 2.6% | 0.11 | 1.3 MB | 2.9% | 0.37 |
| Aug 6 02:00:00 - 02:59:59 | 406 | 2.6% | 0.11 | 1.3 MB | 2.9% | 0.36 |
| Aug 6 03:00:00 - 03:59:59 | 339 | 2.2% | 0.09 | 1016.3 KB | 2.2% | 0.28 |
| Aug 6 04:00:00 - 04:15:01 | 101 | 0.6% | 0.11 | 325.5 KB | 0.7% | 0.36 |
| TOTAL: 24:00:00 | 15559 | 100.0% | 0.18 | 44.3 MB | 100.0% | 0.53 |
Sites sending bad articles:
| Server | Total | Group | Dist | Duplic | Unapp | TooOld | Site | Line | Other | |
|---|---|---|---|---|---|---|---|---|---|---|
| 1 | i2pn | 397 | 1 | 0 | 0 | 0 | 0 | 0 | 0 | 396 |
| TOTAL: 1 | 397 | 1 | 0 | 0 | 0 | 0 | 0 | 0 | 396 | |
Unwanted newsgroups [Top 20]:
| Newsgroup | Count |
|---|---|
| alt.pl.nieruchomosci.gielda | 1 |
| TOTAL: 1 | 1 |
NoCeM on Spool:
| Id | Good | Bad | Unique | Total |
|---|---|---|---|---|
| bleachbot@httrack.com | 34 | 0 | 35 | 35 |
| TOTAL: 1 | 34 | 9 | 35 | 35 |
Miscellaneous innd statistics [Top 10]:
| Event | Server | Number |
|---|---|---|
| Including strange strings | ||
| i2pn | 396 | |
| TOTAL: 1 | 396 | |
| TOTAL: 1 | 396 | |
Outgoing Feeds (innfeed) by Articles:
| Server | Offered | Taken | Refused | Reject | Miss | Spool | %Took | Elapsed | |
|---|---|---|---|---|---|---|---|---|---|
| 1 | novabbs | 15564 | 10 | 15508 | 18 | 0 | 0 | 0% | 23:59:48 |
| 2 | i2pn | 0 | 0 | 0 | 0 | 0 | 0 | 0% | 00:10:00 |
| TOTAL: 2 | 15564 | 10 | 15508 | 18 | 0 | 0 | 0% | 24:09:48 | |

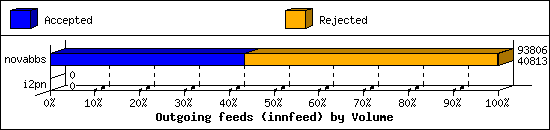
Outgoing Feeds (innfeed) by Volume:
| Server | AcceptVol | RejectVol | TotalVol | Volume/sec | Vol/Art | Elapsed | |
|---|---|---|---|---|---|---|---|
| 1 | novabbs | 39.9 KB | 51.8 KB | 91.6 KB | 0.0 KB/s | 3.3 KB | 23:59:48 |
| 2 | i2pn | 0.0 KB | 0.0 KB | 0.0 KB | 0.0 KB/s | 0 | 00:10:00 |
| TOTAL: 2 | 39.9 KB | 51.8 KB | 91.6 KB | 0.0 KB/s | 3.3 KB | 24:09:48 | |
NNRP readership statistics:
| System | Conn | Arts | Size | Groups | Post | Rej | Elapsed | |
|---|---|---|---|---|---|---|---|---|
| 1 | 107.170.203.123 | 1 | 0 | 0.0 KB | 0 | 0 | 0 | 00:00:09 |
| 2 | i2pn2.org | 104 | 0 | 0.0 KB | 0 | 0 | 0 | 00:00:25 |
| TOTAL: 2 | 105 | 0 | 0.0 KB | 0 | 0 | 0 | 00:00:35 | |
NNRP readership statistics (by domain):
| System | Conn | Arts | Size | Groups | Post | Rej | Elapsed | |
|---|---|---|---|---|---|---|---|---|
| 1 | *.org | 104 | 0 | 0.0 KB | 0 | 0 | 0 | 00:00:25 |
| 2 | unresolved | 1 | 0 | 0.0 KB | 0 | 0 | 0 | 00:00:09 |
| TOTAL: 2 | 105 | 0 | 0.0 KB | 0 | 0 | 0 | 00:00:35 | |
NNRP auth users [Top 20]:
| User | Conn |
|---|---|
| i2pn2user | 104 |
| TOTAL: 1 | 104 |
NNRP total resource statistics [Top 20]:
| System | User(ms) | System(ms) | Idle(ms) | Elapsed |
|---|---|---|---|---|
| i2pn2.org | 4.496 | 0.600 | 10.275 | 00:00:25 |
| 107.170.203.123 | 0.052 | 0.012 | 0.000 | 00:00:09 |
| TOTAL: 2 | 4.548 | 0.612 | 10.275 | 00:00:35 |
