Log entries by program:
| Program name | Lines | %Lines | Size | %Size |
|---|---|---|---|---|
| inn | 16615 | 87.1% | 1.4 MB | 82.8% |
| innd | 1076 | 5.6% | 154.4 KB | 9.2% |
| nnrpd | 735 | 3.9% | 62.5 KB | 3.7% |
| innfeed | 607 | 3.2% | 67.5 KB | 4.0% |
| nocem | 40 | 0.2% | 4.1 KB | 0.2% |
| controlchan | 1 | 0.0% | 0.1 KB | 0.0% |
| TOTAL: 6 | 19074 | 100.0% | 1.6 MB | 100.0% |
History cache:
| Reason | Count | %Count |
|---|---|---|
| Do not exist | 16150 | 97.9% |
| Negative hits | 283 | 1.7% |
| Positive hits | 41 | 0.2% |
| Cache misses | 20 | 0.1% |
| TOTAL: 4 | 16494 | 100.0% |
INND timer:
| Code region | Time | Pct | Invoked | Min(ms) | Avg(ms) | Max(ms) |
|---|---|---|---|---|---|---|
| article cancel | 00:00:00.044 | 0.0% | 77 | 0.000 | 0.571 | 3.000 |
| article cleanup | 00:00:00.097 | 0.0% | 16166 | 0.000 | 0.006 | 0.039 |
| article logging | 00:00:00.456 | 0.0% | 16545 | 0.000 | 0.028 | 0.091 |
| article parse | 00:00:00.274 | 0.0% | 18167 | 0.000 | 0.015 | 0.051 |
| article write | 00:00:09.467 | 0.0% | 16163 | 0.207 | 0.586 | 2.474 |
| artlog/artcncl | 00:00:00.002 | 0.0% | 77 | 0.000 | 0.026 | 1.000 |
| data move | 00:00:00.010 | 0.0% | 20423 | 0.000 | 0.000 | 0.014 |
| hisgrep/artcncl | 00:00:00.004 | 0.0% | 64 | 0.000 | 0.062 | 1.000 |
| hishave/artcncl | 00:00:00.000 | 0.0% | 77 | 0.000 | 0.000 | 0.000 |
| history grep | 00:00:00.000 | 0.0% | 0 | 0.000 | 0.000 | 0.000 |
| history lookup | 00:00:04.318 | 0.0% | 16467 | 0.000 | 0.262 | 1.534 |
| history sync | 00:00:00.016 | 0.0% | 308 | 0.000 | 0.052 | 1.000 |
| history write | 00:00:03.974 | 0.0% | 16166 | 0.000 | 0.246 | 1.500 |
| hiswrite/artcncl | 00:00:00.003 | 0.0% | 13 | 0.000 | 0.231 | 1.000 |
| idle | 23:59:34.570 | 99.9% | 19040 | 1305.887 | 4536.480 | 13044.935 |
| nntp read | 00:00:00.490 | 0.0% | 18534 | 0.000 | 0.026 | 0.087 |
| overview write | 00:00:03.496 | 0.0% | 16163 | 0.000 | 0.216 | 1.767 |
| perl filter | 00:00:22.342 | 0.0% | 16166 | 1.114 | 1.382 | 2.295 |
| python filter | 00:00:00.000 | 0.0% | 0 | 0.000 | 0.000 | 0.000 |
| site send | 00:00:00.941 | 0.0% | 16194 | 0.000 | 0.058 | 0.123 |
| TOTAL: 24:00:23.234 | 24:00:20.504 | 100.0% | - | - | - | - |
INNfeed timer:
| Code region | Time | Pct | Invoked | Min(ms) | Avg(ms) | Max(ms) |
|---|---|---|---|---|---|---|
| article new | 00:00:00.020 | 0.0% | 16132 | 0.000 | 0.001 | 0.021 |
| article prepare | 00:00:00.000 | 0.0% | 256 | 0.000 | 0.000 | 0.000 |
| article read | 00:00:00.026 | 0.0% | 64 | 0.000 | 0.406 | 10.500 |
| backlog stats | 00:00:00.014 | 0.0% | 53185 | 0.000 | 0.000 | 0.006 |
| callbacks | 00:00:00.000 | 0.0% | 0 | 0.000 | 0.000 | 0.000 |
| data read | 00:00:00.202 | 0.0% | 32454 | 0.000 | 0.006 | 0.027 |
| data write | 00:00:00.344 | 0.0% | 16326 | 0.000 | 0.021 | 0.060 |
| idle | 23:56:43.685 | 100.0% | 53185 | 452.758 | 1620.827 | 4364.930 |
| status file | 00:00:00.040 | 0.0% | 156 | 0.000 | 0.256 | 1.000 |
| TOTAL: 23:56:44.773 | 23:56:44.331 | 100.0% | - | - | - | - |
nnrpd timer:
| Code region | Time | Pct | Invoked | Min(ms) | Avg(ms) | Max(ms) |
|---|---|---|---|---|---|---|
| idle | 00:00:08.857 | 24.1% | 916 | 0.333 | 9.669 | 33.800 |
| newnews | 00:00:00.000 | 0.0% | 0 | 0.000 | 0.000 | 0.000 |
| nntpwrite | 00:00:00.033 | 0.1% | 3161 | 0.000 | 0.010 | 0.143 |
| readart | 00:00:00.079 | 0.2% | 11 | 4.833 | 7.182 | 12.500 |
| TOTAL: 00:00:36.793 | 00:00:08.969 | 24.4% | - | - | - | - |
Control commands to INND:
| Command | Number |
|---|---|
| L | 1 |
| flush | 3 |
| flushlogs | 2 |
| go | 2 |
| logmode | 2 |
| mode | 149 |
| name | 2 |
| pause | 2 |
| paused | 2 |
| reload | 2 |
| reserve | 2 |
| TOTAL: 11 | 169 |
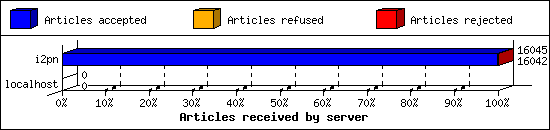
Incoming Feeds (INN):
| Server | Connects | Offered | Taken | Refused | Reject | %Accpt | Elapsed | |
|---|---|---|---|---|---|---|---|---|
| 1 | i2pn | 7 | 16045 | 16042 | 0 | 3 | 99% | 24:14:31 |
| 2 | localhost | 32 | 0 | 0 | 0 | 0 | 0% | 00:00:00 |
| TOTAL: 2 | 39 | 16045 | 16042 | 0 | 3 | 99% | 24:14:31 | |
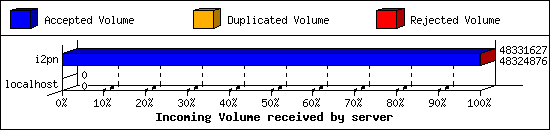
Incoming Volume (INN):
| Server | AcceptVol | DupVol | RejVol | TotalVol | %Acc | Vol/Art | |
|---|---|---|---|---|---|---|---|
| 1 | i2pn | 46.1 MB | 0.0 KB | 6.6 KB | 46.1 MB | 99% | 2.9 KB |
| 2 | localhost | 0.0 KB | 0.0 KB | 0.0 KB | 0.0 KB | 0% | 0 |
| TOTAL: 2 | 46.1 MB | 0.0 KB | 6.6 KB | 46.1 MB | 99% | 2.9 KB | |
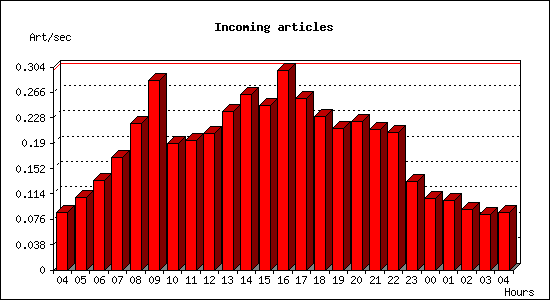
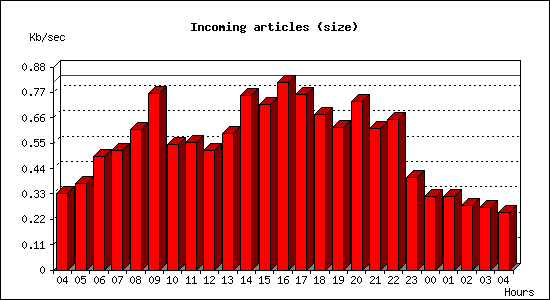
Incoming articles:
| Date | Articles | %Arts | Art/sec | Size | %Size | KB/sec |
|---|---|---|---|---|---|---|
| Aug 6 04:15:01 - 04:59:59 | 233 | 1.4% | 0.09 | 893.2 KB | 1.9% | 0.33 |
| Aug 6 05:00:00 - 05:59:59 | 389 | 2.4% | 0.11 | 1.3 MB | 2.8% | 0.37 |
| Aug 6 06:00:00 - 06:59:59 | 481 | 3.0% | 0.13 | 1.7 MB | 3.7% | 0.49 |
| Aug 6 07:00:00 - 07:59:59 | 607 | 3.8% | 0.17 | 1.8 MB | 3.9% | 0.52 |
| Aug 6 08:00:00 - 08:59:59 | 792 | 4.9% | 0.22 | 2.1 MB | 4.6% | 0.61 |
| Aug 6 09:00:00 - 09:59:59 | 1022 | 6.3% | 0.28 | 2.7 MB | 5.8% | 0.77 |
| Aug 6 10:00:00 - 10:59:59 | 684 | 4.2% | 0.19 | 1.9 MB | 4.1% | 0.55 |
| Aug 6 11:00:00 - 11:59:59 | 699 | 4.3% | 0.19 | 1.9 MB | 4.2% | 0.55 |
| Aug 6 12:00:00 - 12:59:59 | 738 | 4.6% | 0.20 | 1.8 MB | 3.9% | 0.52 |
| Aug 6 13:00:00 - 13:59:59 | 852 | 5.3% | 0.24 | 2.1 MB | 4.5% | 0.59 |
| Aug 6 14:00:00 - 14:59:59 | 945 | 5.8% | 0.26 | 2.7 MB | 5.7% | 0.76 |
| Aug 6 15:00:00 - 15:59:59 | 886 | 5.5% | 0.25 | 2.5 MB | 5.4% | 0.72 |
| Aug 6 16:00:00 - 16:59:59 | 1074 | 6.6% | 0.30 | 2.9 MB | 6.2% | 0.81 |
| Aug 6 17:00:00 - 17:59:59 | 927 | 5.7% | 0.26 | 2.7 MB | 5.8% | 0.76 |
| Aug 6 18:00:00 - 18:59:59 | 827 | 5.1% | 0.23 | 2.4 MB | 5.1% | 0.67 |
| Aug 6 19:00:00 - 19:59:59 | 762 | 4.7% | 0.21 | 2.2 MB | 4.7% | 0.62 |
| Aug 6 20:00:00 - 20:59:59 | 803 | 5.0% | 0.22 | 2.6 MB | 5.5% | 0.73 |
| Aug 6 21:00:00 - 21:59:59 | 757 | 4.7% | 0.21 | 2.2 MB | 4.6% | 0.61 |
| Aug 6 22:00:00 - 22:59:59 | 740 | 4.6% | 0.21 | 2.3 MB | 5.0% | 0.65 |
| Aug 6 23:00:00 - 23:59:59 | 479 | 3.0% | 0.13 | 1.4 MB | 3.0% | 0.40 |
| Aug 7 00:00:00 - 00:59:59 | 385 | 2.4% | 0.11 | 1.1 MB | 2.4% | 0.32 |
| Aug 7 01:00:00 - 01:59:59 | 375 | 2.3% | 0.10 | 1.1 MB | 2.4% | 0.32 |
| Aug 7 02:00:00 - 02:59:59 | 324 | 2.0% | 0.09 | 1009.8 KB | 2.1% | 0.28 |
| Aug 7 03:00:00 - 03:59:59 | 297 | 1.8% | 0.08 | 981.2 KB | 2.1% | 0.27 |
| Aug 7 04:00:00 - 04:15:01 | 78 | 0.5% | 0.09 | 224.4 KB | 0.5% | 0.25 |
| TOTAL: 24:00:00 | 16156 | 100.0% | 0.19 | 46.4 MB | 100.0% | 0.55 |
Sites sending bad articles:
| Server | Total | Group | Dist | Duplic | Unapp | TooOld | Site | Line | Other | |
|---|---|---|---|---|---|---|---|---|---|---|
| 1 | i2pn | 382 | 2 | 0 | 0 | 0 | 0 | 0 | 0 | 380 |
| TOTAL: 1 | 382 | 2 | 0 | 0 | 0 | 0 | 0 | 0 | 380 | |
Unwanted newsgroups [Top 20]:
| Newsgroup | Count |
|---|---|
| hk.politics | 1 |
| alt.religion.barfing-yak | 1 |
| TOTAL: 2 | 2 |
INND Perl filter [Top 20]:
| Reason | Count |
|---|---|
| EMP (phl) | 1 |
| TOTAL: 1 | 1 |
NoCeM on Spool:
| Id | Good | Bad | Unique | Total |
|---|---|---|---|---|
| bleachbot@httrack.com | 28 | 0 | 29 | 29 |
| TOTAL: 1 | 28 | 5 | 29 | 29 |
Miscellaneous innd statistics [Top 10]:
| Event | Server | Number |
|---|---|---|
| Including strange strings | ||
| i2pn | 379 | |
| TOTAL: 1 | 379 | |
| TOTAL: 1 | 379 | |
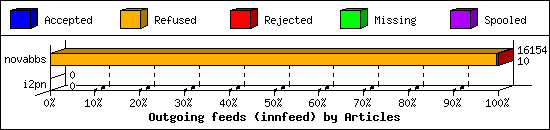
Outgoing Feeds (innfeed) by Articles:
| Server | Offered | Taken | Refused | Reject | Miss | Spool | %Took | Elapsed | |
|---|---|---|---|---|---|---|---|---|---|
| 1 | novabbs | 16280 | 10 | 16090 | 54 | 0 | 0 | 0% | 23:59:54 |
| 2 | i2pn | 0 | 0 | 0 | 0 | 0 | 0 | 0% | 00:10:00 |
| TOTAL: 2 | 16280 | 10 | 16090 | 54 | 0 | 0 | 0% | 24:09:54 | |
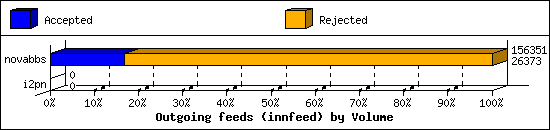
Outgoing Feeds (innfeed) by Volume:
| Server | AcceptVol | RejectVol | TotalVol | Volume/sec | Vol/Art | Elapsed | |
|---|---|---|---|---|---|---|---|
| 1 | novabbs | 25.8 KB | 126.9 KB | 152.7 KB | 0.0 KB/s | 2.4 KB | 23:59:54 |
| 2 | i2pn | 0.0 KB | 0.0 KB | 0.0 KB | 0.0 KB/s | 0 | 00:10:00 |
| TOTAL: 2 | 25.8 KB | 126.9 KB | 152.7 KB | 0.0 KB/s | 2.4 KB | 24:09:54 | |
NNRP readership statistics:
| System | Conn | Arts | Size | Groups | Post | Rej | Elapsed | |
|---|---|---|---|---|---|---|---|---|
| 1 | i2pn2.org | 140 | 11 | 11.7 KB | 11 | 0 | 0 | 00:00:36 |
| TOTAL: 1 | 140 | 11 | 11.7 KB | 11 | 0 | 0 | 00:00:36 | |
NNRP readership statistics (by domain):
| System | Conn | Arts | Size | Groups | Post | Rej | Elapsed | |
|---|---|---|---|---|---|---|---|---|
| 1 | *.org | 140 | 11 | 11.7 KB | 11 | 0 | 0 | 00:00:36 |
| TOTAL: 1 | 140 | 11 | 11.7 KB | 11 | 0 | 0 | 00:00:36 | |
NNRP auth users [Top 20]:
| User | Conn |
|---|---|
| i2pn2user | 140 |
| TOTAL: 1 | 140 |
NNRP total resource statistics [Top 20]:
| System | User(ms) | System(ms) | Idle(ms) | Elapsed |
|---|---|---|---|---|
| i2pn2.org | 6.168 | 0.808 | 13.092 | 00:00:36 |
| TOTAL: 1 | 6.168 | 0.808 | 13.092 | 00:00:36 |
Newsgroup request counts (by category):
| Category | Count | Pct | |
|---|---|---|---|
| 1 | rocksolid | 11 | 100.0% |
| TOTAL: 1 | 11 | 100.0% | |
Newsgroup request counts (by newsgroup) [Top 100]:
| Newsgroup | Count | |
|---|---|---|
| 1 | rocksolid.nodes | 9 |
| 2 | rocksolid.shared.offtopic | 2 |
| TOTAL: 2 | 11 | |
