Log entries by program:
| Program name | Lines | %Lines | Size | %Size |
|---|---|---|---|---|
| inn | 14357 | 86.6% | 1.2 MB | 81.8% |
| innd | 1012 | 6.1% | 145.6 KB | 9.9% |
| innfeed | 598 | 3.6% | 72.0 KB | 4.9% |
| nnrpd | 579 | 3.5% | 46.8 KB | 3.2% |
| nocem | 27 | 0.2% | 2.8 KB | 0.2% |
| controlchan | 1 | 0.0% | 0.0 KB | 0.0% |
| TOTAL: 6 | 16574 | 100.0% | 1.4 MB | 100.0% |
History cache:
| Reason | Count | %Count |
|---|---|---|
| Do not exist | 13899 | 98.0% |
| Negative hits | 236 | 1.7% |
| Positive hits | 32 | 0.2% |
| Cache misses | 9 | 0.1% |
| TOTAL: 4 | 14176 | 100.0% |
INND timer:
| Code region | Time | Pct | Invoked | Min(ms) | Avg(ms) | Max(ms) |
|---|---|---|---|---|---|---|
| article cancel | 00:00:00.035 | 0.0% | 53 | 0.000 | 0.660 | 3.000 |
| article cleanup | 00:00:00.069 | 0.0% | 13951 | 0.000 | 0.005 | 0.033 |
| article logging | 00:00:00.393 | 0.0% | 14325 | 0.000 | 0.027 | 0.068 |
| article parse | 00:00:00.231 | 0.0% | 15871 | 0.000 | 0.015 | 0.048 |
| article write | 00:00:08.898 | 0.0% | 13942 | 0.318 | 0.638 | 3.026 |
| artlog/artcncl | 00:00:00.001 | 0.0% | 53 | 0.000 | 0.019 | 0.500 |
| data move | 00:00:00.008 | 0.0% | 17832 | 0.000 | 0.000 | 0.016 |
| hisgrep/artcncl | 00:00:00.004 | 0.0% | 45 | 0.000 | 0.089 | 1.000 |
| hishave/artcncl | 00:00:00.005 | 0.0% | 53 | 0.000 | 0.094 | 1.000 |
| history grep | 00:00:00.000 | 0.0% | 0 | 0.000 | 0.000 | 0.000 |
| history lookup | 00:00:04.835 | 0.0% | 14202 | 0.000 | 0.340 | 1.868 |
| history sync | 00:00:00.020 | 0.0% | 416 | 0.000 | 0.048 | 0.500 |
| history write | 00:00:04.221 | 0.0% | 13951 | 0.000 | 0.303 | 1.227 |
| hiswrite/artcncl | 00:00:00.001 | 0.0% | 8 | 0.000 | 0.125 | 0.500 |
| idle | 24:00:28.286 | 99.9% | 16721 | 2898.097 | 5168.847 | 14638.220 |
| nntp read | 00:00:00.392 | 0.0% | 16176 | 0.000 | 0.024 | 0.077 |
| overview write | 00:00:03.037 | 0.0% | 13942 | 0.031 | 0.218 | 1.529 |
| perl filter | 00:00:19.452 | 0.0% | 13951 | 1.105 | 1.394 | 2.486 |
| python filter | 00:00:00.000 | 0.0% | 0 | 0.000 | 0.000 | 0.000 |
| site send | 00:00:00.549 | 0.0% | 13944 | 0.000 | 0.039 | 0.107 |
| TOTAL: 24:01:13.216 | 24:01:10.437 | 100.0% | - | - | - | - |
INNfeed timer:
| Code region | Time | Pct | Invoked | Min(ms) | Avg(ms) | Max(ms) |
|---|---|---|---|---|---|---|
| article new | 00:00:00.033 | 0.0% | 13890 | 0.000 | 0.002 | 0.022 |
| article prepare | 00:00:00.000 | 0.0% | 200 | 0.000 | 0.000 | 0.000 |
| article read | 00:00:00.021 | 0.0% | 50 | 0.000 | 0.420 | 21.000 |
| backlog stats | 00:00:00.015 | 0.0% | 46135 | 0.000 | 0.000 | 0.009 |
| callbacks | 00:00:00.000 | 0.0% | 0 | 0.000 | 0.000 | 0.000 |
| data read | 00:00:00.206 | 0.0% | 27850 | 0.000 | 0.007 | 0.048 |
| data write | 00:00:00.251 | 0.0% | 13964 | 0.000 | 0.018 | 0.075 |
| idle | 23:57:35.515 | 100.0% | 46135 | 1186.881 | 1869.633 | 5143.154 |
| status file | 00:00:00.037 | 0.0% | 152 | 0.000 | 0.243 | 2.000 |
| TOTAL: 23:57:36.485 | 23:57:36.078 | 100.0% | - | - | - | - |
nnrpd timer:
| Code region | Time | Pct | Invoked | Min(ms) | Avg(ms) | Max(ms) |
|---|---|---|---|---|---|---|
| idle | 00:00:06.757 | 14.0% | 719 | 0.000 | 9.398 | 25.923 |
| newnews | 00:00:00.000 | 0.0% | 0 | 0.000 | 0.000 | 0.000 |
| nntpwrite | 00:00:00.026 | 0.1% | 2357 | 0.000 | 0.011 | 0.190 |
| readart | 00:00:00.047 | 0.1% | 6 | 5.000 | 7.833 | 22.000 |
| TOTAL: 00:00:48.245 | 00:00:06.830 | 14.2% | - | - | - | - |
Control commands to INND:
| Command | Number |
|---|---|
| L | 1 |
| flush | 3 |
| flushlogs | 2 |
| go | 2 |
| logmode | 2 |
| mode | 148 |
| name | 2 |
| pause | 2 |
| paused | 2 |
| reload | 2 |
| reserve | 2 |
| TOTAL: 11 | 168 |
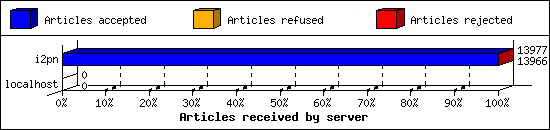
Incoming Feeds (INN):
| Server | Connects | Offered | Taken | Refused | Reject | %Accpt | Elapsed | |
|---|---|---|---|---|---|---|---|---|
| 1 | i2pn | 5 | 13977 | 13966 | 0 | 11 | 99% | 24:31:39 |
| 2 | localhost | 31 | 0 | 0 | 0 | 0 | 0% | 00:00:00 |
| TOTAL: 2 | 36 | 13977 | 13966 | 0 | 11 | 99% | 24:31:39 | |
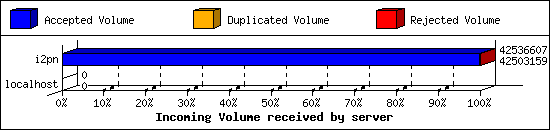
Incoming Volume (INN):
| Server | AcceptVol | DupVol | RejVol | TotalVol | %Acc | Vol/Art | |
|---|---|---|---|---|---|---|---|
| 1 | i2pn | 40.5 MB | 0.0 KB | 32.7 KB | 40.6 MB | 99% | 3.0 KB |
| 2 | localhost | 0.0 KB | 0.0 KB | 0.0 KB | 0.0 KB | 0% | 0 |
| TOTAL: 2 | 40.5 MB | 0.0 KB | 32.7 KB | 40.6 MB | 99% | 3.0 KB | |
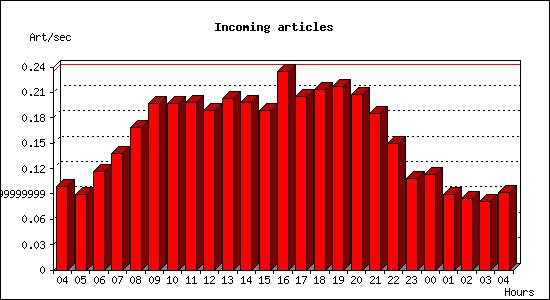
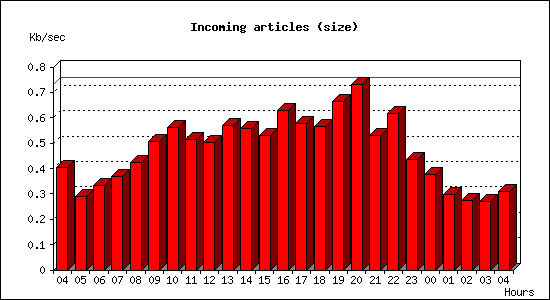
Incoming articles:
| Date | Articles | %Arts | Art/sec | Size | %Size | KB/sec |
|---|---|---|---|---|---|---|
| Aug 11 04:15:01 - 04:59:59 | 267 | 1.9% | 0.10 | 1.1 MB | 2.6% | 0.40 |
| Aug 11 05:00:00 - 05:59:59 | 321 | 2.3% | 0.09 | 1.0 MB | 2.5% | 0.29 |
| Aug 11 06:00:00 - 06:59:59 | 420 | 3.0% | 0.12 | 1.2 MB | 2.9% | 0.33 |
| Aug 11 07:00:00 - 07:59:59 | 495 | 3.6% | 0.14 | 1.3 MB | 3.2% | 0.37 |
| Aug 11 08:00:00 - 08:59:59 | 608 | 4.4% | 0.17 | 1.5 MB | 3.7% | 0.42 |
| Aug 11 09:00:00 - 09:59:59 | 709 | 5.1% | 0.20 | 1.8 MB | 4.4% | 0.51 |
| Aug 11 10:00:00 - 10:59:59 | 709 | 5.1% | 0.20 | 2.0 MB | 4.9% | 0.56 |
| Aug 11 11:00:00 - 11:59:59 | 712 | 5.1% | 0.20 | 1.8 MB | 4.5% | 0.52 |
| Aug 11 12:00:00 - 12:59:59 | 680 | 4.9% | 0.19 | 1.8 MB | 4.4% | 0.50 |
| Aug 11 13:00:00 - 13:59:59 | 732 | 5.3% | 0.20 | 2.0 MB | 4.9% | 0.57 |
| Aug 11 14:00:00 - 14:59:59 | 712 | 5.1% | 0.20 | 2.0 MB | 4.8% | 0.56 |
| Aug 11 15:00:00 - 15:59:59 | 677 | 4.9% | 0.19 | 1.9 MB | 4.6% | 0.53 |
| Aug 11 16:00:00 - 16:59:59 | 843 | 6.1% | 0.23 | 2.2 MB | 5.5% | 0.63 |
| Aug 11 17:00:00 - 17:59:59 | 739 | 5.3% | 0.21 | 2.0 MB | 5.0% | 0.58 |
| Aug 11 18:00:00 - 18:59:59 | 767 | 5.5% | 0.21 | 2.0 MB | 4.9% | 0.56 |
| Aug 11 19:00:00 - 19:59:59 | 780 | 5.6% | 0.22 | 2.3 MB | 5.8% | 0.66 |
| Aug 11 20:00:00 - 20:59:59 | 747 | 5.4% | 0.21 | 2.6 MB | 6.4% | 0.73 |
| Aug 11 21:00:00 - 21:59:59 | 666 | 4.8% | 0.18 | 1.9 MB | 4.6% | 0.53 |
| Aug 11 22:00:00 - 22:59:59 | 539 | 3.9% | 0.15 | 2.2 MB | 5.4% | 0.62 |
| Aug 11 23:00:00 - 23:59:59 | 388 | 2.8% | 0.11 | 1.5 MB | 3.8% | 0.43 |
| Aug 12 00:00:00 - 00:59:59 | 406 | 2.9% | 0.11 | 1.3 MB | 3.3% | 0.37 |
| Aug 12 01:00:00 - 01:59:59 | 323 | 2.3% | 0.09 | 1.0 MB | 2.6% | 0.30 |
| Aug 12 02:00:00 - 02:59:59 | 305 | 2.2% | 0.08 | 987.9 KB | 2.4% | 0.27 |
| Aug 12 03:00:00 - 03:59:59 | 291 | 2.1% | 0.08 | 969.8 KB | 2.3% | 0.27 |
| Aug 12 04:00:00 - 04:15:01 | 83 | 0.6% | 0.09 | 279.9 KB | 0.7% | 0.31 |
| TOTAL: 24:00:00 | 13919 | 100.0% | 0.16 | 40.4 MB | 100.0% | 0.48 |
Sites sending bad articles:
| Server | Total | Group | Dist | Duplic | Unapp | TooOld | Site | Line | Other | |
|---|---|---|---|---|---|---|---|---|---|---|
| 1 | i2pn | 384 | 11 | 0 | 0 | 0 | 0 | 0 | 0 | 373 |
| TOTAL: 1 | 384 | 11 | 0 | 0 | 0 | 0 | 0 | 0 | 373 | |
Unwanted newsgroups [Top 20]:
| Newsgroup | Count |
|---|---|
| alt.pl.nieruchomosci.gielda | 11 |
| TOTAL: 1 | 11 |
NoCeM on Spool:
| Id | Good | Bad | Unique | Total |
|---|---|---|---|---|
| bleachbot@httrack.com | 15 | 0 | 15 | 15 |
| TOTAL: 1 | 15 | 6 | 15 | 15 |
Miscellaneous innd statistics [Top 10]:
| Event | Server | Number |
|---|---|---|
| Including strange strings | ||
| i2pn | 373 | |
| TOTAL: 1 | 373 | |
| TOTAL: 1 | 373 | |
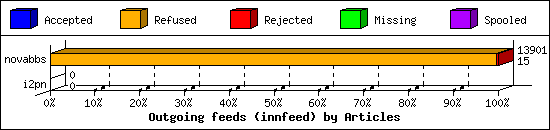
Outgoing Feeds (innfeed) by Articles:
| Server | Offered | Taken | Refused | Reject | Miss | Spool | %Took | Elapsed | |
|---|---|---|---|---|---|---|---|---|---|
| 1 | novabbs | 13917 | 15 | 13851 | 35 | 0 | 0 | 0% | 23:59:58 |
| 2 | i2pn | 0 | 0 | 0 | 0 | 0 | 0 | 0% | 00:10:00 |
| TOTAL: 2 | 13917 | 15 | 13851 | 35 | 0 | 0 | 0% | 24:09:58 | |
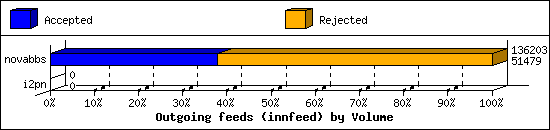
Outgoing Feeds (innfeed) by Volume:
| Server | AcceptVol | RejectVol | TotalVol | Volume/sec | Vol/Art | Elapsed | |
|---|---|---|---|---|---|---|---|
| 1 | novabbs | 50.3 KB | 82.7 KB | 133.0 KB | 0.0 KB/s | 2.7 KB | 23:59:58 |
| 2 | i2pn | 0.0 KB | 0.0 KB | 0.0 KB | 0.0 KB/s | 0 | 00:10:00 |
| TOTAL: 2 | 50.3 KB | 82.7 KB | 133.0 KB | 0.0 KB/s | 2.7 KB | 24:09:58 | |
NNRP readership statistics:
| System | Conn | Arts | Size | Groups | Post | Rej | Elapsed | |
|---|---|---|---|---|---|---|---|---|
| 1 | i2pn2.org | 105 | 6 | 7.2 KB | 6 | 0 | 0 | 00:00:26 |
| TOTAL: 1 | 105 | 6 | 7.2 KB | 6 | 0 | 0 | 00:00:47 | |
NNRP readership statistics (by domain):
| System | Conn | Arts | Size | Groups | Post | Rej | Elapsed | |
|---|---|---|---|---|---|---|---|---|
| 1 | *.org | 105 | 6 | 7.2 KB | 6 | 0 | 0 | 00:00:26 |
| 2 | *.sfj.corp.censys.io | 1 | 0 | 0.0 KB | 0 | 0 | 0 | 00:00:00 |
| 3 | unresolved | 1 | 0 | 0.0 KB | 0 | 0 | 0 | 00:00:20 |
| TOTAL: 3 | 107 | 6 | 7.2 KB | 6 | 0 | 0 | 00:00:47 | |
NNRP auth users [Top 20]:
| User | Conn |
|---|---|
| i2pn2user | 106 |
| TOTAL: 1 | 106 |
NNRP total resource statistics [Top 20]:
| System | User(ms) | System(ms) | Idle(ms) | Elapsed |
|---|---|---|---|---|
| i2pn2.org | 4.996 | 0.600 | 10.019 | 00:00:26 |
| 157.230.63.40 | 0.064 | 0.004 | 0.099 | 00:00:20 |
| worker-18.sfj.corp.censys.io | 0.056 | 0.012 | 0.000 | 00:00:00 |
| TOTAL: 3 | 5.116 | 0.616 | 10.118 | 00:00:47 |
Curious NNRP server explorers [Top 20]:
| System | Conn |
|---|---|
| worker-18.sfj.corp.censys.io | 1 |
| 157.230.63.40 | 1 |
| TOTAL: 2 | 2 |
NNRP client timeouts [Top 20]:
| System | Conn | Peer |
|---|---|---|
| worker-18.sfj.corp.censys.io | 1 | 1 |
| TOTAL: 1 | 1 | 1 |
Newsgroup request counts (by category):
| Category | Count | Pct | |
|---|---|---|---|
| 1 | rocksolid | 6 | 100.0% |
| TOTAL: 1 | 6 | 100.0% | |
Newsgroup request counts (by newsgroup) [Top 100]:
| Newsgroup | Count | |
|---|---|---|
| 1 | rocksolid.shared.test | 5 |
| 2 | rocksolid.shared.helpdesk | 1 |
| TOTAL: 2 | 6 | |
