Log entries by program:
| Program name | Lines | %Lines | Size | %Size |
|---|---|---|---|---|
| inn | 15557 | 88.6% | 1.3 MB | 83.7% |
| innd | 1025 | 5.8% | 151.5 KB | 9.8% |
| innfeed | 605 | 3.4% | 70.5 KB | 4.6% |
| nnrpd | 324 | 1.8% | 25.8 KB | 1.7% |
| nocem | 42 | 0.2% | 3.9 KB | 0.3% |
| controlchan | 1 | 0.0% | 0.2 KB | 0.0% |
| TOTAL: 6 | 17554 | 100.0% | 1.5 MB | 100.0% |
History cache:
| Reason | Count | %Count |
|---|---|---|
| Do not exist | 15095 | 97.8% |
| Negative hits | 273 | 1.8% |
| Positive hits | 40 | 0.3% |
| Cache misses | 22 | 0.1% |
| TOTAL: 4 | 15430 | 100.0% |
INND timer:
| Code region | Time | Pct | Invoked | Min(ms) | Avg(ms) | Max(ms) |
|---|---|---|---|---|---|---|
| article cancel | 00:00:00.071 | 0.0% | 81 | 0.000 | 0.877 | 3.500 |
| article cleanup | 00:00:00.072 | 0.0% | 15123 | 0.000 | 0.005 | 0.029 |
| article logging | 00:00:00.465 | 0.0% | 15477 | 0.000 | 0.030 | 0.118 |
| article parse | 00:00:00.242 | 0.0% | 17353 | 0.000 | 0.014 | 0.056 |
| article write | 00:00:11.750 | 0.0% | 15123 | 0.378 | 0.777 | 4.977 |
| artlog/artcncl | 00:00:00.001 | 0.0% | 81 | 0.000 | 0.012 | 0.071 |
| data move | 00:00:00.012 | 0.0% | 19596 | 0.000 | 0.001 | 0.011 |
| hisgrep/artcncl | 00:00:00.011 | 0.0% | 68 | 0.000 | 0.162 | 1.000 |
| hishave/artcncl | 00:00:00.011 | 0.0% | 81 | 0.000 | 0.136 | 1.000 |
| history grep | 00:00:00.000 | 0.0% | 0 | 0.000 | 0.000 | 0.000 |
| history lookup | 00:00:06.355 | 0.0% | 15424 | 0.000 | 0.412 | 2.021 |
| history sync | 00:00:00.018 | 0.0% | 415 | 0.000 | 0.043 | 0.500 |
| history write | 00:00:05.362 | 0.0% | 15123 | 0.019 | 0.355 | 1.509 |
| hiswrite/artcncl | 00:00:00.003 | 0.0% | 13 | 0.000 | 0.231 | 0.333 |
| idle | 24:00:09.757 | 99.9% | 18157 | 2690.717 | 4759.033 | 11767.353 |
| nntp read | 00:00:00.475 | 0.0% | 17724 | 0.000 | 0.027 | 0.070 |
| overview write | 00:00:04.271 | 0.0% | 15123 | 0.045 | 0.282 | 3.536 |
| perl filter | 00:00:23.956 | 0.0% | 15123 | 1.172 | 1.584 | 4.128 |
| python filter | 00:00:00.000 | 0.0% | 0 | 0.000 | 0.000 | 0.000 |
| site send | 00:00:00.799 | 0.0% | 15152 | 0.000 | 0.053 | 0.129 |
| TOTAL: 24:01:06.632 | 24:01:03.631 | 100.0% | - | - | - | - |
INNfeed timer:
| Code region | Time | Pct | Invoked | Min(ms) | Avg(ms) | Max(ms) |
|---|---|---|---|---|---|---|
| article new | 00:00:00.028 | 0.0% | 15113 | 0.000 | 0.002 | 0.024 |
| article prepare | 00:00:00.000 | 0.0% | 268 | 0.000 | 0.000 | 0.000 |
| article read | 00:00:00.028 | 0.0% | 67 | 0.000 | 0.418 | 24.000 |
| backlog stats | 00:00:00.009 | 0.0% | 49928 | 0.000 | 0.000 | 0.006 |
| callbacks | 00:00:00.000 | 0.0% | 0 | 0.000 | 0.000 | 0.000 |
| data read | 00:00:00.235 | 0.0% | 30340 | 0.000 | 0.008 | 0.025 |
| data write | 00:00:00.320 | 0.0% | 15233 | 0.000 | 0.021 | 0.083 |
| idle | 23:59:41.257 | 100.0% | 49928 | 1060.004 | 1730.117 | 4013.373 |
| status file | 00:00:00.325 | 0.0% | 156 | 0.000 | 2.083 | 244.000 |
| TOTAL: 23:59:42.659 | 23:59:42.202 | 100.0% | - | - | - | - |
nnrpd timer:
| Code region | Time | Pct | Invoked | Min(ms) | Avg(ms) | Max(ms) |
|---|---|---|---|---|---|---|
| idle | 00:00:06.728 | 32.8% | 484 | 0.000 | 13.901 | 58.333 |
| newnews | 00:00:00.000 | 0.0% | 0 | 0.000 | 0.000 | 0.000 |
| nntpwrite | 00:00:00.022 | 0.1% | 1505 | 0.000 | 0.015 | 0.095 |
| readart | 00:00:00.078 | 0.4% | 3 | 22.000 | 26.000 | 30.000 |
| TOTAL: 00:00:20.502 | 00:00:06.828 | 33.3% | - | - | - | - |
Control commands to INND:
| Command | Number |
|---|---|
| L | 1 |
| flush | 3 |
| flushlogs | 2 |
| go | 2 |
| logmode | 2 |
| mode | 148 |
| name | 2 |
| pause | 2 |
| paused | 2 |
| reload | 2 |
| reserve | 2 |
| TOTAL: 11 | 168 |
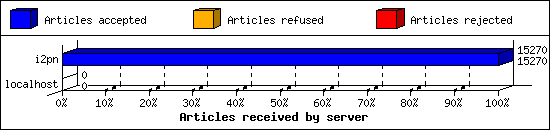
Incoming Feeds (INN):
| Server | Connects | Offered | Taken | Refused | Reject | %Accpt | Elapsed | |
|---|---|---|---|---|---|---|---|---|
| 1 | i2pn | 8 | 15270 | 15270 | 0 | 0 | 100% | 25:15:19 |
| 2 | localhost | 30 | 0 | 0 | 0 | 0 | 0% | 00:00:00 |
| TOTAL: 2 | 38 | 15270 | 15270 | 0 | 0 | 100% | 25:15:19 | |
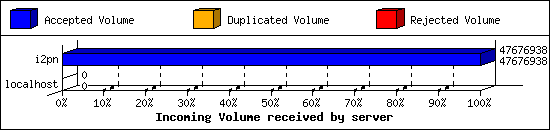
Incoming Volume (INN):
| Server | AcceptVol | DupVol | RejVol | TotalVol | %Acc | Vol/Art | |
|---|---|---|---|---|---|---|---|
| 1 | i2pn | 45.5 MB | 0.0 KB | 0.0 KB | 45.5 MB | 100% | 3.0 KB |
| 2 | localhost | 0.0 KB | 0.0 KB | 0.0 KB | 0.0 KB | 0% | 0 |
| TOTAL: 2 | 45.5 MB | 0.0 KB | 0.0 KB | 45.5 MB | 100% | 3.0 KB | |
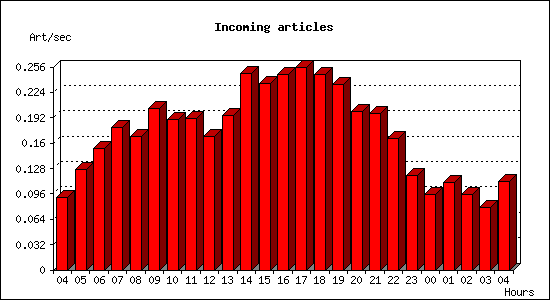
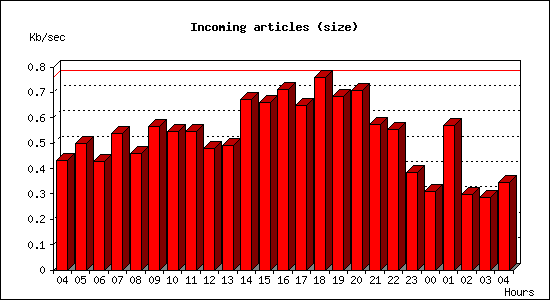
Incoming articles:
| Date | Articles | %Arts | Art/sec | Size | %Size | KB/sec |
|---|---|---|---|---|---|---|
| Aug 14 04:15:01 - 04:59:59 | 248 | 1.6% | 0.09 | 1.1 MB | 2.5% | 0.43 |
| Aug 14 05:00:00 - 05:59:59 | 458 | 3.0% | 0.13 | 1.8 MB | 3.9% | 0.50 |
| Aug 14 06:00:00 - 06:59:59 | 550 | 3.6% | 0.15 | 1.5 MB | 3.3% | 0.43 |
| Aug 14 07:00:00 - 07:59:59 | 649 | 4.3% | 0.18 | 1.9 MB | 4.2% | 0.54 |
| Aug 14 08:00:00 - 08:59:59 | 608 | 4.0% | 0.17 | 1.6 MB | 3.6% | 0.46 |
| Aug 14 09:00:00 - 09:59:59 | 731 | 4.8% | 0.20 | 2.0 MB | 4.4% | 0.57 |
| Aug 14 10:00:00 - 10:59:59 | 683 | 4.5% | 0.19 | 1.9 MB | 4.3% | 0.55 |
| Aug 14 11:00:00 - 11:59:59 | 690 | 4.6% | 0.19 | 1.9 MB | 4.3% | 0.55 |
| Aug 14 12:00:00 - 12:59:59 | 606 | 4.0% | 0.17 | 1.7 MB | 3.7% | 0.48 |
| Aug 14 13:00:00 - 13:59:59 | 703 | 4.6% | 0.20 | 1.7 MB | 3.8% | 0.49 |
| Aug 14 14:00:00 - 14:59:59 | 893 | 5.9% | 0.25 | 2.4 MB | 5.2% | 0.67 |
| Aug 14 15:00:00 - 15:59:59 | 847 | 5.6% | 0.24 | 2.3 MB | 5.2% | 0.66 |
| Aug 14 16:00:00 - 16:59:59 | 886 | 5.9% | 0.25 | 2.5 MB | 5.6% | 0.71 |
| Aug 14 17:00:00 - 17:59:59 | 920 | 6.1% | 0.26 | 2.3 MB | 5.1% | 0.65 |
| Aug 14 18:00:00 - 18:59:59 | 888 | 5.9% | 0.25 | 2.7 MB | 5.9% | 0.76 |
| Aug 14 19:00:00 - 19:59:59 | 841 | 5.6% | 0.23 | 2.4 MB | 5.3% | 0.68 |
| Aug 14 20:00:00 - 20:59:59 | 721 | 4.8% | 0.20 | 2.5 MB | 5.5% | 0.71 |
| Aug 14 21:00:00 - 21:59:59 | 711 | 4.7% | 0.20 | 2.0 MB | 4.5% | 0.57 |
| Aug 14 22:00:00 - 22:59:59 | 597 | 3.9% | 0.17 | 1.9 MB | 4.3% | 0.55 |
| Aug 14 23:00:00 - 23:59:59 | 430 | 2.8% | 0.12 | 1.4 MB | 3.0% | 0.39 |
| Aug 15 00:00:00 - 00:59:59 | 344 | 2.3% | 0.10 | 1.1 MB | 2.4% | 0.31 |
| Aug 15 01:00:00 - 01:59:59 | 395 | 2.6% | 0.11 | 2.0 MB | 4.5% | 0.57 |
| Aug 15 02:00:00 - 02:59:59 | 342 | 2.3% | 0.10 | 1.0 MB | 2.3% | 0.30 |
| Aug 15 03:00:00 - 03:59:59 | 282 | 1.9% | 0.08 | 1.0 MB | 2.2% | 0.29 |
| Aug 15 04:00:00 - 04:15:01 | 100 | 0.7% | 0.11 | 311.9 KB | 0.7% | 0.35 |
| TOTAL: 24:00:00 | 15123 | 100.0% | 0.18 | 44.9 MB | 100.0% | 0.53 |
Sites sending bad articles:
| Server | Total | Group | Dist | Duplic | Unapp | TooOld | Site | Line | Other | |
|---|---|---|---|---|---|---|---|---|---|---|
| 1 | i2pn | 354 | 0 | 0 | 0 | 0 | 0 | 0 | 0 | 354 |
| TOTAL: 1 | 354 | 0 | 0 | 0 | 0 | 0 | 0 | 0 | 354 | |
NoCeM on Spool:
| Id | Good | Bad | Unique | Total |
|---|---|---|---|---|
| bleachbot@httrack.com | 21 | 0 | 25 | 25 |
| TOTAL: 1 | 21 | 16 | 25 | 25 |
Miscellaneous innd statistics [Top 10]:
| Event | Server | Number |
|---|---|---|
| Including strange strings | ||
| i2pn | 354 | |
| TOTAL: 1 | 354 | |
| TOTAL: 1 | 354 | |
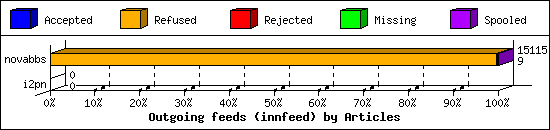
Outgoing Feeds (innfeed) by Articles:
| Server | Offered | Taken | Refused | Reject | Miss | Spool | %Took | Elapsed | |
|---|---|---|---|---|---|---|---|---|---|
| 1 | novabbs | 15164 | 9 | 15047 | 58 | 0 | 1 | 0% | 23:59:50 |
| 2 | i2pn | 0 | 0 | 0 | 0 | 0 | 0 | 0% | 00:10:00 |
| TOTAL: 2 | 15164 | 9 | 15047 | 58 | 0 | 1 | 0% | 24:09:50 | |
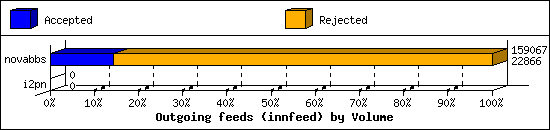
Outgoing Feeds (innfeed) by Volume:
| Server | AcceptVol | RejectVol | TotalVol | Volume/sec | Vol/Art | Elapsed | |
|---|---|---|---|---|---|---|---|
| 1 | novabbs | 22.3 KB | 133.0 KB | 155.3 KB | 0.0 KB/s | 2.3 KB | 23:59:50 |
| 2 | i2pn | 0.0 KB | 0.0 KB | 0.0 KB | 0.0 KB/s | 0 | 00:10:00 |
| TOTAL: 2 | 22.3 KB | 133.0 KB | 155.3 KB | 0.0 KB/s | 2.3 KB | 24:09:50 | |
NNRP readership statistics:
| System | Conn | Arts | Size | Groups | Post | Rej | Elapsed | |
|---|---|---|---|---|---|---|---|---|
| 1 | i2pn2.org | 51 | 3 | 3.4 KB | 3 | 0 | 0 | 00:00:20 |
| TOTAL: 1 | 51 | 3 | 3.4 KB | 3 | 0 | 0 | 00:00:20 | |
NNRP readership statistics (by domain):
| System | Conn | Arts | Size | Groups | Post | Rej | Elapsed | |
|---|---|---|---|---|---|---|---|---|
| 1 | *.org | 51 | 3 | 3.4 KB | 3 | 0 | 0 | 00:00:20 |
| TOTAL: 1 | 51 | 3 | 3.4 KB | 3 | 0 | 0 | 00:00:20 | |
NNRP auth users [Top 20]:
| User | Conn |
|---|---|
| i2pn2user | 51 |
| TOTAL: 1 | 51 |
NNRP total resource statistics [Top 20]:
| System | User(ms) | System(ms) | Idle(ms) | Elapsed |
|---|---|---|---|---|
| i2pn2.org | 3.092 | 0.428 | 5.583 | 00:00:20 |
| ? | 0.048 | 0.024 | 0.000 | 00:00:00 |
| TOTAL: 2 | 3.140 | 0.452 | 5.583 | 00:00:20 |
Newsgroup request counts (by category):
| Category | Count | Pct | |
|---|---|---|---|
| 1 | rocksolid | 3 | 100.0% |
| TOTAL: 1 | 3 | 100.0% | |
Newsgroup request counts (by newsgroup) [Top 100]:
| Newsgroup | Count | |
|---|---|---|
| 1 | rocksolid.shared.linux | 2 |
| 2 | rocksolid.shared.security | 1 |
| TOTAL: 2 | 3 | |
