Log entries by program:
| Program name | Lines | %Lines | Size | %Size |
|---|---|---|---|---|
| inn | 15220 | 88.7% | 1.2 MB | 83.7% |
| innd | 1043 | 6.1% | 151.8 KB | 10.0% |
| innfeed | 613 | 3.6% | 72.3 KB | 4.8% |
| nnrpd | 240 | 1.4% | 19.6 KB | 1.3% |
| nocem | 37 | 0.2% | 3.5 KB | 0.2% |
| controlchan | 1 | 0.0% | 0.1 KB | 0.0% |
| TOTAL: 6 | 17154 | 100.0% | 1.5 MB | 100.0% |
History cache:
| Reason | Count | %Count |
|---|---|---|
| Do not exist | 14750 | 98.7% |
| Negative hits | 133 | 0.9% |
| Positive hits | 45 | 0.3% |
| Cache misses | 18 | 0.1% |
| TOTAL: 4 | 14946 | 100.0% |
INND timer:
| Code region | Time | Pct | Invoked | Min(ms) | Avg(ms) | Max(ms) |
|---|---|---|---|---|---|---|
| article cancel | 00:00:00.029 | 0.0% | 76 | 0.000 | 0.382 | 4.000 |
| article cleanup | 00:00:00.091 | 0.0% | 14759 | 0.000 | 0.006 | 0.037 |
| article logging | 00:00:00.412 | 0.0% | 15088 | 0.000 | 0.027 | 0.099 |
| article parse | 00:00:00.182 | 0.0% | 16614 | 0.000 | 0.011 | 0.041 |
| article write | 00:00:08.072 | 0.0% | 14757 | 0.155 | 0.547 | 2.577 |
| artlog/artcncl | 00:00:00.003 | 0.0% | 75 | 0.000 | 0.040 | 0.250 |
| data move | 00:00:00.008 | 0.0% | 18453 | 0.000 | 0.000 | 0.010 |
| hisgrep/artcncl | 00:00:00.004 | 0.0% | 67 | 0.000 | 0.060 | 1.000 |
| hishave/artcncl | 00:00:00.000 | 0.0% | 76 | 0.000 | 0.000 | 0.000 |
| history grep | 00:00:00.000 | 0.0% | 0 | 0.000 | 0.000 | 0.000 |
| history lookup | 00:00:02.615 | 0.0% | 14910 | 0.000 | 0.175 | 2.245 |
| history sync | 00:00:00.017 | 0.0% | 416 | 0.000 | 0.041 | 1.000 |
| history write | 00:00:03.402 | 0.0% | 14759 | 0.009 | 0.231 | 1.224 |
| hiswrite/artcncl | 00:00:00.000 | 0.0% | 9 | 0.000 | 0.000 | 0.000 |
| idle | 23:50:17.792 | 99.9% | 17253 | 2379.694 | 4974.079 | 16216.270 |
| nntp read | 00:00:00.458 | 0.0% | 16833 | 0.000 | 0.027 | 0.085 |
| overview write | 00:00:03.385 | 0.0% | 14757 | 0.061 | 0.229 | 2.920 |
| perl filter | 00:00:21.508 | 0.0% | 14759 | 1.193 | 1.457 | 2.000 |
| python filter | 00:00:00.000 | 0.0% | 0 | 0.000 | 0.000 | 0.000 |
| site send | 00:00:00.714 | 0.0% | 14786 | 0.000 | 0.048 | 0.110 |
| TOTAL: 23:51:01.823 | 23:50:58.692 | 100.0% | - | - | - | - |
INNfeed timer:
| Code region | Time | Pct | Invoked | Min(ms) | Avg(ms) | Max(ms) |
|---|---|---|---|---|---|---|
| article new | 00:00:00.035 | 0.0% | 14804 | 0.000 | 0.002 | 0.025 |
| article prepare | 00:00:00.000 | 0.0% | 304 | 0.000 | 0.000 | 0.000 |
| article read | 00:00:00.031 | 0.0% | 76 | 0.000 | 0.408 | 27.000 |
| backlog stats | 00:00:00.014 | 0.0% | 48930 | 0.000 | 0.000 | 0.007 |
| callbacks | 00:00:00.000 | 0.0% | 0 | 0.000 | 0.000 | 0.000 |
| data read | 00:00:00.237 | 0.0% | 29694 | 0.000 | 0.008 | 0.035 |
| data write | 00:00:00.305 | 0.0% | 14897 | 0.000 | 0.020 | 0.061 |
| idle | 23:58:24.133 | 100.0% | 48930 | 985.826 | 1763.829 | 4962.463 |
| status file | 00:00:00.054 | 0.0% | 158 | 0.000 | 0.342 | 1.143 |
| TOTAL: 23:58:25.242 | 23:58:24.809 | 100.0% | - | - | - | - |
nnrpd timer:
| Code region | Time | Pct | Invoked | Min(ms) | Avg(ms) | Max(ms) |
|---|---|---|---|---|---|---|
| idle | 00:00:03.404 | 22.6% | 321 | 0.167 | 10.604 | 25.169 |
| newnews | 00:00:00.000 | 0.0% | 0 | 0.000 | 0.000 | 0.000 |
| nntpwrite | 00:00:00.008 | 0.1% | 1044 | 0.000 | 0.008 | 0.048 |
| readart | 00:00:00.025 | 0.2% | 2 | 12.500 | 12.500 | 12.500 |
| TOTAL: 00:00:15.043 | 00:00:03.437 | 22.8% | - | - | - | - |
Control commands to INND:
| Command | Number |
|---|---|
| L | 1 |
| flush | 3 |
| flushlogs | 2 |
| go | 2 |
| logmode | 2 |
| mode | 149 |
| name | 2 |
| pause | 2 |
| paused | 2 |
| reload | 2 |
| reserve | 2 |
| TOTAL: 11 | 169 |
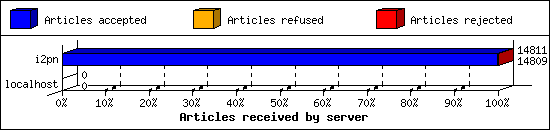
Incoming Feeds (INN):
| Server | Connects | Offered | Taken | Refused | Reject | %Accpt | Elapsed | |
|---|---|---|---|---|---|---|---|---|
| 1 | i2pn | 6 | 14811 | 14809 | 0 | 2 | 99% | 24:40:24 |
| 2 | localhost | 31 | 0 | 0 | 0 | 0 | 0% | 00:00:00 |
| TOTAL: 2 | 37 | 14811 | 14809 | 0 | 2 | 99% | 24:40:24 | |
Incoming Volume (INN):
| Server | AcceptVol | DupVol | RejVol | TotalVol | %Acc | Vol/Art | |
|---|---|---|---|---|---|---|---|
| 1 | i2pn | 42.8 MB | 0.0 KB | 3.8 KB | 42.8 MB | 99% | 3.0 KB |
| 2 | localhost | 0.0 KB | 0.0 KB | 0.0 KB | 0.0 KB | 0% | 0 |
| TOTAL: 2 | 42.8 MB | 0.0 KB | 3.8 KB | 42.8 MB | 99% | 3.0 KB | |

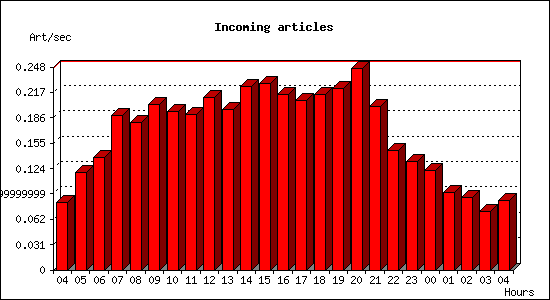
Incoming articles:
| Date | Articles | %Arts | Art/sec | Size | %Size | KB/sec |
|---|---|---|---|---|---|---|
| Aug 16 04:15:01 - 04:59:59 | 223 | 1.5% | 0.08 | 635.0 KB | 1.4% | 0.24 |
| Aug 16 05:00:00 - 05:59:59 | 429 | 2.9% | 0.12 | 1.3 MB | 3.0% | 0.36 |
| Aug 16 06:00:00 - 06:59:59 | 496 | 3.4% | 0.14 | 1.6 MB | 3.7% | 0.45 |
| Aug 16 07:00:00 - 07:59:59 | 681 | 4.6% | 0.19 | 2.1 MB | 4.9% | 0.60 |
| Aug 16 08:00:00 - 08:59:59 | 650 | 4.4% | 0.18 | 1.5 MB | 3.6% | 0.43 |
| Aug 16 09:00:00 - 09:59:59 | 727 | 4.9% | 0.20 | 2.0 MB | 4.8% | 0.58 |
| Aug 16 10:00:00 - 10:59:59 | 696 | 4.7% | 0.19 | 2.3 MB | 5.3% | 0.64 |
| Aug 16 11:00:00 - 11:59:59 | 685 | 4.6% | 0.19 | 1.8 MB | 4.2% | 0.52 |
| Aug 16 12:00:00 - 12:59:59 | 760 | 5.1% | 0.21 | 2.0 MB | 4.8% | 0.58 |
| Aug 16 13:00:00 - 13:59:59 | 705 | 4.8% | 0.20 | 1.8 MB | 4.3% | 0.52 |
| Aug 16 14:00:00 - 14:59:59 | 805 | 5.4% | 0.22 | 2.2 MB | 5.2% | 0.63 |
| Aug 16 15:00:00 - 15:59:59 | 820 | 5.5% | 0.23 | 2.2 MB | 5.2% | 0.63 |
| Aug 16 16:00:00 - 16:59:59 | 770 | 5.2% | 0.21 | 2.3 MB | 5.3% | 0.65 |
| Aug 16 17:00:00 - 17:59:59 | 744 | 5.0% | 0.21 | 2.2 MB | 5.1% | 0.62 |
| Aug 16 18:00:00 - 18:59:59 | 772 | 5.2% | 0.21 | 2.1 MB | 5.0% | 0.61 |
| Aug 16 19:00:00 - 19:59:59 | 797 | 5.4% | 0.22 | 2.4 MB | 5.6% | 0.68 |
| Aug 16 20:00:00 - 20:59:59 | 888 | 6.0% | 0.25 | 2.8 MB | 6.6% | 0.81 |
| Aug 16 21:00:00 - 21:59:59 | 720 | 4.9% | 0.20 | 2.0 MB | 4.7% | 0.58 |
| Aug 16 22:00:00 - 22:59:59 | 527 | 3.6% | 0.15 | 1.5 MB | 3.6% | 0.44 |
| Aug 16 23:00:00 - 23:59:59 | 479 | 3.2% | 0.13 | 1.4 MB | 3.3% | 0.41 |
| Aug 17 00:00:00 - 00:59:59 | 438 | 3.0% | 0.12 | 1.5 MB | 3.4% | 0.41 |
| Aug 17 01:00:00 - 01:59:59 | 339 | 2.3% | 0.09 | 1.1 MB | 2.5% | 0.30 |
| Aug 17 02:00:00 - 02:59:59 | 319 | 2.2% | 0.09 | 966.3 KB | 2.2% | 0.27 |
| Aug 17 03:00:00 - 03:59:59 | 258 | 1.7% | 0.07 | 764.1 KB | 1.7% | 0.21 |
| Aug 17 04:00:00 - 04:15:01 | 77 | 0.5% | 0.09 | 257.8 KB | 0.6% | 0.29 |
| TOTAL: 24:00:00 | 14805 | 100.0% | 0.17 | 42.8 MB | 100.0% | 0.51 |

Sites sending bad articles:
| Server | Total | Group | Dist | Duplic | Unapp | TooOld | Site | Line | Other | |
|---|---|---|---|---|---|---|---|---|---|---|
| 1 | i2pn | 331 | 2 | 0 | 0 | 0 | 0 | 0 | 0 | 329 |
| TOTAL: 1 | 331 | 2 | 0 | 0 | 0 | 0 | 0 | 0 | 329 | |
Unwanted newsgroups [Top 20]:
| Newsgroup | Count |
|---|---|
| alt.social-security-disability | 2 |
| TOTAL: 1 | 2 |
NoCeM on Spool:
| Id | Good | Bad | Unique | Total |
|---|---|---|---|---|
| bleachbot@httrack.com | 26 | 0 | 27 | 27 |
| TOTAL: 1 | 26 | 5 | 27 | 27 |
Miscellaneous innd statistics [Top 10]:
| Event | Server | Number |
|---|---|---|
| Including strange strings | ||
| i2pn | 329 | |
| TOTAL: 1 | 329 | |
| TOTAL: 1 | 329 | |
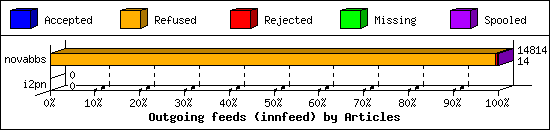
Outgoing Feeds (innfeed) by Articles:
| Server | Offered | Taken | Refused | Reject | Miss | Spool | %Took | Elapsed | |
|---|---|---|---|---|---|---|---|---|---|
| 1 | novabbs | 14829 | 14 | 14727 | 62 | 0 | 11 | 0% | 23:59:58 |
| 2 | i2pn | 0 | 0 | 0 | 0 | 0 | 0 | 0% | 00:10:00 |
| TOTAL: 2 | 14829 | 14 | 14727 | 62 | 0 | 11 | 0% | 24:09:58 | |
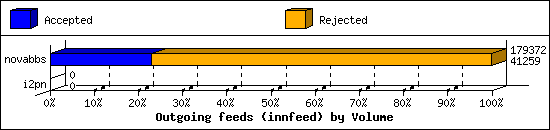
Outgoing Feeds (innfeed) by Volume:
| Server | AcceptVol | RejectVol | TotalVol | Volume/sec | Vol/Art | Elapsed | |
|---|---|---|---|---|---|---|---|
| 1 | novabbs | 40.3 KB | 134.9 KB | 175.2 KB | 0.0 KB/s | 2.3 KB | 23:59:58 |
| 2 | i2pn | 0.0 KB | 0.0 KB | 0.0 KB | 0.0 KB/s | 0 | 00:10:00 |
| TOTAL: 2 | 40.3 KB | 134.9 KB | 175.2 KB | 0.0 KB/s | 2.3 KB | 24:09:58 | |
NNRP readership statistics:
| System | Conn | Arts | Size | Groups | Post | Rej | Elapsed | |
|---|---|---|---|---|---|---|---|---|
| 1 | i2pn2.org | 43 | 2 | 3.9 KB | 2 | 0 | 0 | 00:00:14 |
| TOTAL: 1 | 43 | 2 | 3.9 KB | 2 | 0 | 0 | 00:00:14 | |
NNRP readership statistics (by domain):
| System | Conn | Arts | Size | Groups | Post | Rej | Elapsed | |
|---|---|---|---|---|---|---|---|---|
| 1 | *.org | 43 | 2 | 3.9 KB | 2 | 0 | 0 | 00:00:14 |
| TOTAL: 1 | 43 | 2 | 3.9 KB | 2 | 0 | 0 | 00:00:14 | |
NNRP auth users [Top 20]:
| User | Conn |
|---|---|
| i2pn2user | 43 |
| TOTAL: 1 | 43 |
NNRP total resource statistics [Top 20]:
| System | User(ms) | System(ms) | Idle(ms) | Elapsed |
|---|---|---|---|---|
| i2pn2.org | 2.180 | 0.376 | 4.783 | 00:00:14 |
| TOTAL: 1 | 2.180 | 0.376 | 4.783 | 00:00:14 |
Newsgroup request counts (by category):
| Category | Count | Pct | |
|---|---|---|---|
| 1 | rocksolid | 2 | 100.0% |
| TOTAL: 1 | 2 | 100.0% | |
Newsgroup request counts (by newsgroup) [Top 100]:
| Newsgroup | Count | |
|---|---|---|
| 1 | rocksolid.shared.offtopic | 2 |
| TOTAL: 1 | 2 | |
