Log entries by program:
| Program name | Lines | %Lines | Size | %Size |
|---|---|---|---|---|
| inn | 13975 | 87.7% | 1.2 MB | 83.3% |
| innd | 1065 | 6.7% | 156.0 KB | 10.9% |
| innfeed | 609 | 3.8% | 57.9 KB | 4.1% |
| nnrpd | 234 | 1.5% | 18.9 KB | 1.3% |
| nocem | 53 | 0.3% | 5.2 KB | 0.4% |
| controlchan | 1 | 0.0% | 0.1 KB | 0.0% |
| TOTAL: 6 | 15937 | 100.0% | 1.4 MB | 100.0% |
History cache:
| Reason | Count | %Count |
|---|---|---|
| Do not exist | 13462 | 97.5% |
| Negative hits | 294 | 2.1% |
| Positive hits | 38 | 0.3% |
| Cache misses | 11 | 0.1% |
| TOTAL: 4 | 13805 | 100.0% |
INND timer:
| Code region | Time | Pct | Invoked | Min(ms) | Avg(ms) | Max(ms) |
|---|---|---|---|---|---|---|
| article cancel | 00:00:00.049 | 0.0% | 98 | 0.000 | 0.500 | 3.000 |
| article cleanup | 00:00:00.088 | 0.0% | 13463 | 0.000 | 0.007 | 0.047 |
| article logging | 00:00:00.425 | 0.0% | 13861 | 0.000 | 0.031 | 0.081 |
| article parse | 00:00:00.209 | 0.0% | 15089 | 0.000 | 0.014 | 0.071 |
| article write | 00:00:07.524 | 0.0% | 13454 | 0.164 | 0.559 | 3.042 |
| artlog/artcncl | 00:00:00.001 | 0.0% | 98 | 0.000 | 0.010 | 0.200 |
| data move | 00:00:00.004 | 0.0% | 16867 | 0.000 | 0.000 | 0.015 |
| hisgrep/artcncl | 00:00:00.005 | 0.0% | 59 | 0.000 | 0.085 | 1.000 |
| hishave/artcncl | 00:00:00.006 | 0.0% | 98 | 0.000 | 0.061 | 1.000 |
| history grep | 00:00:00.000 | 0.0% | 0 | 0.000 | 0.000 | 0.000 |
| history lookup | 00:00:04.020 | 0.0% | 13764 | 0.000 | 0.292 | 2.198 |
| history sync | 00:00:00.023 | 0.0% | 421 | 0.000 | 0.055 | 0.500 |
| history write | 00:00:03.800 | 0.0% | 13463 | 0.000 | 0.282 | 1.387 |
| hiswrite/artcncl | 00:00:00.007 | 0.0% | 39 | 0.000 | 0.179 | 1.000 |
| idle | 24:00:34.203 | 100.0% | 15914 | 2910.650 | 5431.331 | 12777.298 |
| nntp read | 00:00:00.396 | 0.0% | 15489 | 0.000 | 0.026 | 0.083 |
| overview write | 00:00:03.334 | 0.0% | 13454 | 0.042 | 0.248 | 3.129 |
| perl filter | 00:00:19.208 | 0.0% | 13463 | 1.152 | 1.427 | 2.387 |
| python filter | 00:00:00.000 | 0.0% | 0 | 0.000 | 0.000 | 0.000 |
| site send | 00:00:00.454 | 0.0% | 13498 | 0.000 | 0.034 | 0.098 |
| TOTAL: 24:01:16.241 | 24:01:13.756 | 100.0% | - | - | - | - |
INNfeed timer:
| Code region | Time | Pct | Invoked | Min(ms) | Avg(ms) | Max(ms) |
|---|---|---|---|---|---|---|
| article new | 00:00:00.029 | 0.0% | 13628 | 0.000 | 0.002 | 0.027 |
| article prepare | 00:00:00.000 | 0.0% | 524 | 0.000 | 0.000 | 0.000 |
| article read | 00:00:00.040 | 0.0% | 131 | 0.000 | 0.305 | 36.000 |
| backlog stats | 00:00:00.009 | 0.0% | 27018 | 0.000 | 0.000 | 0.012 |
| callbacks | 00:00:00.000 | 0.0% | 0 | 0.000 | 0.000 | 0.000 |
| data read | 00:00:00.152 | 0.0% | 18166 | 0.000 | 0.008 | 0.066 |
| data write | 00:00:00.104 | 0.0% | 4704 | 0.000 | 0.022 | 0.063 |
| idle | 23:59:17.958 | 100.0% | 27018 | 1307.556 | 3196.312 | 9234.209 |
| status file | 00:00:00.059 | 0.0% | 162 | 0.000 | 0.364 | 2.000 |
| TOTAL: 23:59:18.659 | 23:59:18.351 | 100.0% | - | - | - | - |
nnrpd timer:
| Code region | Time | Pct | Invoked | Min(ms) | Avg(ms) | Max(ms) |
|---|---|---|---|---|---|---|
| idle | 00:00:13.390 | 45.2% | 305 | 0.000 | 43.902 | 9804.000 |
| newnews | 00:00:00.000 | 0.0% | 0 | 0.000 | 0.000 | 0.000 |
| nntpwrite | 00:00:00.013 | 0.0% | 1063 | 0.000 | 0.012 | 0.095 |
| TOTAL: 00:00:29.600 | 00:00:13.403 | 45.3% | - | - | - | - |
Control commands to INND:
| Command | Number |
|---|---|
| L | 1 |
| flush | 3 |
| flushlogs | 2 |
| go | 2 |
| logmode | 2 |
| mode | 149 |
| name | 2 |
| pause | 2 |
| paused | 2 |
| reload | 2 |
| reserve | 2 |
| TOTAL: 11 | 169 |
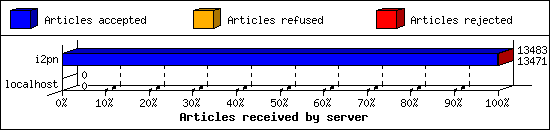
Incoming Feeds (INN):
| Server | Connects | Offered | Taken | Refused | Reject | %Accpt | Elapsed | |
|---|---|---|---|---|---|---|---|---|
| 1 | i2pn | 8 | 13483 | 13471 | 0 | 12 | 99% | 24:46:13 |
| 2 | localhost | 32 | 0 | 0 | 0 | 0 | 0% | 00:00:00 |
| TOTAL: 2 | 40 | 13483 | 13471 | 0 | 12 | 99% | 24:46:13 | |
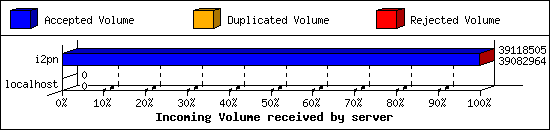
Incoming Volume (INN):
| Server | AcceptVol | DupVol | RejVol | TotalVol | %Acc | Vol/Art | |
|---|---|---|---|---|---|---|---|
| 1 | i2pn | 37.3 MB | 0.0 KB | 34.7 KB | 37.3 MB | 99% | 2.8 KB |
| 2 | localhost | 0.0 KB | 0.0 KB | 0.0 KB | 0.0 KB | 0% | 0 |
| TOTAL: 2 | 37.3 MB | 0.0 KB | 34.7 KB | 37.3 MB | 99% | 2.8 KB | |
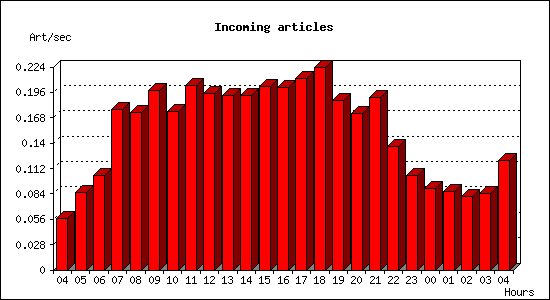
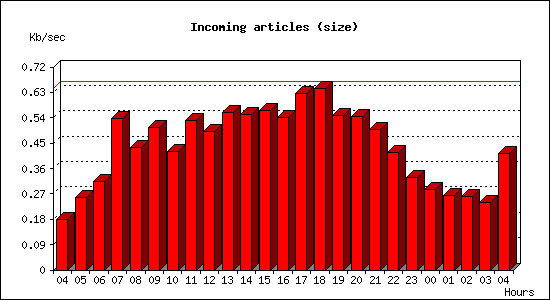
Incoming articles:
| Date | Articles | %Arts | Art/sec | Size | %Size | KB/sec |
|---|---|---|---|---|---|---|
| Aug 18 04:15:02 - 04:59:59 | 154 | 1.1% | 0.06 | 487.6 KB | 1.3% | 0.18 |
| Aug 18 05:00:00 - 05:59:59 | 307 | 2.3% | 0.09 | 923.3 KB | 2.4% | 0.26 |
| Aug 18 06:00:00 - 06:59:59 | 376 | 2.8% | 0.10 | 1.1 MB | 3.0% | 0.31 |
| Aug 18 07:00:00 - 07:59:59 | 636 | 4.7% | 0.18 | 1.9 MB | 5.1% | 0.54 |
| Aug 18 08:00:00 - 08:59:59 | 627 | 4.7% | 0.17 | 1.5 MB | 4.1% | 0.44 |
| Aug 18 09:00:00 - 09:59:59 | 715 | 5.3% | 0.20 | 1.8 MB | 4.8% | 0.51 |
| Aug 18 10:00:00 - 10:59:59 | 630 | 4.7% | 0.17 | 1.5 MB | 4.0% | 0.42 |
| Aug 18 11:00:00 - 11:59:59 | 734 | 5.4% | 0.20 | 1.9 MB | 5.0% | 0.53 |
| Aug 18 12:00:00 - 12:59:59 | 700 | 5.2% | 0.19 | 1.7 MB | 4.6% | 0.49 |
| Aug 18 13:00:00 - 13:59:59 | 694 | 5.2% | 0.19 | 2.0 MB | 5.3% | 0.56 |
| Aug 18 14:00:00 - 14:59:59 | 694 | 5.2% | 0.19 | 1.9 MB | 5.2% | 0.55 |
| Aug 18 15:00:00 - 15:59:59 | 728 | 5.4% | 0.20 | 2.0 MB | 5.3% | 0.57 |
| Aug 18 16:00:00 - 16:59:59 | 725 | 5.4% | 0.20 | 1.9 MB | 5.1% | 0.54 |
| Aug 18 17:00:00 - 17:59:59 | 760 | 5.6% | 0.21 | 2.2 MB | 5.9% | 0.62 |
| Aug 18 18:00:00 - 18:59:59 | 803 | 6.0% | 0.22 | 2.3 MB | 6.1% | 0.64 |
| Aug 18 19:00:00 - 19:59:59 | 675 | 5.0% | 0.19 | 1.9 MB | 5.2% | 0.55 |
| Aug 18 20:00:00 - 20:59:59 | 622 | 4.6% | 0.17 | 1.9 MB | 5.1% | 0.55 |
| Aug 18 21:00:00 - 21:59:59 | 687 | 5.1% | 0.19 | 1.8 MB | 4.7% | 0.50 |
| Aug 18 22:00:00 - 22:59:59 | 489 | 3.6% | 0.14 | 1.5 MB | 3.9% | 0.42 |
| Aug 18 23:00:00 - 23:59:59 | 377 | 2.8% | 0.10 | 1.1 MB | 3.1% | 0.33 |
| Aug 19 00:00:00 - 00:59:59 | 324 | 2.4% | 0.09 | 1021.9 KB | 2.7% | 0.28 |
| Aug 19 01:00:00 - 01:59:59 | 310 | 2.3% | 0.09 | 947.6 KB | 2.5% | 0.26 |
| Aug 19 02:00:00 - 02:59:59 | 292 | 2.2% | 0.08 | 944.4 KB | 2.5% | 0.26 |
| Aug 19 03:00:00 - 03:59:59 | 303 | 2.2% | 0.08 | 866.2 KB | 2.3% | 0.24 |
| Aug 19 04:00:00 - 04:15:01 | 109 | 0.8% | 0.12 | 371.8 KB | 1.0% | 0.41 |
| TOTAL: 23:59:59 | 13471 | 100.0% | 0.16 | 37.3 MB | 100.0% | 0.44 |
Sites sending bad articles:
| Server | Total | Group | Dist | Duplic | Unapp | TooOld | Site | Line | Other | |
|---|---|---|---|---|---|---|---|---|---|---|
| 1 | i2pn | 408 | 12 | 0 | 0 | 0 | 0 | 0 | 0 | 396 |
| TOTAL: 1 | 408 | 12 | 0 | 0 | 0 | 0 | 0 | 0 | 396 | |
Unwanted newsgroups [Top 20]:
| Newsgroup | Count |
|---|---|
| alt.pl.nieruchomosci.gielda | 11 |
| alt.fr.outil.thunderbird | 1 |
| TOTAL: 2 | 12 |
NoCeM on Spool:
| Id | Good | Bad | Unique | Total |
|---|---|---|---|---|
| bleachbot@httrack.com | 43 | 0 | 56 | 56 |
| TOTAL: 1 | 43 | 3 | 56 | 56 |
Miscellaneous innd statistics [Top 10]:
| Event | Server | Number |
|---|---|---|
| Including strange strings | ||
| i2pn | 396 | |
| TOTAL: 1 | 396 | |
| TOTAL: 1 | 396 | |
Outgoing Feeds (innfeed) by Articles:
| Server | Offered | Taken | Refused | Reject | Miss | Spool | %Took | Elapsed | |
|---|---|---|---|---|---|---|---|---|---|
| 1 | novabbs | 4655 | 56 | 4452 | 58 | 0 | 9066 | 1% | 23:59:57 |
| 2 | i2pn | 0 | 0 | 0 | 0 | 0 | 0 | 0% | 00:10:00 |
| TOTAL: 2 | 4655 | 56 | 4452 | 58 | 0 | 9066 | 1% | 24:09:57 | |

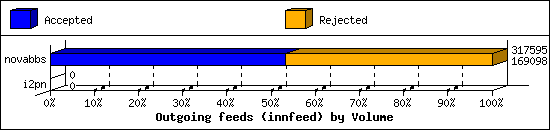
Outgoing Feeds (innfeed) by Volume:
| Server | AcceptVol | RejectVol | TotalVol | Volume/sec | Vol/Art | Elapsed | |
|---|---|---|---|---|---|---|---|
| 1 | novabbs | 165.1 KB | 145.0 KB | 310.2 KB | 0.0 KB/s | 2.7 KB | 23:59:57 |
| 2 | i2pn | 0.0 KB | 0.0 KB | 0.0 KB | 0.0 KB/s | 0 | 00:10:00 |
| TOTAL: 2 | 165.1 KB | 145.0 KB | 310.2 KB | 0.0 KB/s | 2.7 KB | 24:09:57 | |
NNRP readership statistics:
| System | Conn | Arts | Size | Groups | Post | Rej | Elapsed | |
|---|---|---|---|---|---|---|---|---|
| 1 | 162.243.145.81 | 1 | 0 | 0.0 KB | 0 | 0 | 0 | 00:00:09 |
| 2 | scan-141.security.ipip.net | 1 | 0 | 0.0 KB | 0 | 0 | 0 | 00:00:05 |
| 3 | i2pn2.org | 40 | 0 | 0.0 KB | 0 | 0 | 0 | 00:00:13 |
| TOTAL: 3 | 42 | 0 | 0.0 KB | 0 | 0 | 0 | 00:00:29 | |
NNRP readership statistics (by domain):
| System | Conn | Arts | Size | Groups | Post | Rej | Elapsed | |
|---|---|---|---|---|---|---|---|---|
| 1 | *.security.ipip.net | 1 | 0 | 0.0 KB | 0 | 0 | 0 | 00:00:05 |
| 2 | unresolved | 1 | 0 | 0.0 KB | 0 | 0 | 0 | 00:00:09 |
| 3 | *.org | 40 | 0 | 0.0 KB | 0 | 0 | 0 | 00:00:13 |
| TOTAL: 3 | 42 | 0 | 0.0 KB | 0 | 0 | 0 | 00:00:29 | |
NNRP auth users [Top 20]:
| User | Conn |
|---|---|
| i2pn2user | 40 |
| TOTAL: 1 | 40 |
NNRP total resource statistics [Top 20]:
| System | User(ms) | System(ms) | Idle(ms) | Elapsed |
|---|---|---|---|---|
| i2pn2.org | 1.952 | 0.336 | 3.925 | 00:00:13 |
| 162.243.145.81 | 0.060 | 0.008 | 0.000 | 00:00:09 |
| scan-141.security.ipip.net | 0.044 | 0.004 | 0.000 | 00:00:05 |
| TOTAL: 3 | 2.056 | 0.348 | 3.925 | 00:00:29 |
NNRP unrecognized commands (by host):
| System | Conn |
|---|---|
| scan-141.security.ipip.net | 4 |
| TOTAL: 1 | 4 |
NNRP unrecognized commands (by command):
| Command | Count |
|---|---|
| User-Agent: HTTP Banner Detection (https... | 1 |
| Connection: close | 1 |
| Host: 157.230.63.40:119 | 1 |
| GET / HTTP/1.1 | 1 |
| TOTAL: 4 | 4 |
