Log entries by program:
| Program name | Lines | %Lines | Size | %Size |
|---|---|---|---|---|
| inn | 16156 | 75.6% | 1.3 MB | 73.0% |
| nnrpd | 3515 | 16.4% | 279.0 KB | 15.0% |
| innd | 1024 | 4.8% | 150.3 KB | 8.1% |
| innfeed | 602 | 2.8% | 64.9 KB | 3.5% |
| nocem | 74 | 0.3% | 7.2 KB | 0.4% |
| controlchan | 1 | 0.0% | 0.1 KB | 0.0% |
| TOTAL: 6 | 21372 | 100.0% | 1.8 MB | 100.0% |
History cache:
| Reason | Count | %Count |
|---|---|---|
| Do not exist | 15546 | 98.5% |
| Negative hits | 136 | 0.9% |
| Positive hits | 79 | 0.5% |
| Cache misses | 22 | 0.1% |
| TOTAL: 4 | 15783 | 100.0% |
INND timer:
| Code region | Time | Pct | Invoked | Min(ms) | Avg(ms) | Max(ms) |
|---|---|---|---|---|---|---|
| article cancel | 00:00:00.108 | 0.0% | 131 | 0.000 | 0.824 | 2.800 |
| article cleanup | 00:00:00.111 | 0.0% | 15559 | 0.000 | 0.007 | 0.031 |
| article logging | 00:00:00.449 | 0.0% | 16031 | 0.000 | 0.028 | 0.094 |
| article parse | 00:00:00.240 | 0.0% | 17387 | 0.000 | 0.014 | 0.051 |
| article write | 00:00:13.771 | 0.0% | 15555 | 0.235 | 0.885 | 5.238 |
| artlog/artcncl | 00:00:00.005 | 0.0% | 130 | 0.000 | 0.038 | 0.500 |
| data move | 00:00:00.009 | 0.0% | 19181 | 0.000 | 0.000 | 0.014 |
| hisgrep/artcncl | 00:00:00.015 | 0.0% | 106 | 0.000 | 0.142 | 1.000 |
| hishave/artcncl | 00:00:00.017 | 0.0% | 131 | 0.000 | 0.130 | 1.000 |
| history grep | 00:00:00.000 | 0.0% | 0 | 0.000 | 0.000 | 0.000 |
| history lookup | 00:00:08.763 | 0.0% | 15710 | 0.000 | 0.558 | 2.085 |
| history sync | 00:00:00.015 | 0.0% | 302 | 0.000 | 0.050 | 1.000 |
| history write | 00:00:06.909 | 0.0% | 15559 | 0.000 | 0.444 | 1.760 |
| hiswrite/artcncl | 00:00:00.009 | 0.0% | 25 | 0.000 | 0.360 | 1.000 |
| idle | 23:59:22.611 | 99.9% | 19062 | 2156.838 | 4530.616 | 16217.973 |
| nntp read | 00:00:00.495 | 0.0% | 17607 | 0.000 | 0.028 | 0.082 |
| overview write | 00:00:04.914 | 0.0% | 15555 | 0.085 | 0.316 | 1.883 |
| perl filter | 00:00:23.546 | 0.0% | 15559 | 1.193 | 1.513 | 2.854 |
| python filter | 00:00:00.000 | 0.0% | 0 | 0.000 | 0.000 | 0.000 |
| site send | 00:00:00.669 | 0.0% | 15621 | 0.000 | 0.043 | 0.115 |
| TOTAL: 24:00:26.220 | 24:00:22.656 | 100.0% | - | - | - | - |
INNfeed timer:
| Code region | Time | Pct | Invoked | Min(ms) | Avg(ms) | Max(ms) |
|---|---|---|---|---|---|---|
| article new | 00:00:00.035 | 0.0% | 15536 | 0.000 | 0.002 | 0.022 |
| article prepare | 00:00:00.000 | 0.0% | 1316 | 0.000 | 0.000 | 0.000 |
| article read | 00:00:00.057 | 0.0% | 329 | 0.000 | 0.173 | 23.000 |
| backlog stats | 00:00:00.021 | 0.0% | 45356 | 0.000 | 0.000 | 0.013 |
| callbacks | 00:00:00.000 | 0.0% | 0 | 0.000 | 0.000 | 0.000 |
| data read | 00:00:00.269 | 0.0% | 28249 | 0.000 | 0.010 | 0.055 |
| data write | 00:00:00.253 | 0.0% | 12758 | 0.000 | 0.020 | 0.068 |
| idle | 23:58:19.347 | 100.0% | 45356 | 994.414 | 1902.711 | 10554.737 |
| status file | 00:00:00.054 | 0.0% | 157 | 0.000 | 0.344 | 2.000 |
| TOTAL: 23:58:20.507 | 23:58:20.036 | 100.0% | - | - | - | - |
nnrpd timer:
| Code region | Time | Pct | Invoked | Min(ms) | Avg(ms) | Max(ms) |
|---|---|---|---|---|---|---|
| idle | 00:33:54.949 | 95.0% | 4308 | 6.833 | 472.365 | 300007.833 |
| newnews | 00:00:00.000 | 0.0% | 0 | 0.000 | 0.000 | 0.000 |
| nntpwrite | 00:00:00.237 | 0.0% | 14349 | 0.000 | 0.017 | 0.929 |
| readart | 00:00:01.983 | 0.1% | 304 | 2.600 | 6.523 | 38.000 |
| TOTAL: 00:35:43.066 | 00:33:57.169 | 95.1% | - | - | - | - |
Control commands to INND:
| Command | Number |
|---|---|
| L | 1 |
| flush | 3 |
| flushlogs | 2 |
| go | 2 |
| logmode | 2 |
| mode | 149 |
| name | 2 |
| pause | 2 |
| paused | 2 |
| reload | 2 |
| reserve | 2 |
| TOTAL: 11 | 169 |
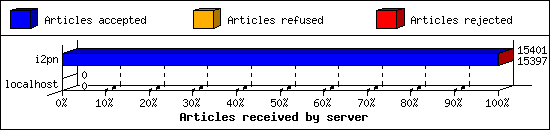
Incoming Feeds (INN):
| Server | Connects | Offered | Taken | Refused | Reject | %Accpt | Elapsed | |
|---|---|---|---|---|---|---|---|---|
| 1 | i2pn | 5 | 15401 | 15397 | 0 | 4 | 99% | 23:57:11 |
| 2 | localhost | 29 | 0 | 0 | 0 | 0 | 0% | 00:00:00 |
| TOTAL: 2 | 34 | 15401 | 15397 | 0 | 4 | 99% | 23:57:11 | |
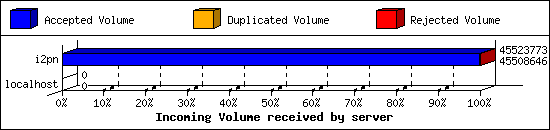
Incoming Volume (INN):
| Server | AcceptVol | DupVol | RejVol | TotalVol | %Acc | Vol/Art | |
|---|---|---|---|---|---|---|---|
| 1 | i2pn | 43.4 MB | 0.0 KB | 14.8 KB | 43.4 MB | 99% | 2.9 KB |
| 2 | localhost | 0.0 KB | 0.0 KB | 0.0 KB | 0.0 KB | 0% | 0 |
| TOTAL: 2 | 43.4 MB | 0.0 KB | 14.8 KB | 43.4 MB | 99% | 2.9 KB | |
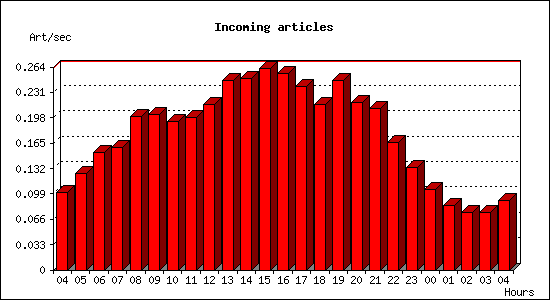
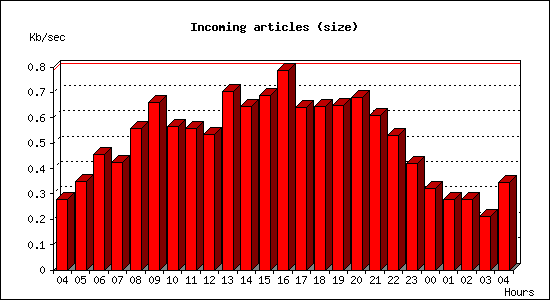
Incoming articles:
| Date | Articles | %Arts | Art/sec | Size | %Size | KB/sec |
|---|---|---|---|---|---|---|
| Aug 22 04:15:02 - 04:59:59 | 273 | 1.8% | 0.10 | 750.4 KB | 1.7% | 0.28 |
| Aug 22 05:00:00 - 05:59:59 | 454 | 2.9% | 0.13 | 1.2 MB | 2.8% | 0.35 |
| Aug 22 06:00:00 - 06:59:59 | 550 | 3.5% | 0.15 | 1.6 MB | 3.7% | 0.46 |
| Aug 22 07:00:00 - 07:59:59 | 572 | 3.7% | 0.16 | 1.5 MB | 3.4% | 0.42 |
| Aug 22 08:00:00 - 08:59:59 | 719 | 4.6% | 0.20 | 2.0 MB | 4.5% | 0.56 |
| Aug 22 09:00:00 - 09:59:59 | 726 | 4.7% | 0.20 | 2.3 MB | 5.3% | 0.66 |
| Aug 22 10:00:00 - 10:59:59 | 693 | 4.5% | 0.19 | 2.0 MB | 4.5% | 0.57 |
| Aug 22 11:00:00 - 11:59:59 | 713 | 4.6% | 0.20 | 2.0 MB | 4.5% | 0.56 |
| Aug 22 12:00:00 - 12:59:59 | 773 | 5.0% | 0.21 | 1.9 MB | 4.3% | 0.53 |
| Aug 22 13:00:00 - 13:59:59 | 885 | 5.7% | 0.25 | 2.5 MB | 5.6% | 0.70 |
| Aug 22 14:00:00 - 14:59:59 | 896 | 5.8% | 0.25 | 2.3 MB | 5.2% | 0.64 |
| Aug 22 15:00:00 - 15:59:59 | 943 | 6.1% | 0.26 | 2.4 MB | 5.5% | 0.69 |
| Aug 22 16:00:00 - 16:59:59 | 921 | 5.9% | 0.26 | 2.8 MB | 6.3% | 0.79 |
| Aug 22 17:00:00 - 17:59:59 | 858 | 5.5% | 0.24 | 2.3 MB | 5.1% | 0.64 |
| Aug 22 18:00:00 - 18:59:59 | 775 | 5.0% | 0.22 | 2.3 MB | 5.2% | 0.64 |
| Aug 22 19:00:00 - 19:59:59 | 885 | 5.7% | 0.25 | 2.3 MB | 5.2% | 0.65 |
| Aug 22 20:00:00 - 20:59:59 | 782 | 5.0% | 0.22 | 2.4 MB | 5.5% | 0.68 |
| Aug 22 21:00:00 - 21:59:59 | 757 | 4.9% | 0.21 | 2.1 MB | 4.9% | 0.61 |
| Aug 22 22:00:00 - 22:59:59 | 599 | 3.9% | 0.17 | 1.9 MB | 4.3% | 0.53 |
| Aug 22 23:00:00 - 23:59:59 | 478 | 3.1% | 0.13 | 1.5 MB | 3.4% | 0.42 |
| Aug 23 00:00:00 - 00:59:59 | 375 | 2.4% | 0.10 | 1.1 MB | 2.6% | 0.32 |
| Aug 23 01:00:00 - 01:59:59 | 304 | 2.0% | 0.08 | 1005.4 KB | 2.2% | 0.28 |
| Aug 23 02:00:00 - 02:59:59 | 269 | 1.7% | 0.07 | 1003.1 KB | 2.2% | 0.28 |
| Aug 23 03:00:00 - 03:59:59 | 268 | 1.7% | 0.07 | 759.9 KB | 1.7% | 0.21 |
| Aug 23 04:00:00 - 04:15:02 | 82 | 0.5% | 0.09 | 309.3 KB | 0.7% | 0.34 |
| TOTAL: 24:00:00 | 15550 | 100.0% | 0.18 | 43.9 MB | 100.0% | 0.52 |
Sites sending bad articles:
| Server | Total | Group | Dist | Duplic | Unapp | TooOld | Site | Line | Other | |
|---|---|---|---|---|---|---|---|---|---|---|
| 1 | i2pn | 476 | 2 | 0 | 0 | 0 | 0 | 0 | 0 | 474 |
| TOTAL: 1 | 476 | 2 | 0 | 0 | 0 | 0 | 0 | 0 | 474 | |
Unwanted newsgroups [Top 20]:
| Newsgroup | Count |
|---|---|
| 24hoursupport.helpdesk | 2 |
| TOTAL: 1 | 2 |
INND Perl filter [Top 20]:
| Reason | Count |
|---|---|
| EMP (phl) | 2 |
| TOTAL: 1 | 2 |
NoCeM on Spool:
| Id | Good | Bad | Unique | Total |
|---|---|---|---|---|
| bleachbot@httrack.com | 32 | 0 | 33 | 33 |
| TOTAL: 1 | 32 | 38 | 33 | 33 |
Miscellaneous innd statistics [Top 10]:
| Event | Server | Number |
|---|---|---|
| Including strange strings | ||
| i2pn | 472 | |
| TOTAL: 1 | 472 | |
| TOTAL: 1 | 472 | |
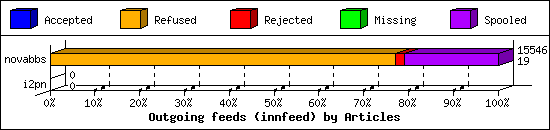
Outgoing Feeds (innfeed) by Articles:
| Server | Offered | Taken | Refused | Reject | Miss | Spool | %Took | Elapsed | |
|---|---|---|---|---|---|---|---|---|---|
| 1 | novabbs | 12418 | 19 | 11969 | 310 | 0 | 3248 | 0% | 23:59:58 |
| 2 | i2pn | 0 | 0 | 0 | 0 | 0 | 0 | 0% | 00:10:00 |
| TOTAL: 2 | 12418 | 19 | 11969 | 310 | 0 | 3248 | 0% | 24:09:58 | |
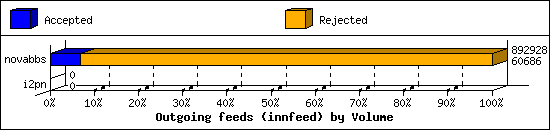
Outgoing Feeds (innfeed) by Volume:
| Server | AcceptVol | RejectVol | TotalVol | Volume/sec | Vol/Art | Elapsed | |
|---|---|---|---|---|---|---|---|
| 1 | novabbs | 59.3 KB | 812.7 KB | 872.0 KB | 0.0 KB/s | 2.7 KB | 23:59:58 |
| 2 | i2pn | 0.0 KB | 0.0 KB | 0.0 KB | 0.0 KB/s | 0 | 00:10:00 |
| TOTAL: 2 | 59.3 KB | 812.7 KB | 872.0 KB | 0.0 KB/s | 2.7 KB | 24:09:58 | |
NNRP readership statistics:
| System | Conn | Arts | Size | Groups | Post | Rej | Elapsed | |
|---|---|---|---|---|---|---|---|---|
| 1 | i2pn2.org | 619 | 304 | 914.9 KB | 304 | 0 | 0 | 00:35:30 |
| TOTAL: 1 | 619 | 304 | 914.9 KB | 304 | 0 | 0 | 00:35:40 | |
NNRP readership statistics (by domain):
| System | Conn | Arts | Size | Groups | Post | Rej | Elapsed | |
|---|---|---|---|---|---|---|---|---|
| 1 | *.org | 619 | 304 | 914.9 KB | 304 | 0 | 0 | 00:35:30 |
| 2 | unresolved | 1 | 0 | 0.0 KB | 0 | 0 | 0 | 00:00:09 |
| TOTAL: 2 | 620 | 304 | 914.9 KB | 304 | 0 | 0 | 00:35:40 | |
NNRP auth users [Top 20]:
| User | Conn |
|---|---|
| i2pn2user | 619 |
| TOTAL: 1 | 619 |
NNRP total resource statistics [Top 20]:
| System | User(ms) | System(ms) | Idle(ms) | Elapsed |
|---|---|---|---|---|
| i2pn2.org | 31.872 | 4.288 | 61.769 | 00:35:30 |
| 162.243.150.138 | 0.060 | 0.016 | 0.000 | 00:00:09 |
| TOTAL: 2 | 31.932 | 4.304 | 61.769 | 00:35:40 |
Curious NNRP server explorers [Top 20]:
| System | Conn |
|---|---|
| 162.243.150.138 | 1 |
| TOTAL: 1 | 1 |
NNRP client timeouts [Top 20]:
| System | Conn | Peer |
|---|---|---|
| i2pn2.org | 1 | 0 |
| TOTAL: 1 | 1 | 0 |
Newsgroup request counts (by category):
| Category | Count | Pct | |
|---|---|---|---|
| 1 | rocksolid | 304 | 100.0% |
| TOTAL: 1 | 304 | 100.0% | |
Newsgroup request counts (by newsgroup) [Top 100]:
| Newsgroup | Count | |
|---|---|---|
| 1 | rocksolid.shared.test | 239 |
| 2 | rocksolid.shared.news | 16 |
| 3 | rocksolid.shared.hacking | 12 |
| 4 | rocksolid.shared.helpdesk | 11 |
| 5 | rocksolid.nodes | 9 |
| 6 | rocksolid.shared.rocksolid | 8 |
| 7 | rocksolid.shared.i2p | 5 |
| 8 | rocksolid.shared.security | 2 |
| 9 | rocksolid.shared.general | 2 |
| TOTAL: 9 | 304 | |
