Log entries by program:
| Program name | Lines | %Lines | Size | %Size |
|---|---|---|---|---|
| inn | 15960 | 53.4% | 1.3 MB | 50.3% |
| nnrpd | 9818 | 32.8% | 820.3 KB | 30.7% |
| innd | 3057 | 10.2% | 381.4 KB | 14.3% |
| innfeed | 1009 | 3.4% | 119.7 KB | 4.5% |
| nocem | 62 | 0.2% | 6.6 KB | 0.2% |
| controlchan | 1 | 0.0% | 0.1 KB | 0.0% |
| TOTAL: 6 | 29907 | 100.0% | 2.6 MB | 100.0% |
History cache:
| Reason | Count | %Count |
|---|---|---|
| Do not exist | 15250 | 64.0% |
| Positive hits | 4786 | 20.1% |
| Negative hits | 3785 | 15.9% |
| Cache misses | 16 | 0.1% |
| TOTAL: 4 | 23837 | 100.0% |
INND timer:
| Code region | Time | Pct | Invoked | Min(ms) | Avg(ms) | Max(ms) |
|---|---|---|---|---|---|---|
| article cancel | 00:00:00.050 | 0.0% | 106 | 0.000 | 0.472 | 2.000 |
| article cleanup | 00:00:00.123 | 0.0% | 15500 | 0.000 | 0.008 | 0.046 |
| article logging | 00:00:00.502 | 0.0% | 15876 | 0.000 | 0.032 | 0.098 |
| article parse | 00:00:00.240 | 0.0% | 17612 | 0.000 | 0.014 | 0.061 |
| article write | 00:00:08.714 | 0.0% | 14128 | 0.232 | 0.617 | 5.000 |
| artlog/artcncl | 00:00:00.002 | 0.0% | 91 | 0.000 | 0.022 | 1.000 |
| data move | 00:00:00.025 | 0.0% | 25904 | 0.000 | 0.001 | 0.016 |
| hisgrep/artcncl | 00:00:00.008 | 0.0% | 62 | 0.000 | 0.129 | 1.000 |
| hishave/artcncl | 00:00:00.009 | 0.0% | 106 | 0.000 | 0.085 | 0.500 |
| history grep | 00:00:00.000 | 0.0% | 0 | 0.000 | 0.000 | 0.000 |
| history lookup | 00:00:05.038 | 0.0% | 23803 | 0.012 | 0.212 | 0.760 |
| history sync | 00:00:00.024 | 0.0% | 408 | 0.000 | 0.059 | 1.000 |
| history write | 00:00:04.593 | 0.0% | 15249 | 0.026 | 0.301 | 1.338 |
| hiswrite/artcncl | 00:00:00.012 | 0.0% | 44 | 0.000 | 0.273 | 0.833 |
| idle | 22:56:24.234 | 95.5% | 24772 | 1374.928 | 3333.773 | 9700.541 |
| nntp read | 00:00:00.450 | 0.0% | 24537 | 0.000 | 0.018 | 0.109 |
| overview write | 00:00:02.319 | 0.0% | 14128 | 0.027 | 0.164 | 1.692 |
| perl filter | 01:04:35.325 | 4.5% | 15249 | 118.055 | 254.136 | 621.517 |
| python filter | 00:00:00.000 | 0.0% | 0 | 0.000 | 0.000 | 0.000 |
| site send | 00:00:00.323 | 0.0% | 14184 | 0.000 | 0.023 | 0.071 |
| TOTAL: 24:01:26.914 | 24:01:21.991 | 100.0% | - | - | - | - |
INNfeed timer:
| Code region | Time | Pct | Invoked | Min(ms) | Avg(ms) | Max(ms) |
|---|---|---|---|---|---|---|
| article new | 00:00:00.028 | 0.0% | 14107 | 0.000 | 0.002 | 0.018 |
| article prepare | 00:00:00.003 | 0.0% | 36768 | 0.000 | 0.000 | 0.005 |
| article read | 00:00:00.475 | 0.0% | 9192 | 0.000 | 0.052 | 0.622 |
| backlog stats | 00:00:00.021 | 0.0% | 75128 | 0.000 | 0.000 | 0.004 |
| callbacks | 00:00:00.000 | 0.0% | 0 | 0.000 | 0.000 | 0.000 |
| data read | 00:00:00.344 | 0.0% | 40731 | 0.000 | 0.008 | 0.025 |
| data write | 00:00:00.646 | 0.0% | 26744 | 0.000 | 0.024 | 0.100 |
| idle | 23:58:15.485 | 100.0% | 75128 | 587.876 | 1148.646 | 3847.135 |
| status file | 00:00:00.245 | 0.0% | 303 | 0.000 | 0.809 | 22.000 |
| TOTAL: 23:58:18.228 | 23:58:17.247 | 100.0% | - | - | - | - |
nnrpd timer:
| Code region | Time | Pct | Invoked | Min(ms) | Avg(ms) | Max(ms) |
|---|---|---|---|---|---|---|
| idle | 00:17:50.626 | 95.3% | 14104 | 0.500 | 75.909 | 90695.500 |
| newnews | 00:00:00.000 | 0.0% | 0 | 0.000 | 0.000 | 0.000 |
| nntpwrite | 00:00:00.540 | 0.0% | 47153 | 0.000 | 0.011 | 1.087 |
| readart | 00:00:00.030 | 0.0% | 1 | 30.000 | 30.000 | 30.000 |
| TOTAL: 00:18:43.804 | 00:17:51.196 | 95.3% | - | - | - | - |
Control commands to INND:
| Command | Number |
|---|---|
| L | 1 |
| flush | 3 |
| flushlogs | 2 |
| go | 2 |
| logmode | 2 |
| mode | 148 |
| name | 2 |
| pause | 2 |
| paused | 2 |
| reload | 2 |
| reserve | 2 |
| TOTAL: 11 | 168 |
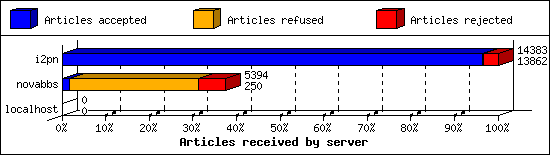
Incoming Feeds (INN):
| Server | Connects | Offered | Taken | Refused | Reject | %Accpt | Elapsed | |
|---|---|---|---|---|---|---|---|---|
| 1 | i2pn | 10 | 14383 | 13862 | 43 | 478 | 96% | 25:12:01 |
| 2 | novabbs | 184 | 5394 | 250 | 4260 | 884 | 4% | 21:53:42 |
| 3 | localhost | 31 | 0 | 0 | 0 | 0 | 0% | 00:00:02 |
| TOTAL: 3 | 225 | 19777 | 14112 | 4303 | 1362 | 71% | 47:05:45 | |
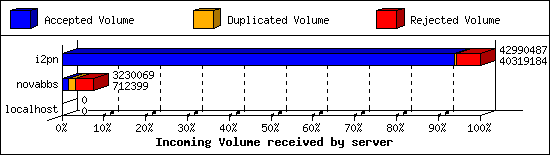
Incoming Volume (INN):
| Server | AcceptVol | DupVol | RejVol | TotalVol | %Acc | Vol/Art | |
|---|---|---|---|---|---|---|---|
| 1 | i2pn | 38.5 MB | 236.4 KB | 2.3 MB | 41.0 MB | 93% | 2.9 KB |
| 2 | novabbs | 695.7 KB | 612.2 KB | 1.8 MB | 3.1 MB | 22% | 2.8 KB |
| 3 | localhost | 0.0 KB | 0.0 KB | 0.0 KB | 0.0 KB | 0% | 0 |
| TOTAL: 3 | 39.1 MB | 848.5 KB | 4.1 MB | 44.1 MB | 88% | 2.9 KB | |
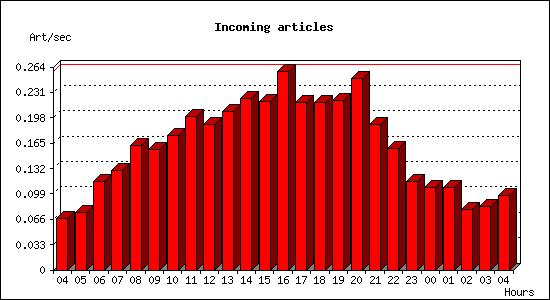
Incoming articles:
| Date | Articles | %Arts | Art/sec | Size | %Size | KB/sec |
|---|---|---|---|---|---|---|
| Sep 8 04:15:02 - 04:59:59 | 179 | 1.3% | 0.07 | 703.9 KB | 1.8% | 0.26 |
| Sep 8 05:00:00 - 05:59:59 | 267 | 1.9% | 0.07 | 700.1 KB | 1.7% | 0.19 |
| Sep 8 06:00:00 - 06:59:59 | 414 | 2.9% | 0.12 | 1.3 MB | 3.2% | 0.36 |
| Sep 8 07:00:00 - 07:59:59 | 467 | 3.3% | 0.13 | 1.4 MB | 3.5% | 0.39 |
| Sep 8 08:00:00 - 08:59:59 | 584 | 4.1% | 0.16 | 1.5 MB | 3.7% | 0.41 |
| Sep 8 09:00:00 - 09:59:59 | 565 | 4.0% | 0.16 | 1.5 MB | 3.8% | 0.42 |
| Sep 8 10:00:00 - 10:59:59 | 629 | 4.5% | 0.17 | 1.7 MB | 4.4% | 0.49 |
| Sep 8 11:00:00 - 11:59:59 | 719 | 5.1% | 0.20 | 1.8 MB | 4.6% | 0.51 |
| Sep 8 12:00:00 - 12:59:59 | 679 | 4.8% | 0.19 | 1.8 MB | 4.5% | 0.50 |
| Sep 8 13:00:00 - 13:59:59 | 743 | 5.3% | 0.21 | 2.0 MB | 5.1% | 0.57 |
| Sep 8 14:00:00 - 14:59:59 | 801 | 5.7% | 0.22 | 2.1 MB | 5.3% | 0.59 |
| Sep 8 15:00:00 - 15:59:59 | 791 | 5.6% | 0.22 | 2.3 MB | 6.0% | 0.67 |
| Sep 8 16:00:00 - 16:59:59 | 929 | 6.6% | 0.26 | 2.4 MB | 6.2% | 0.70 |
| Sep 8 17:00:00 - 17:59:59 | 782 | 5.5% | 0.22 | 2.1 MB | 5.4% | 0.60 |
| Sep 8 18:00:00 - 18:59:59 | 782 | 5.5% | 0.22 | 2.1 MB | 5.4% | 0.60 |
| Sep 8 19:00:00 - 19:59:59 | 793 | 5.6% | 0.22 | 2.3 MB | 5.9% | 0.65 |
| Sep 8 20:00:00 - 20:59:59 | 898 | 6.4% | 0.25 | 2.7 MB | 7.0% | 0.77 |
| Sep 8 21:00:00 - 21:59:59 | 682 | 4.8% | 0.19 | 1.9 MB | 4.9% | 0.54 |
| Sep 8 22:00:00 - 22:59:59 | 569 | 4.0% | 0.16 | 1.6 MB | 4.1% | 0.46 |
| Sep 8 23:00:00 - 23:59:59 | 413 | 2.9% | 0.11 | 1.2 MB | 3.0% | 0.33 |
| Sep 9 00:00:00 - 00:59:59 | 385 | 2.7% | 0.11 | 1021.6 KB | 2.5% | 0.28 |
| Sep 9 01:00:00 - 01:59:59 | 384 | 2.7% | 0.11 | 1.1 MB | 2.9% | 0.32 |
| Sep 9 02:00:00 - 02:59:59 | 282 | 2.0% | 0.08 | 889.3 KB | 2.2% | 0.25 |
| Sep 9 03:00:00 - 03:59:59 | 295 | 2.1% | 0.08 | 872.7 KB | 2.2% | 0.24 |
| Sep 9 04:00:00 - 04:15:04 | 87 | 0.6% | 0.10 | 303.4 KB | 0.8% | 0.34 |
| TOTAL: 24:00:02 | 14119 | 100.0% | 0.16 | 39.2 MB | 100.0% | 0.46 |

Sites sending bad articles:
| Server | Total | Group | Dist | Duplic | Unapp | TooOld | Site | Line | Other | |
|---|---|---|---|---|---|---|---|---|---|---|
| 1 | novabbs | 915 | 0 | 0 | 194 | 0 | 0 | 0 | 0 | 721 |
| 2 | i2pn | 836 | 12 | 0 | 57 | 0 | 0 | 0 | 0 | 767 |
| TOTAL: 2 | 1751 | 12 | 0 | 251 | 0 | 0 | 0 | 0 | 1488 | |
Unwanted newsgroups [Top 20]:
| Newsgroup | Count |
|---|---|
| alt.pl.nieruchomosci.gielda | 11 |
| 24hoursupport.helpdesk | 1 |
| TOTAL: 2 | 12 |
INND Perl filter [Top 20]:
| Reason | Count |
|---|---|
| EMP (phn path) | 673 |
| Exceeds Spam Level | 409 |
| EMP (phn nph) | 29 |
| TOTAL: 3 | 1111 |
NoCeM on Spool:
| Id | Good | Bad | Unique | Total |
|---|---|---|---|---|
| bleachbot@httrack.com | 48 | 0 | 61 | 61 |
| TOTAL: 1 | 48 | 8 | 61 | 61 |
Miscellaneous innd statistics [Top 10]:
| Event | Server | Number |
|---|---|---|
| Including strange strings | ||
| i2pn | 358 | |
| novabbs | 19 | |
| TOTAL: 2 | 377 | |
| TOTAL: 1 | 377 | |
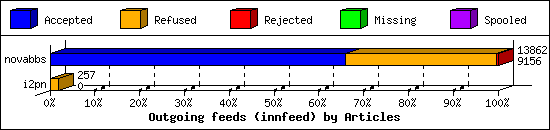
Outgoing Feeds (innfeed) by Articles:
| Server | Offered | Taken | Refused | Reject | Miss | Spool | %Took | Elapsed | |
|---|---|---|---|---|---|---|---|---|---|
| 1 | novabbs | 17324 | 9156 | 4661 | 45 | 0 | 0 | 52% | 23:59:41 |
| 2 | i2pn | 257 | 0 | 257 | 0 | 0 | 0 | 0% | 15:57:32 |
| TOTAL: 2 | 17581 | 9156 | 4918 | 45 | 0 | 0 | 52% | 39:57:13 | |
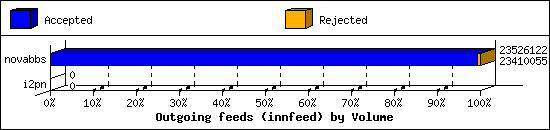
Outgoing Feeds (innfeed) by Volume:
| Server | AcceptVol | RejectVol | TotalVol | Volume/sec | Vol/Art | Elapsed | |
|---|---|---|---|---|---|---|---|
| 1 | novabbs | 22.3 MB | 113.3 KB | 22.4 MB | 0.3 KB/s | 2.5 KB | 23:59:41 |
| 2 | i2pn | 0.0 KB | 0.0 KB | 0.0 KB | 0.0 KB/s | 0 | 15:57:32 |
| TOTAL: 2 | 22.3 MB | 113.3 KB | 22.4 MB | 0.2 KB/s | 2.5 KB | 39:57:13 | |
NNRP readership statistics:
| System | Conn | Arts | Size | Groups | Post | Rej | Elapsed | |
|---|---|---|---|---|---|---|---|---|
| 1 | novabbs | 192 | 1 | 3.7 KB | 1 | 0 | 0 | 00:18:37 |
| TOTAL: 1 | 192 | 1 | 3.7 KB | 16 | 0 | 0 | 00:18:42 | |
NNRP readership statistics (by domain):
| System | Conn | Arts | Size | Groups | Post | Rej | Elapsed | |
|---|---|---|---|---|---|---|---|---|
| 1 | ? | 192 | 1 | 3.7 KB | 1 | 0 | 0 | 00:18:37 |
| 2 | *.org | 25 | 0 | 0.0 KB | 0 | 0 | 0 | 00:00:04 |
| 3 | *.census.shodan.io | 1 | 0 | 0.0 KB | 0 | 0 | 0 | 00:00:00 |
| TOTAL: 3 | 218 | 1 | 3.7 KB | 16 | 0 | 0 | 00:18:42 | |
NNRP auth users [Top 20]:
| User | Conn |
|---|---|
| retrobbs1 | 207 |
| TOTAL: 1 | 207 |
NNRP total resource statistics [Top 20]:
| System | User(ms) | System(ms) | Idle(ms) | Elapsed |
|---|---|---|---|---|
| novabbs | 40.188 | 6.316 | 0.529 | 00:18:37 |
| i2pn2.org | 1.412 | 0.172 | 0.066 | 00:00:04 |
| battery.census.shodan.io | 0.060 | 0.004 | 0.000 | 00:00:00 |
| TOTAL: 3 | 41.660 | 6.492 | 0.595 | 00:18:42 |
Curious NNRP server explorers [Top 20]:
| System | Conn |
|---|---|
| i2pn2.org | 25 |
| battery.census.shodan.io | 1 |
| TOTAL: 2 | 26 |
NNRP unrecognized commands (by host):
| System | Conn |
|---|---|
| novabbs | 41 |
| TOTAL: 1 | 41 |
NNRP unrecognized commands (by command):
| Command | Count |
|---|---|
| GET / HTTP/1.1 | 9 |
| Host: wwcqkwfo5yhe6uribv5tzylk25j5hkdk6g... | 8 |
| User-Agent: MYOB/6.66 (AN/ON) | 5 |
| Connection: close | 4 |
| X-Accept-Encoding: x-i2p-gzip;q=1.0, ide... | 3 |
| Accept-Encoding: gzip,deflate | 3 |
| Accept: text/html,application/xhtml+xml,... | 3 |
| Host: news-i2pn.i2p | 2 |
| Accept-Encoding: gzip, deflate | 1 |
| sentry-trace: 00-402b04ed44cf4f198180a16... | 1 |
| Accept-Encoding: identity | 1 |
| GET /?_escaped_fragment_=sig%3D32JwUI8P6... | 1 |
| TOTAL: 12 | 41 |
Newsgroup request counts (by category):
| Category | Count | Pct | |
|---|---|---|---|
| 1 | alt | 33 | 80.5% |
| 2 | rocksolid | 4 | 9.8% |
| 3 | news | 3 | 7.3% |
| 4 | comp | 1 | 2.4% |
| TOTAL: 4 | 41 | 100.0% | |
Newsgroup request counts (by newsgroup) [Top 100]:
| Newsgroup | Count | |
|---|---|---|
| 1 | alt.checkmate | 31 |
| 2 | news.admin.hierarchies | 3 |
| 3 | rocksolid.nodes | 3 |
| 4 | alt.privacy.anon-server | 2 |
| 5 | rocksolid.shared.test | 1 |
| 6 | comp.lang.c | 1 |
| TOTAL: 6 | 41 | |
