Log entries by program:
| Program name | Lines | %Lines | Size | %Size |
|---|---|---|---|---|
| nnrpd | 39586 | 65.6% | 3.5 MB | 65.9% |
| inn | 16659 | 27.6% | 1.4 MB | 25.4% |
| innd | 3150 | 5.2% | 366.1 KB | 6.7% |
| innfeed | 958 | 1.6% | 106.5 KB | 1.9% |
| nocem | 35 | 0.1% | 3.3 KB | 0.1% |
| controlchan | 1 | 0.0% | 0.1 KB | 0.0% |
| TOTAL: 6 | 60389 | 100.0% | 5.3 MB | 100.0% |
History cache:
| Reason | Count | %Count |
|---|---|---|
| Do not exist | 15980 | 64.7% |
| Positive hits | 4806 | 19.5% |
| Negative hits | 3890 | 15.8% |
| Cache misses | 10 | 0.0% |
| TOTAL: 4 | 24686 | 100.0% |
INND timer:
| Code region | Time | Pct | Invoked | Min(ms) | Avg(ms) | Max(ms) |
|---|---|---|---|---|---|---|
| article cancel | 00:00:00.033 | 0.0% | 57 | 0.000 | 0.579 | 7.000 |
| article cleanup | 00:00:00.136 | 0.0% | 16233 | 0.000 | 0.008 | 0.050 |
| article logging | 00:00:00.434 | 0.0% | 16600 | 0.000 | 0.026 | 0.070 |
| article parse | 00:00:00.220 | 0.0% | 18578 | 0.000 | 0.012 | 0.043 |
| article write | 00:00:10.261 | 0.0% | 14836 | 0.167 | 0.692 | 2.679 |
| artlog/artcncl | 00:00:00.000 | 0.0% | 55 | 0.000 | 0.000 | 0.000 |
| data move | 00:00:00.033 | 0.0% | 27338 | 0.000 | 0.001 | 0.013 |
| hisgrep/artcncl | 00:00:00.009 | 0.0% | 38 | 0.000 | 0.237 | 3.000 |
| hishave/artcncl | 00:00:00.008 | 0.0% | 57 | 0.000 | 0.140 | 2.000 |
| history grep | 00:00:00.000 | 0.0% | 0 | 0.000 | 0.000 | 0.000 |
| history lookup | 00:00:06.373 | 0.0% | 24708 | 0.020 | 0.258 | 1.589 |
| history sync | 00:00:00.026 | 0.0% | 408 | 0.000 | 0.064 | 0.667 |
| history write | 00:00:05.856 | 0.0% | 15999 | 0.085 | 0.366 | 1.284 |
| hiswrite/artcncl | 00:00:00.003 | 0.0% | 19 | 0.000 | 0.158 | 0.400 |
| idle | 22:59:45.139 | 95.7% | 26128 | 1540.485 | 3168.445 | 11028.444 |
| nntp read | 00:00:00.462 | 0.0% | 25743 | 0.000 | 0.018 | 0.054 |
| overview write | 00:00:02.603 | 0.0% | 14836 | 0.024 | 0.175 | 2.618 |
| perl filter | 01:00:50.046 | 4.2% | 15999 | 119.780 | 228.142 | 520.136 |
| python filter | 00:00:00.000 | 0.0% | 0 | 0.000 | 0.000 | 0.000 |
| site send | 00:00:00.308 | 0.0% | 14865 | 0.000 | 0.021 | 0.097 |
| TOTAL: 24:01:06.675 | 24:01:01.950 | 100.0% | - | - | - | - |
INNfeed timer:
| Code region | Time | Pct | Invoked | Min(ms) | Avg(ms) | Max(ms) |
|---|---|---|---|---|---|---|
| article new | 00:00:00.027 | 0.0% | 14843 | 0.000 | 0.002 | 0.048 |
| article prepare | 00:00:00.009 | 0.0% | 39784 | 0.000 | 0.000 | 0.005 |
| article read | 00:00:00.432 | 0.0% | 9946 | 0.000 | 0.043 | 1.143 |
| backlog stats | 00:00:00.017 | 0.0% | 79052 | 0.000 | 0.000 | 0.005 |
| callbacks | 00:00:00.000 | 0.0% | 0 | 0.000 | 0.000 | 0.000 |
| data read | 00:00:00.325 | 0.0% | 43044 | 0.000 | 0.008 | 0.025 |
| data write | 00:00:00.533 | 0.0% | 28352 | 0.000 | 0.019 | 0.086 |
| idle | 23:59:44.853 | 100.0% | 79052 | 650.004 | 1092.760 | 3777.118 |
| status file | 00:00:00.143 | 0.0% | 285 | 0.000 | 0.502 | 2.200 |
| TOTAL: 23:59:47.096 | 23:59:46.339 | 100.0% | - | - | - | - |
nnrpd timer:
| Code region | Time | Pct | Invoked | Min(ms) | Avg(ms) | Max(ms) |
|---|---|---|---|---|---|---|
| idle | 28:59:38.386 | 99.7% | 38851 | 1.455 | 2686.633 | 57202.500 |
| newnews | 00:00:00.000 | 0.0% | 0 | 0.000 | 0.000 | 0.000 |
| nntpwrite | 00:00:01.373 | 0.0% | 97522 | 0.000 | 0.014 | 0.400 |
| readart | 00:00:00.156 | 0.0% | 606 | 0.000 | 0.257 | 34.000 |
| TOTAL: 29:05:28.279 | 28:59:39.915 | 99.7% | - | - | - | - |
Control commands to INND:
| Command | Number |
|---|---|
| L | 1 |
| flush | 3 |
| flushlogs | 2 |
| go | 2 |
| logmode | 2 |
| mode | 148 |
| name | 2 |
| pause | 2 |
| paused | 2 |
| reload | 2 |
| reserve | 2 |
| TOTAL: 11 | 168 |
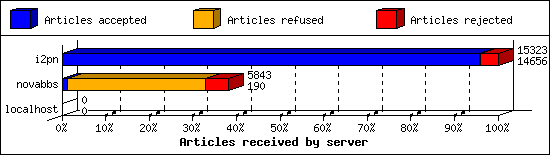
Incoming Feeds (INN):
| Server | Connects | Offered | Taken | Refused | Reject | %Accpt | Elapsed | |
|---|---|---|---|---|---|---|---|---|
| 1 | i2pn | 7 | 15323 | 14656 | 50 | 617 | 95% | 24:39:19 |
| 2 | novabbs | 200 | 5843 | 190 | 4842 | 811 | 3% | 27:07:19 |
| 3 | localhost | 31 | 0 | 0 | 0 | 0 | 0% | 00:00:03 |
| TOTAL: 3 | 238 | 21166 | 14846 | 4892 | 1428 | 70% | 51:46:41 | |
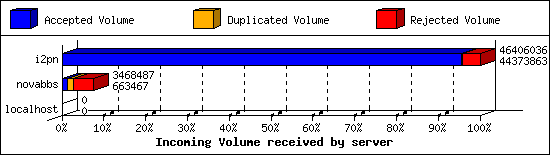
Incoming Volume (INN):
| Server | AcceptVol | DupVol | RejVol | TotalVol | %Acc | Vol/Art | |
|---|---|---|---|---|---|---|---|
| 1 | i2pn | 42.3 MB | 139.8 KB | 1.8 MB | 44.3 MB | 95% | 3.0 KB |
| 2 | novabbs | 647.9 KB | 559.0 KB | 2.1 MB | 3.3 MB | 19% | 3.4 KB |
| 3 | localhost | 0.0 KB | 0.0 KB | 0.0 KB | 0.0 KB | 0% | 0 |
| TOTAL: 3 | 43.0 MB | 698.8 KB | 3.9 MB | 47.6 MB | 90% | 3.0 KB | |
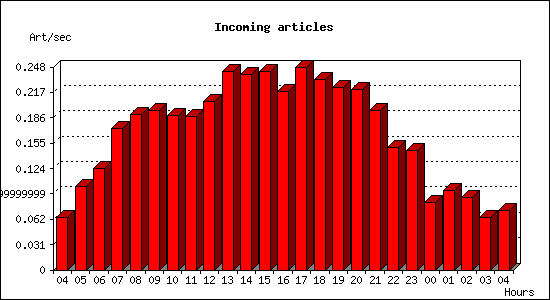
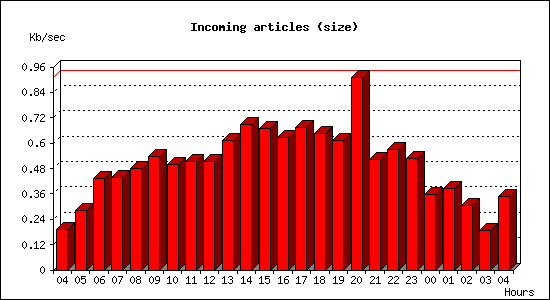
Incoming articles:
| Date | Articles | %Arts | Art/sec | Size | %Size | KB/sec |
|---|---|---|---|---|---|---|
| Sep 24 04:15:02 - 04:59:59 | 174 | 1.2% | 0.06 | 520.1 KB | 1.2% | 0.19 |
| Sep 24 05:00:00 - 05:59:59 | 367 | 2.5% | 0.10 | 1006.8 KB | 2.3% | 0.28 |
| Sep 24 06:00:00 - 06:59:59 | 448 | 3.0% | 0.12 | 1.5 MB | 3.5% | 0.43 |
| Sep 24 07:00:00 - 07:59:59 | 622 | 4.2% | 0.17 | 1.5 MB | 3.6% | 0.44 |
| Sep 24 08:00:00 - 08:59:59 | 684 | 4.6% | 0.19 | 1.7 MB | 3.9% | 0.48 |
| Sep 24 09:00:00 - 09:59:59 | 700 | 4.7% | 0.19 | 1.9 MB | 4.4% | 0.54 |
| Sep 24 10:00:00 - 10:59:59 | 681 | 4.6% | 0.19 | 1.8 MB | 4.1% | 0.50 |
| Sep 24 11:00:00 - 11:59:59 | 674 | 4.5% | 0.19 | 1.8 MB | 4.2% | 0.51 |
| Sep 24 12:00:00 - 12:59:59 | 741 | 5.0% | 0.21 | 1.8 MB | 4.2% | 0.51 |
| Sep 24 13:00:00 - 13:59:59 | 872 | 5.9% | 0.24 | 2.1 MB | 5.0% | 0.61 |
| Sep 24 14:00:00 - 14:59:59 | 862 | 5.8% | 0.24 | 2.4 MB | 5.6% | 0.69 |
| Sep 24 15:00:00 - 15:59:59 | 873 | 5.9% | 0.24 | 2.4 MB | 5.5% | 0.67 |
| Sep 24 16:00:00 - 16:59:59 | 785 | 5.3% | 0.22 | 2.2 MB | 5.1% | 0.63 |
| Sep 24 17:00:00 - 17:59:59 | 890 | 6.0% | 0.25 | 2.4 MB | 5.5% | 0.68 |
| Sep 24 18:00:00 - 18:59:59 | 836 | 5.6% | 0.23 | 2.3 MB | 5.3% | 0.65 |
| Sep 24 19:00:00 - 19:59:59 | 802 | 5.4% | 0.22 | 2.2 MB | 5.0% | 0.61 |
| Sep 24 20:00:00 - 20:59:59 | 794 | 5.4% | 0.22 | 3.2 MB | 7.4% | 0.91 |
| Sep 24 21:00:00 - 21:59:59 | 701 | 4.7% | 0.19 | 1.8 MB | 4.3% | 0.52 |
| Sep 24 22:00:00 - 22:59:59 | 537 | 3.6% | 0.15 | 2.0 MB | 4.7% | 0.57 |
| Sep 24 23:00:00 - 23:59:59 | 524 | 3.5% | 0.15 | 1.8 MB | 4.3% | 0.53 |
| Sep 25 00:00:00 - 00:59:59 | 299 | 2.0% | 0.08 | 1.2 MB | 2.9% | 0.36 |
| Sep 25 01:00:00 - 01:59:59 | 351 | 2.4% | 0.10 | 1.4 MB | 3.2% | 0.38 |
| Sep 25 02:00:00 - 02:59:59 | 320 | 2.2% | 0.09 | 1.1 MB | 2.5% | 0.30 |
| Sep 25 03:00:00 - 03:59:59 | 233 | 1.6% | 0.06 | 673.5 KB | 1.5% | 0.19 |
| Sep 25 04:00:00 - 04:15:01 | 66 | 0.4% | 0.07 | 314.2 KB | 0.7% | 0.35 |
| TOTAL: 23:59:59 | 14836 | 100.0% | 0.17 | 42.9 MB | 100.0% | 0.51 |
Sites sending bad articles:
| Server | Total | Group | Dist | Duplic | Unapp | TooOld | Site | Line | Other | |
|---|---|---|---|---|---|---|---|---|---|---|
| 1 | i2pn | 981 | 4 | 0 | 46 | 0 | 0 | 0 | 0 | 931 |
| 2 | novabbs | 785 | 0 | 0 | 188 | 0 | 0 | 0 | 0 | 597 |
| TOTAL: 2 | 1766 | 4 | 0 | 234 | 0 | 0 | 0 | 0 | 1528 | |
Unwanted newsgroups [Top 20]:
| Newsgroup | Count |
|---|---|
| 24hoursupport.helpdesk | 2 |
| alt.rec.guns | 2 |
| TOTAL: 2 | 4 |
INND Perl filter [Top 20]:
| Reason | Count |
|---|---|
| EMP (phn path) | 550 |
| Exceeds Spam Level | 486 |
| Poison newsgroup | 79 |
| EMP (phn nph) | 43 |
| HTML Image Tags | 1 |
| Binary: misplaced com | 1 |
| TOTAL: 6 | 1160 |
NoCeM on Spool:
| Id | Good | Bad | Unique | Total |
|---|---|---|---|---|
| bleachbot@httrack.com | 24 | 0 | 28 | 28 |
| TOTAL: 1 | 24 | 5 | 28 | 28 |
Miscellaneous innd statistics [Top 10]:
| Event | Server | Number |
|---|---|---|
| Including strange strings | ||
| i2pn | 364 | |
| novabbs | 4 | |
| TOTAL: 2 | 368 | |
| TOTAL: 1 | 368 | |
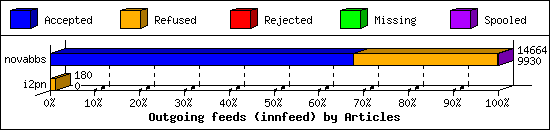
Outgoing Feeds (innfeed) by Articles:
| Server | Offered | Taken | Refused | Reject | Miss | Spool | %Took | Elapsed | |
|---|---|---|---|---|---|---|---|---|---|
| 1 | novabbs | 18280 | 9930 | 4709 | 17 | 0 | 8 | 54% | 23:59:57 |
| 2 | i2pn | 183 | 0 | 180 | 0 | 0 | 0 | 0% | 12:07:15 |
| TOTAL: 2 | 18463 | 9930 | 4889 | 17 | 0 | 8 | 53% | 36:07:12 | |
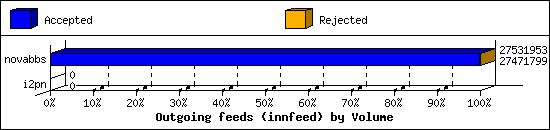
Outgoing Feeds (innfeed) by Volume:
| Server | AcceptVol | RejectVol | TotalVol | Volume/sec | Vol/Art | Elapsed | |
|---|---|---|---|---|---|---|---|
| 1 | novabbs | 26.2 MB | 58.7 KB | 26.3 MB | 0.3 KB/s | 2.7 KB | 23:59:57 |
| 2 | i2pn | 0.0 KB | 0.0 KB | 0.0 KB | 0.0 KB/s | 0 | 12:07:15 |
| TOTAL: 2 | 26.2 MB | 58.7 KB | 26.3 MB | 0.2 KB/s | 2.7 KB | 36:07:12 | |
NNRP readership statistics:
| System | Conn | Arts | Size | Groups | Post | Rej | Elapsed | |
|---|---|---|---|---|---|---|---|---|
| 1 | novabbs | 6115 | 11 | 262.8 KB | 11 | 0 | 0 | 05:19:33 |
| 2 | ip68-2-45-86.ph.ph.cox.net | 18 | 4 | 237.4 KB | 4 | 0 | 0 | 23:45:30 |
| TOTAL: 2 | 6133 | 15 | 500.3 KB | 15 | 0 | 0 | 29:05:10 | |
NNRP readership statistics (by domain):
| System | Conn | Arts | Size | Groups | Post | Rej | Elapsed | |
|---|---|---|---|---|---|---|---|---|
| 1 | ? | 6115 | 11 | 262.8 KB | 11 | 0 | 0 | 05:19:33 |
| 2 | *.ph.ph.cox.net | 18 | 4 | 237.4 KB | 4 | 0 | 0 | 23:45:30 |
| 3 | *.org | 20 | 0 | 0.0 KB | 0 | 0 | 0 | 00:00:02 |
| 4 | *.sfj.corp.censys.io | 2 | 0 | 0.0 KB | 0 | 0 | 0 | 00:00:00 |
| 5 | *.security.ipip.net | 1 | 0 | 0.0 KB | 0 | 0 | 0 | 00:00:03 |
| TOTAL: 5 | 6156 | 15 | 500.3 KB | 15 | 0 | 0 | 29:05:10 | |
NNRP auth users [Top 20]:
| User | Conn |
|---|---|
| retrobbs1 | 236 |
| TOTAL: 1 | 236 |
NNRP total resource statistics [Top 20]:
| System | User(ms) | System(ms) | Idle(ms) | Elapsed |
|---|---|---|---|---|
| ip68-2-45-86.ph.ph.cox.net | 1.556 | 0.628 | 0.041 | 23:45:30 |
| novabbs | 289.052 | 35.392 | 0.454 | 05:19:33 |
| scan-141.security.ipip.net | 0.040 | 0.004 | 0.000 | 00:00:03 |
| i2pn2.org | 0.884 | 0.144 | 0.047 | 00:00:02 |
| worker-18.sfj.corp.censys.io | 0.088 | 0.008 | 0.000 | 00:00:00 |
| TOTAL: 5 | 291.620 | 36.176 | 0.542 | 29:05:10 |
Curious NNRP server explorers [Top 20]:
| System | Conn |
|---|---|
| i2pn2.org | 20 |
| worker-18.sfj.corp.censys.io | 2 |
| scan-141.security.ipip.net | 1 |
| TOTAL: 3 | 23 |
NNRP unrecognized commands (by host):
| System | Conn |
|---|---|
| novabbs | 22 |
| scan-141.security.ipip.net | 4 |
| TOTAL: 2 | 26 |
NNRP unrecognized commands (by command):
| Command | Count |
|---|---|
| GET / HTTP/1.1 | 9 |
| Host: wwcqkwfo5yhe6uribv5tzylk25j5hkdk6g... | 7 |
| Connection: close | 2 |
| User-Agent: MYOB/6.66 (AN/ON) | 2 |
| Accept-Encoding: gzip, deflate | 1 |
| Accept-Encoding: identity | 1 |
| sentry-trace: 00-804e8d58db2b413e89f7bbd... | 1 |
| Host: 157.230.63.40:119 | 1 |
| Host: news-i2pn.i2p | 1 |
| User-Agent: HTTP Banner Detection (https... | 1 |
| TOTAL: 10 | 26 |
NNRP client timeouts [Top 20]:
| System | Conn | Peer |
|---|---|---|
| worker-18.sfj.corp.censys.io | 2 | 2 |
| ip68-2-45-86.ph.ph.cox.net | 1 | 0 |
| TOTAL: 2 | 3 | 2 |
Newsgroup request counts (by category):
| Category | Count | Pct | |
|---|---|---|---|
| 1 | rocksolid | 6 | 40.0% |
| 2 | alt | 4 | 26.7% |
| 3 | rec | 4 | 26.7% |
| 4 | comp | 1 | 6.7% |
| TOTAL: 4 | 15 | 100.0% | |
Newsgroup request counts (by newsgroup) [Top 100]:
| Newsgroup | Count | |
|---|---|---|
| 1 | alt.arts.poetry.comments | 4 |
| 2 | rec.bicycles.misc | 4 |
| 3 | rocksolid.shared.test | 3 |
| 4 | rocksolid.shared.encryption | 2 |
| 5 | rocksolid.shared.rocksolid | 1 |
| 6 | comp.lang.python | 1 |
| TOTAL: 6 | 15 | |
